Home » Posts tagged 'precious metals' (Page 16)

Tag Archives: precious metals

Olduvai
Click on image to purchase

Olduvai III: Catacylsm
Click on image to purchase

Post categories

Post Archives by Category

MARKET MELTDOWN CONTINUES: Gold & Silver Prices Begin To Disconnect

MARKET MELTDOWN CONTINUES: Gold & Silver Prices Begin To Disconnect

As the BLOOD continues to run on Wall Street, gold and silver were the few assets trading in the green today.  As I have mentioned in past articles and interviews, investors need to get used to this sort of trading activity.  Even though the Dow Jones Index ended off its lows of the day, it shed another 458 points while the Nasdaq declined 190 points and the S&P fell 60.

As the broader markets sold off, the gold price increased $15 while silver jumped by $0.25.  However, if we look at these markets during their peak of trading, the contrast is even more remarkable:

At the lows of the day, the Dow Jones Index fell 730 points or 3%, while the S&P 500 fell 3.2% and the Nasdaq declined by 3.8%.  Also, as I expected, the oil price fell along with the broader markets by dropping 2.7%.  If individuals believe the oil price will continue towards $100, due to supply and demand fundamentals put forth by some energy analysts, you may want to consider one of the largest Commercial Net Short positions in history.  Currently, the Commercial Net Short position is 738,000 contacts.  When the oil price was trading at a low of $30 at the beginning of 2016, the Commercial Net Short position was only 180,000 contracts.

Furthermore, if we agree that supply and demand forces are impacting the oil price to a certain degree, does anyone truly believe oil demand won’t fall when the stock market drops by 50+%???  I forecast that as market meltdown continues, the oil price will decline as oil demand falls faster than supply.

Now, when the markets were at their lows today, gold at its peak was up $20 while silver increased by $0.44.  Of course, this type of trading activity won’t happen all the time, and we could see a selloff in all assets some days.

…click on the above link to read the rest of the article…

Money as a Measuring Stick

Money as a Measuring Stick

Imagine if the world’s metre sticks all grew or shrunk a bit each year. That would make for a confusing system of weights and measures, wouldn’t it? Well, that is exactly what happens with money.

We have been measuring the world around us for thousands of years. Units like feet and cubits have been used for distances, pounds and kilograms to measure weight, and dollars and yen to measure economic value. Measuring value, however, is by far the most complicated of the measurements that must be taken. This is because – unlike the other units – the various items that have been used to represent dollars and yen are constantly fluctuating in value.

The British Pound, or lb

Monetary units have always been closely tied up with units of weight. For instance, the word “pound” has been used to describe both the British monetary unit (£) and the weight (lb). The pound weight was originally based on wheat. In 1266, King Henry III decreed that the British unit referred to as the grain should be defined as the weight of a corn of wheat “well dried, and gathered out of the middle of the ear.” Thirty-two grains were to be equal to a pennyweight, twenty pennyweights equal to an ounce, and twelve ounces added up to a pound. So the early English pound, otherwise known as the Tower pound, was comprised of 7,680 “well-dried” grains from the middle of an ear of wheat.

Grains of wheat

The Tower pound wasn’t the only pound weight used in England. The Troy pound, used for gold and silver, contained 5,760 grains, while the Merchant pound was made up of 6,750 grains. To add to the confusion, the avoirdupois pound would contain 7,000 grains.

The Exchequer Standard

Although the grain unit served as the basis for weights, people didn’t go about their regular business of measuring the weights of things by counterbalancing them against tiny grains of wheat. Imagine how awkward it would be to go to the local market to ask for an ounce of meat! The butcher would have had to count out 640 grains and then counterbalance them on a scale against the hunk of meat, an arduous process that would have brought the gears of trade to a near halt. Buyers would have been constantly accusing sellers of not using appropriately dry grains, adding to the confusion.

…click on the above link to read the rest of the article…


Russia Is Hoarding Gold At The Fastest Pace In 12 Years

De-dollarization is accelerating…

Russia is adding gold to its reserves at the fastest pace in 12 years …and dumping US Treasuries at the fastest pace since 2011.

The Central Bank of Russia (CBR) has been increasing its holdings of gold every month since March 2015. The country is currently the sixth-largest gold owner after the United States, Germany, Italy, France and China.

According to the CBR, gold reserves spiked to $455.2 billion between March 2 and 9 hitting a historic high not seen since September 2014.

“Our international reserves increased by $2.9 billion or 0.6 percent in a single week, mainly on the strength of positive re-evaluation,” said the regulator.

And in fact 2018 has seen the fastest increase in the value of Russia’s gold reserves since 2006…

In January, RT notes  that Russia surpassed China, which reportedly held 1,843 tons of the precious metal at that time. Over the last 15 years, Moscow and Beijing have been aggressively accumulating gold reserves to reduce their dependence on the US dollar.

According to World Gold Council data, last year the CBR became a world leader in stockpiling gold.

The bank has more than doubled the pace of its gold purchases, statistics showed. It has been increasing Russia’s gold reserves to meet the goal set by President Vladimir Putin to make it less vulnerable to geopolitical risks. The Russian gold cache has increased by more than 500 percent since 2000.

…click on the above link to read the rest of the article…

Four Charts: Debt, Defaults and Bankruptcies To See Higher Gold

Four Charts: Debt, Defaults and Bankruptcies To See Higher Gold

– $8.8B Sprott Inc. sees higher gold on massive consumer debt, defaults & bankruptcies 
– Rising and record U.S. debt load may cause financial stress, weaken dollar and see gold go higher
– Massive government and consumer debt eroding benefits of wage growth (see chart)

by Bloomberg

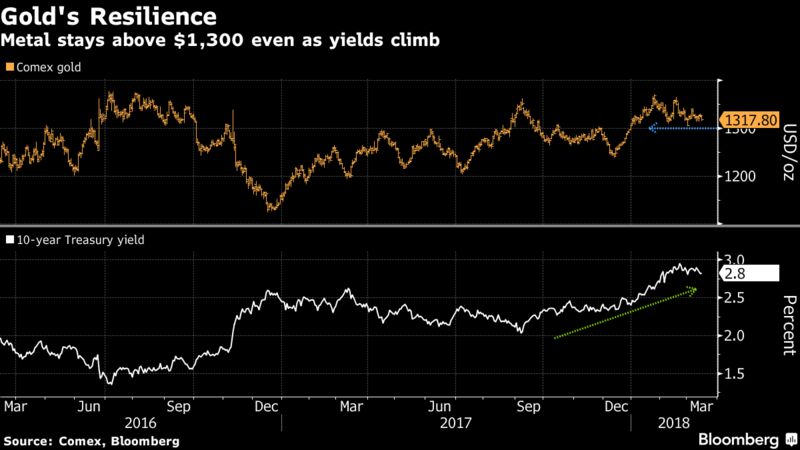
Rising U.S. interest rates, usually bad news for gold, are instead feeding signs of financial stress among debt-laden consumers and helping drive demand for the metal as a haven.

That’s the argument of Sprott Inc., a precious-metals-focused fund manager that oversees $8.8 billion in assets. The following four charts lay out the case for why gold could be poised to rise even as the Federal Reserve tightens monetary policy.

Gold futures have managed to hold on to gains this year, staying above $1,300 an ounce even as the Fed raised borrowing costs in December for a fifth time since 2015 and is expected to do so again next week.

The increases followed years of rates near zero that began in 2008. Low rates coupled with the Fed’s bond-buying spree contributed to the precious metal’s advance to a record in 2011. Higher rates typically hurt the appeal of gold because it doesn’t pay interest.

Paper Losses

The U.S. posted a $215 billion budget deficit in February, the biggest in six years, as revenue declined, Treasury Department data show. That’s boosting the government debt load, fueling forecasts for higher yields and raising the specter of paper losses for international investors who own $6.3 trillion of U.S. debt.

Slowing demand for Treasuries from overseas buyers is contributing to dollar weakness against the currency’s major peers, helping support gold prices, according to Trey Reik, a senior portfolio manager at Sprott’s U.S. unit.

Debt-Laden Shoppers

The yield on the 10-year U.S. Treasury, which has been in decline for more than three decades, has risen over 40 basis points this year as the Fed raised rates and U.S. debt ballooned to more than $20 trillion.

…click on the above link to read the rest of the article…

The Demise of the Dollar: The Rush to Gold is Here

The Demise of the Dollar: The Rush to Gold is Here

These days, the dollar is joined by the euro and the yen as accepted currencies. No longer dominant, the dollar is losing its global position. Can it survive?

Early in the 20th century, the US was the most powerful nation on earth, and the dollar reflected that power. Our gold reserves were larger than those of any other country, thus setting the standard worldwide. The US dollar was, indeed, good as gold.

By the late 1940’s, the Federal Reserve started to print money that wasn’t back by gold. Rising inflation only encouraged the government to print more money without the gold reserves to back it. Gold prices rose to such new heights, all US currency stopped being back by any gold. The powerful US dollar began to turn into monopoly money. Gold price tripled as the dollar continued to lose value.

That’s how the Petrodollar was born, a political move more than a smart currency move. With the US importing more oil than anyone else from Saudi Arabia, then Secretary of State Kissinger arranged to have the price of oil based on the US dollar. All countries were to pay for oil with dollars.

…click on the above link to read the rest of the article…

The Race to Repatriate Gold Reserves Accelerates

The Race to Repatriate Gold Reserves Accelerates


For years, a trend has developed that, much to the dismay of global financial elites, has taken hold and will only accelerate from this point on.

The trend I speak of is none other than the global repatriation of gold reserves from Western powers such as the United States and the United Kingdom. Since the end of World War 2, both have been the main depositories of gold reserves for countries around the world.

This was once driven out of necessity. These two locations were considered the safest places in the world to keep hard money assets after many countries found their reserves ransacked and their countryside ravaged by war.

Fast forward to today. People are scratching their heads, wondering why they are keeping their hard money in far-off lands, protected by countries they are increasingly disconnected with, who are irresponsible in their daily financial lives, running up massive deficits and exploding debt levels.

Just this week, Hungary joined the growing list of countries who have demanded their physical gold reserves returned to them, perhaps sensing the global tide of unrest.

Deciding to bring back 100,000 ounces—or 3 tons of the yellow metal—they join the ranks of other countries that have recently made this decision. Countries such as Austria, Germany and the Netherlands.

For years I have written about each of these repatriations, and for years I have stated that more and more countries would make the wise decision to try and get back as much of their gold as possible, before they are left empty handed.

Austria demanded 15 tons of gold and indicated they plan on bringing home much more. Germany shocked the world by announcing a long-term plan to bring back the majority of its foreign-held gold deposits from the United States and France, while the Netherlands repatriated 120 tons, as well.

Sooner or later, any country that is smart and has gold held in foreign locations will wise up to this trend and demand to have their gold returned to them as well, to help protect their people in the coming financial turmoils that are sure to arise in the future.

…click on the above link to read the rest of the article…

How Will Gold Prices Behave During Economic Crisis?

gold prices during economic crisis

It is generally well known in economic circles and in the general public that precious metals, including gold, tend to be the go-to investment during times of fiscal uncertainty. There is a good reason for this. Precious metals have foundation qualities that provide trade stability; these include inherent rarity (rather than artificially engineered rarity such as that associated with cryptocurrencies), tangibility (you can hold gold in your hand, and it is relatively difficult to destroy), and precious metals are easy to trade. Unless you are attempting to make transactions overseas, or in denominations of billions of dollars, precious metals are the most versatile, tangible trading platform in existence.

There are some limitations to metals, but the most commonly parroted criticisms of gold are generally incorrect. For example, consider the argument that the limited quantities of gold and silver stifle liquidity and create a trade environment where almost no one has currency to trade because so few people can get their hands on precious metals. This is a naive notion built upon a logical fallacy.

Gold backed paper currencies existed for centuries in tandem with the metals trade. Liquidity was rarely an issue, and when such events did occur, they were short lived. In fact, the last great liquidity crisis occurred in 1914, the same year the Federal Reserve began operations and the same year that WWI started. This crisis was, as always, practically fabricated by central banks around the world. Benjamin Strong, the head of the New York Fed in 1914 and an agent of the JP Morgan syndicate, had interfered with the normal operations of gold flows into the U.S. and thus sabotaged the natural functions of the gold standard.

Central banks in Germany, France and England also applied influence to disrupt currency and gold flows, causing a global panic. This engineered disruption seemed to take place through conscious co-operation between central banks. Does any of this sound familiar?

…click on the above link to read the rest of the article…
Tom Cloud Precious Metals Update: Market Update March 2018

Tom Cloud Precious Metals Update: Market Update March 2018

In the newest update, Tom Cloud discusses what is going on in the precious metals market in March.  He explains that while the small retail investor has pulled back on gold and silver buying, his company have seen the biggest purchases by larger investors.  This makes perfect sense because the smaller retail investor tends to purchase when the price is going higher while the larger investor acquires more during sell0ffs or lows.

Tom also includes information on his services.  I have to say if an individual is interested in storing metals, you should give Tom Cloud a call.  Tom Cloud offers the best rates for storing metals than the overwhelming majority of dealers.  If you go to the LOWEST COST PRECIOUS METALS STORAGE PAGE, you will see that the text and images are blurred.  I had to do that because his low rates caused such a stir in the industry, the storage services asked to remove that information.  Basically, the storage service provides plans for many dealers in the industry, but because Tom has been around for 40+ years and has been an excellent client, he received the best rates.

Now, for those who don’t believe in storing metals in a third-party facility, please don’t leave comments explaining why people shouldn’t store metals… we all know the reasons.  However, some people like to store their metals in several locations, which is probably a wise thing to do.  Also, some wealthy investors don’t have a choice because it doesn’t make sense to store all their metal at their home.

One more important thing.  The reason I sponsor Tom Cloud on my site is due to the fact that he is one of the most upfront, honest and lowest cost precious metals dealers in the industry.  Also, Tom and his associate Dan, do not try to HARD SELL those who call them.  They don’t mind answering questions, even if a person does not purchase.  There are some dealers that won’t even spend much time with a would-be client if they only had a little money to spend.  I find that sort of business practice totally unprofessional.

The Inflation Scare of 2012

THE INFLATION SCARE OF 2012

I would like to take you back to 2012. Just a few short years after the soul-searching-scary Great Financial Crisis of 2008-9, market participants had finally given up their worry of the next great depression enveloping the globe, but had replaced it with an equally fervent fear that inflation would uncontrollably explode. The Federal Reserve had recently completed their second round of quantitative easing, much to the chagrin of a large group of distinguished economic thinkers who had gone as far as writing an open letter to the Fed Chairman pleading he reconsider the program.

You remember that old A&E show Intervention? Well, this was like an academic peer episode – more neck beards and sophisticated language, but sadly, the same amount of crying.

So when the Fed’s favourite inflation gauge, the Core PCE index, spiked up to 2% in 2012, it was especially hard on Chairmen Bernanke. After all, his colleagues had just warned him that this was about to happen.

…click on the above link to read the rest of the article…

Gold–The Next Big Surprise

GOLD – THE NEXT BIG SURPRISE

It’s been a while since I have written about precious metals. To some extent, this has been on purpose. I am a long-term fan of our little yellow friend, but there are definitely periods when I am more bullish than others. Over the past half year, my enthusiasm for precious metals has been tempered by one important chart…

During this period, the yield on the US 5-year TIPS (Treasury Inflation Protected Security) has been steadily rising. It’s not a perfect comparison, but you can think about this as the risk free real yield – the yield you will earn after inflation.

Many market pundits mistakenly believe inflation is the most important determinant of gold’s price level. That’s simply not the case. Although the great bull market of the late 1970’s was accompanied by high inflation, the 2005-2011 rise was in the midst of tame inflation, with CPI even ticking below zero for a period.

No, inflation is just one part of the puzzle for gold. The other important piece is the nominal interest rate. In the 1970’s, inflation was running at 10% or even higher. But for a while, interest rates were lower than the inflation rate. The real yield was therefore negative. In this environment, gold provided an attractive alternative to holding cash and other fixed income instruments that were suffering from financial repression. After all, gold is also a currency, with no yield. Yet the real benefit is that it is no one’s liability. With positive real yields it is difficult to justify owning gold, but push those yields into negative territory, and suddenly gold becomes more appealing.

And that’s exactly what happened in the 2000s. Inflation was low, but interest rates were even lower, creating one of the greatest precious metals bull markets of all time.


…click on the above link to read the rest of the article…

Silver Looks Way Better Than Gold Right Now

Silver Looks Way Better Than Gold Right Now

Normally the action in the gold and silver futures markets tends to be pretty similar, since the same general forces affect both precious metals. When inflation or some other source of anxiety is ascendant, both metals rise, and vice versa.

But lately – perhaps in a sign of how confused the world is becoming – gold and silver traders have diverged. Taking gold first, the speculators – who tend to be wrong at major inflection points – remain extremely bullish. Commercial traders, meanwhile – who tend to be right when speculators are wrong – are extremely bearish, with short positions more than double their longs. Historically that’s been a setup for a big drop in gold’s price.

Viewed as a chart with the gray bars representing speculators and red bars the commercials, and where divergence is bearish and convergence bullish, the result is pretty ugly.

But now check out silver. Where gold futures speculators’ long positions are three times their short bets, silver spculators are actually more short than long. In other words, the people who are usually wrong are bearish. The commercials, meanwhile, are almost in balance, which is usually bullish for silver’s subsequent action.

Shown graphically, speculators and commercials are meeting the middle at zero, something that’s both very rare and very positive.

What does this mean? One possible explanation is that silver has gotten too cheap relative to gold and needs to be revalued. That could happen in several ways, with both metals rising but silver rising more, or both falling but silver falling less. Or with gold dropping while silver rises, as improbable as that seems.

As the chart below illustrates, gold has recently been rising relative to silver (or silver has been falling relative to gold) with the gold/silver ratio now close to 80, meaning that it takes 80 ounces of silver to buy one ounce of gold.

…click on the above link to read the rest of the article…

SILVER INVESTMENT: The Lowest Risk, Highest Return Potential vs. Stocks & Real Estate

SILVER INVESTMENT: The Lowest Risk, Highest Return Potential vs. Stocks & Real Estate

While silver is completely off the radar to most investors, it will turn out to be one of the best investments to own as the massive amount of leverage in the stock and real estate market evaporates.  Unfortunately, investors, today are no longer capable of recognizing when an asset displays a HIGH or LOW risk.  Thus, fundamental indicators are ignored as the investors continue the insane strategy of “Buying the Dip.”

A prudent investor is able to spot when an asset becomes a high risk and then has the sense to move his or her funds into one that is a lower risk.  However, the majority of investors do not follow this practice as they are caught by surprise when a Market Crash occurs… again and again and again.  Even worse, when investors are shown that the indicators are pointing to assets that are extremely risky, then ignore it and continue business as usual.

Today, complacency has turned investors’ brains into mush.  They are no longer able to discern RIGHT from WRONG.  So, when the market really starts to correction-crash, they will hold on to their stocks waiting for Wall Street’s next BUY THE DIP call.

Regardless, if we can understand the fundamentals, then we would be foolish to keep most of our investment funds in Stock and Real Estate assets.  The following chart follows the KISS Principle – Keep It Simple Stupid:

You don’t need to be a highly-trained financial or technical analyst to spot the HIGH vs. LOW-RISK assets in the chart above.  Hell, you don’t even need to see the figures in the chart.  If we understand that all markets behave in cycles, then it’s common sense that asset prices will peak and decline.

…click on the above link to read the rest of the article…

The Failure of Fiat Currencies

The Failure of Fiat Currencies

We work hard for our money, as we think it has long-lasting value. That value can buy us other things that we want. It seems like a good exchange. However, few of us consider how extrinsic the value of money really is. In reality, we are dealing in valueless fiat currencies. 

At one time, our money was backed by the tangible value of gold or other precious metals, legal tender for anything of equal value.

That is not the case any longer. The value of a dollar bill these days is what the government says it is. This arbitrary value is dependent on the whim of the government. And the government can print money like a copy machine run amok. There are no limits to how much money can be put into circulation. That is because this money isn’t backed by any real value, it’s called fiat currency.

The US dollar became fiat currency when it stopped being backed by gold over 46 years ago and it has lost 97 percent of its value since the establishment of the Federal Reserve in 1913.

Apart from cryptocurrencies, all the world’s major countries are using fiat currency.

Since Roman times, fiat money has failed spectacularly throughout history due to the same pattern of rapid devaluation and then total collapse. The Romans used a 100 percent pure silver coin called the denarius at the start of the first century. By mid-century, during Nero’s rule, the denarius only contained 94% silver. By 100 A.D., the silver content had been reduced to 85%. The value of the coin was decreasing steadily. This worked well for Nero and his followers, who no longer had to pay their debt at the full, actual value while additionally increasing their own wealth. During the next century, the coin was made of less than 50% silver.

…click on the above link to read the rest of the article…

Top Gold Producers Mine Supply To Fall Right When Potential Investment Demand To Surge

Top Gold Producers Mine Supply To Fall Right When Potential Investment Demand To Surge

The gold market is setting up for a perfect storm as the top mining producers’ supply is forecasted to decline right when demand is likely to surge.  The surge in gold demand will occur as the broader stock markets roll over and begin their inevitable massive correction.  Due to the tremendous amount of leverage in the system, the coming market correction will be quite violent at times.  If investors believe the correction is over, and high times are here again, then they haven’t learned anything about the cyclical nature of markets.

For example, I have stated that Bitcoin and the Crypto Market are classic bubbles, and wasn’t at all surprised by the collapse of the Bitcoin price from $20,000 to $6,500 in a short period.  However, now that Bitcoin and the Crypto Market have reversed, I see analysis and comments that anyone suggesting that Bitcoin is in a bubble is flat out wrong.  I would kindly like to remind these individuals that markets don’t go down in a straight line.

We can see this quite clearly in the following two charts which came from the article, As Bitcoin Nears $11,000, Here’s A History Of Its Biggest Ups And Downs:

The price of Bitcoin in 2013 surged higher, crashed and then corrected higher before falling over the following year.  The same thing took place in 2013 and 2014:

At the end of 2013, the Bitcoin price surged more than ten times to a high of $1,150 before falling to nearly $500, reversed direction and shot back up to $900+.  However, over the next year, the Bitcoin price trend was lower.

Now, I put this chart together to compare the current Bitcoin price trend with the previous graphs:

…click on the above link to read the rest of the article…

Olduvai IV: Courage
Click on image to read excerpts

Olduvai II: Exodus
Click on image to purchase

Click on image to purchase @ FriesenPress