Home » Posts tagged 'debt' (Page 16)
Tag Archives: debt
The State of the American Debt Slaves, Q1 2020
The State of the American Debt Slaves, Q1 2020
How are consumers positioned going into the crisis?
Most of the first quarter was still the Good Times, but in later February and early March it hit the fan, as markets were crashing. In mid-March lockdowns started to roll across the country, and the layoffs by the tens of millions commenced. So how were consumers positioned going into this crisis? Many of them, up to their eyeballs in debt.
Consumer debt – student loans, auto loans, and revolving credit such as credit cards and personal loans but excluding housing-related debts such as mortgages and HELOCs – jumped by $153 billion at the end of the first quarter, compared to Q1 a year earlier, or by 3.8%, to $4.15 trillion (not seasonally adjusted), according to Federal Reserve data:

In March, the problems already became apparent. On a seasonally adjusted basis (the above is not seasonally adjusted), consumer credit fell 0.3% in March from February, and except for December 2015, when a large statistical adjustment was made, this was the first month-to-month decline since the Great Recession.
OK, we know consumer credit is going to plunge. Balances of auto loans and credit loans will come down not because consumers are suddenly more prudent, but because they have lost their jobs and will default on their credit cards and auto loans. Those defaults were already happening going into the crisis, and they’re now accelerating. When lenders write those loans off, the consumer credit balances come down. Nothing to do with prudence of consumers but with losses at lenders.
…click on the above link to read the rest of the article…
US National Debt Spiked by $1.5 trillion in 6 Weeks, to $25 trillion. Fed Monetized 90%
US National Debt Spiked by $1.5 trillion in 6 Weeks, to $25 trillion. Fed Monetized 90%
I’d never imagined I’d ever see this sort of spike, though in recent years I added an upward arrow with “Debt out the wazoo” to my charts, not realizing just how factually accurate this technical term would become.
The US gross national debt – the total of all Treasury securities outstanding – jumped by $1.05 trillion with a T in the four weeks since April 7 and by $1.54 trillion in the six weeks since March 23, to $25.06 trillion, the Treasury department reported today.
Those trillions are whizzing by so fast it’s hard to even seen them. WOOSH… What was that? Oh, just another trillion. The flat spots in the chart are the periods when the debt bounced into the debt ceiling. Yeah, those were the days!

I’ve been lamenting and lambasting the stupendous growth of the US national debt since 2011, the beginning of my illustrious career as a gnat in the big world of financial media. And through all these years, I’d never imagined that I’d ever see this sort of spike in the US debt, though in recent years I’ve been adding an upward arrow and the green label “Debt out the wazoo” to these charts, not realizing just how factually accurate this technical term would become.
The US debt was even surging at an accelerating rate during the “Best Economy Ever,” when there should have been a surplus and a reduction in the debt, so that the government can go into debt during bad times.
I wrote back then, for example on February 19, when the debt had spiked by $1.3 trillion over the past 12 months to $23.3 trillion: “But these are the good times. And we don’t even want to know what this will look like during the next economic downturn.”
…click on the above link to read the rest of the article…
U.S. Public Debt Increases More In April Than During Entire 2019
U.S. Public Debt Increases More In April Than During Entire 2019
The U.S. public debt increased at the fastest rate ever during April. Due to the negative economic impacts stemming from the global contagion, the U.S. Treasury increased the federal debt by a whopping $1.3 trillion in a single month.
The additional $1.3 trillion of U.S. public debt during April would purchase approximately one-third of all the physical gold investment bullion in the world, which currently stands at $4.1 trillion. In just one month (April), Uncle Sam’s printing press or digital monetary liquidity could purchase 750 million oz of gold. That 750 million oz of gold would be 67% of the total Central Bank Gold Reserves.
So, at some point, the Fed and central bank monetary insanity will come back to BITE THEM HARD… LOL.
According to the data from TreasuryDirect.gov, the U.S. public debt increased by $1,287 billion ($1.28 trillion) during April:

Now compare that to the average monthly U.S. public debt increase of $106 billion in 2019. Thus, the U.S. public debt increase in April was even higher than in Full-Year 2019:

While it took twelve months for the U.S. Treasury to add $1,207 billion in debt (2019), it only took one month to increase it to $1,287 billion (April). I don’t believe Americans understand how much damage is being done to the U.S. Government Balance Sheet. Unfortunately, it’s only going to get worse going forward.
It is impossible to forecast the collapse of the U.S. Bond Market or U.S. Dollar. However, the current monetary policy taking place suggests that it’s going to be SOONER rather than LATER.
And, it’s all due to the Collapse in U.S. oil demand. Keep an eye on the U.S. Oil Industry and oil price for clues how quickly the domestic economy and financial system will head into a depression.
Game Over For Oil, The Economy is Next
GAME OVER FOR OIL, THE ECONOMY IS NEXT

It’s game-over for most of the U.S. oil industry.
Prices have collapsed and storage is nearly full. The only option for many producers is to shut in their wells. That means no income. Most have considerable debt so bankruptcy is next.
Peggy Noonan wrote in her column recently that “this is a never-before-seen level of national economic calamity; history doesn’t get bigger than this.” That is the superficial view.
Coronavirus has changed everything. The longer it lasts, the less the future will look anything like the past.
Most people, policy makers and economists are energy blind and cannot, therefore, fully grasp the gravity or the consequences of what is happening.
Energy is the economy and oil is the most important and productive portion of energy. U.S. oil consumption is at its lowest level since 1971 when production was only about 78% of what it was in 2019. As goes oil, so goes the economy…down.
The old oil industry and the old economy are gone. The energy mix that underlies the economy will be different now. Oil production and price are unlikely to regain late 2018 levels. Renewable sources will fall behind along with efforts to mitigate climate change.
It’s Really Bad
2020 global liquids demand may average 20 mmb/d less than in 2019 (Figure 1). This estimate is really a thought experiment because it is impossible to know what supply and demand are in the present much less in the next quarter or beyond. This is a time of unimaginable flux and uncertainty because no one knows how long economic activity will be depressed, how long it will take to recover or if it will recover.
…click on the above link to read the rest of the article…
Powell: “Now Is Not The Time To Be Concerned About Debt”
Powell: “Now Is Not The Time To Be Concerned About Debt”
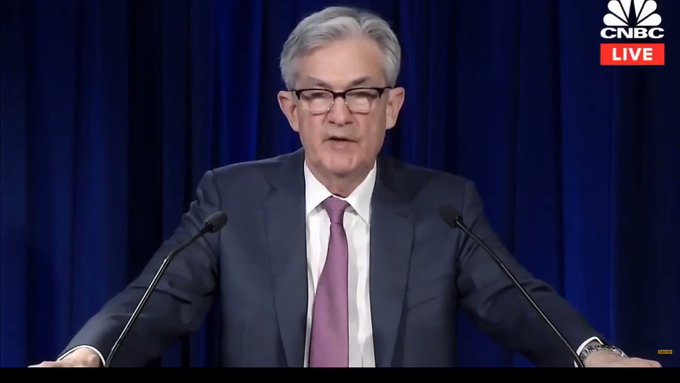
In what was perhaps the most illuminating soundbite from the Powell press conference, in response to a question about the sustainability of the US fiscal trajectory in general, and the soaring debt and deficit in particular – both of which the Fed is now directly monetizing thanks to MMT/Helicopter Money, the Fed Chairman was laconic: “this is not the time” to be concerned about debt.
Jerome Powell, Chair of the Federal Reserve: “The debt is growing faster than the economy. This is not the time to act upon those concerns”
Time for Plan ₿
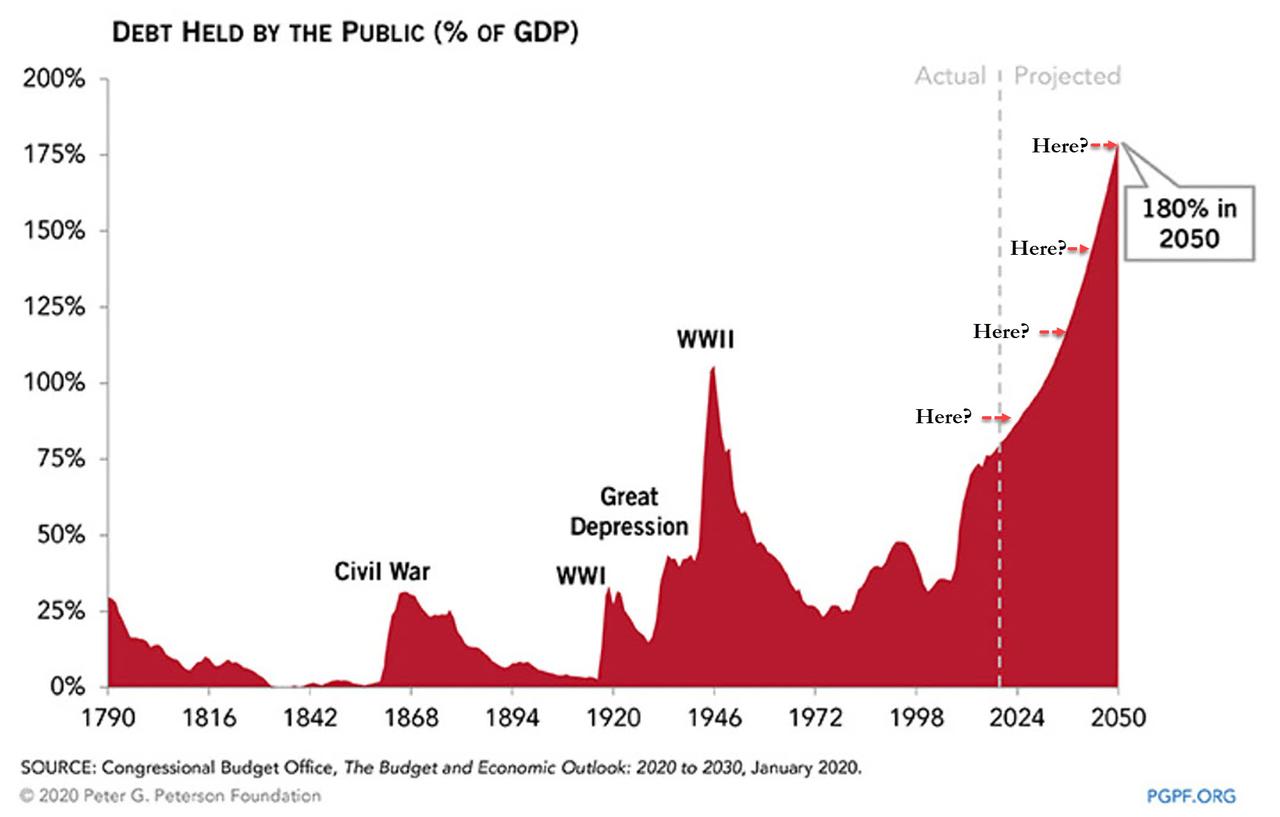
Fair enough, in response we will be just as laconic and use the CBO’s latest long-term debt to GDP forecast to ask the Chairman just when will it be the time to be concerned about the Federal debt. For the benefit of the Fed Chair we have conveniently provided several possible answers.
FIRST SHALE OIL DOMINO TO FALL: More to Follow
FIRST SHALE OIL DOMINO TO FALL: More to Follow
In a stunning news release, Continental Resources, the largest shale producer in the Bakken, is shutting in most of its production in the region. That is one hell of a lot of output to shut-in as Continental Resources was producing over 200,000 barrels per day in the Bakken at the end of 2019.
From the data on Shaleprofile.com, Continental Resources had over 2,200 wells in the North Dakota and Montana Bakken producing oil and gas during February this year. How many wells will Continental’s Harold Hamm shut in the Bakken?? And how many will be brought back online, at to what cost, when the market recovers??
According to Reuters, Continental Resources halts shale output, seeks to cancel sales:
April 23 (Reuters) – The largest oil producer in North Dakota has halted most of its production in the state, notifying some customers it would not supply crude at current pricing, according to people familiar with the matter.
Continental Resources Inc, the company controlled by billionaire Harold Hamm, stopped all drilling and shut in most of its wells in the state’s Bakken shale field, said three people familiar with production in the state. North Dakota is the second-largest oil-producing state in the United States after Texas.
This is terrible news for the U.S. Shale Oil Industry because $200 billion in debt is due over the next four years. How are they going to repay this debt if shale companies stop drilling and shutting in production??
If we look at the top five shale oil producers in the Bakken, Continental Resources was clearly ahead of the pack:

This chart from Shaleprofile.com shows that Continental Resources produced more than 200,000 barrels per day in the Bakken at the end of 2019. Hess, which is the second-ranked company, followed by a wide margin at 145,000 barrels per day. Interestingly, the third-largest producer in the Bakken is Whiting Petroleum that just filed for Bankruptcy on April 1st.
…click on the above link to read the rest of the article…
Rabobank: It Is Understandable Why Some Are Wondering When We Get Hyper-inflation And Currency Collapse
Rabobank: It Is Understandable Why Some Are Wondering When We Get Hyper-inflation And Currency Collapse
With so much liquidity being thrown into so many markets by so many so fast, it is perhaps understandable that some are wondering when we get inflation, hyper-inflation, and/or currency collapse. However, given we are riddled with World War Two analogies at the moment, allow me to do two Churchill impressions: “Never was so much owed by so many to so few” – and “Never was so much owned by so few.” (Yes, one does not need to read Piketty to know that wealth and income inequality under the Pharaohs was even more unfair than it has been trending under every US President since Nixon, but you hopefully get the point.)
In short, global debt levels are at records and rising – which is where some see the inflation coming from; and yet wealth and income inequality are also at staggering levels – and rising as mind-blowing liquidity flows not into many pockets but into relatively few.
For all of the staggering scale of fiscal stimulus packages–20% of GDP in Japan, 15% and rising in the UK, and who even knows in the US?–ask yourself this: is the ordinary working family feeling better or worse off right now? Unemployment is soaring but you are lucky enough to get furloughed with 80% pay – isn’t that a 20% pay cut? And is a pay-rise now waiting for you in 2021? And good luck if you own a small business as most of most of the fiscal packages we see are going out in loan support to larger firms. Yet if you give USD1m to a private firm whose revenue has collapsed by USD1m, is this actually stimulus at all? It leaves you at an expensive stand-still – and also means more debt to carry post virus, dragging growth lower.
…click on the above link to read the rest of the article…
COMING COLLAPSE OF U.S. FINANCIAL PONZI SCHEME: Leading To Exploding Gold & Silver Prices
COMING COLLAPSE OF U.S. FINANCIAL PONZI SCHEME: Leading To Exploding Gold & Silver Prices
Americans are totally unprepared for the coming collapse in the U.S. Financial Ponzi Scheme and Economy. While the highly-leveraged debt-based U.S. financial system and economy were going to implode on their own in due time, the global contagion has sped up the process considerably.
Unfortunately, there is no way that the U.S. economy will ever return back to the level it was at the end of 2019. Furthermore, I believe that the United States reached the ultimate peak of unconventional shale oil production. This is terrible news for the U.S. government policy of “U.S. Energy Independence.” With the oil price trading at $20, and soon to reach the single digits, shale oil companies are being destroyed DAY IN & DAY OUT.
With the destruction of the U.S. Shale Industry now taking place right in front of our eyes, the “LAST HOPE” for continuing business as usual, the Collapse of the U.S. Financial Ponzi Scheme has begun. I discussed the details in my newest video, U.S. Ponzi Scheme Collapse Lead To Exploding Gold & Silver Prices:
In the new video update, I provide colorful charts, including information you can’t find anywhere else on the internet. One of these charts shows how the massive increase in total U.S. debt was the primary factor in driving U.S. GDP to a record of $21.7 trillion in 2019. Early on, the increase in the United States energy consumption paralleled the rise in the country’s GDP and total debt levels. However, this all changed after 1970; when U.S. conventional oil production peaked, followed by Nixon dropping the Gold-Dollar peg.

…click on the above link to read the rest of the article…
Banks Will Not Bail Out The Economy
Banks Will Not Bail Out The Economy
These days, we hear a lot that banks were the problem in the 2008 crisis and now they are the part of the solution.
Banking was not the main problem of the 2008 crisis, but one of the symptoms that indicated a more serious disease, the excess risk taken by public and private economic agents after massive interest rate cuts and direct incentives to take more debt coming from legislation as well as local and supranational regulation. Lehman Brothers was not a cause, it was a consequence of years of legislation and monetary policies that encouraged risk-taking.
The second part of the sentence, “now banks are the solution,” is dangerous. It starts from a wrong premise, that banks are stronger than ever and can bail out the global economy. Banking may be part of the solution, but we cannot place, as the eurozone is doing, the entire burden of the crisis on the banks’ balance sheet. I will explain why.
When economists in Europe talk endlessly about the differences in growth and success of monetary and fiscal policy between the United States and Europe, many ignore two key factors. In the United States, according to the St Louis Federal Reserve, less than 15% of the real economy is financed through the banking channel, in the European Union, it is almost 80%. In addition, in the United States, there is an open, diversified, more efficient and faster mechanism to clean non-performing loans and recapitalize the economy that adds to its high diversification in private non-bank financing channels.
It is, therefore, essential that in periods of crisis countries, particularly in Europe, do not relax risk analysis mechanisms, because the economic recovery may be slowed down by ongoing problems in the financial sector and even lead to a banking crisis in the midterm. The worst measure that countries can take in a crisis is to force incentives to take a disproportionate risk.
…click on the above link to read the rest of the article…
What Happens When The Pandemic Ends?
What Happens When The Pandemic Ends?
Let’s assume that by the end of this year a combination of social distancing and some new and effective treatments convert covid-19 from existential threat to chronic nuisance and the economy starts to assume an air of normalcy. Which is to say that people go back to traveling and eating out and buying Chinese-made things they don’t need with money they don’t have.
Are we really home free? Or will some other, even bigger black swan come in for a landing?
To put this question into context, it helps to look at how the world got here. In extremely brief form: We engineered a tech stock bubble in the 1990s that burst in 2000, requiring drastically lower interest rates and truly insane speculation in housing to rescue the big banks. When that bubble burst in 2008, interest rates had to fall even further and even more debt – ranging from government to student to subprime auto (and, yes, mortgage) — had to be taken on to save Wall Street. Hence the term “everything bubble.”
Then came the pandemic, which burst the everything bubble and has convinced the world’s governments that truly astounding amounts of new debt are required to bail out all the parts of the private sector that have more-or-less ceased to exist.
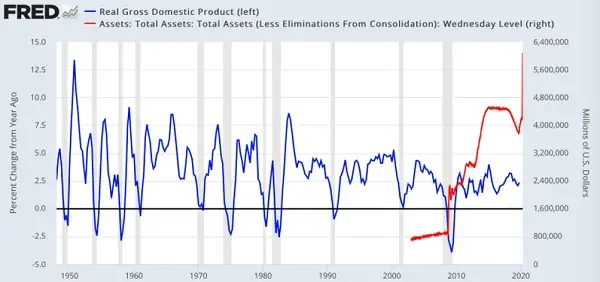
Here, for instance, is the Fed’s balance sheet, which is a proxy for the amount of new currency the central bank has created out of thin air and dumped into the economy. The blue line is GDP growth and the red line is Fed currency creation. Note that more and more currency has to be created to maintain the same anemic growth trend:
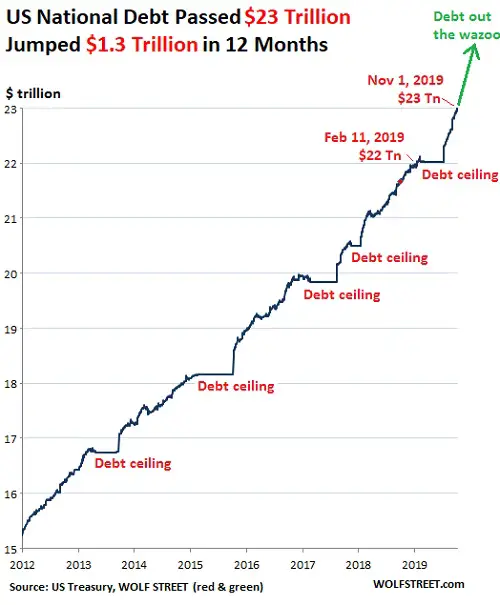
And here’s the federal government’s debt. Note the same situation as with the Fed: ever-greater borrowing is necessary to maintain a diminishing rate of growth.
…click on the above link to read the rest of the article…
#MacroView: Is The “Debt Chasm” Too Big For The Fed To Fill?
#MacroView: Is The “Debt Chasm” Too Big For The Fed To Fill?
Over the last month, the Federal Reserve, and the Government, have unleashed a torrent of liquidity into the U.S. markets to offset a credit crisis of historic proportions. Here is a list of programs already implemented which have already surpassed all programs during the “Financial Crisis.”
- March 6th – $8.3 billion “emergency spending” package.
- March 12th – Federal Reserve supplies $1.5 trillion in liquidity.
- March 13th – President Trump pledges to reprieve student loan interest payments
- March 13th – President Trump declares a “National Emergency” freeing up $50 billion in funds.
- March 15th – Federal Reserve cuts rates to zero and launches $700 billion in “Q.E.”
- March 17th – Fed launches the Primary Dealer Credit Facility to buy corporate bonds.
- March 18th – Fed creates the Money Market Mutual Fund Liquidity Facility
- March 18th – President Trump signs “coronavirus” relief plan to expand paid leave ($100 billion)
- March 20th – President Trump invokes the Defense Production Act.
- March 23rd – Fed pledges “Unlimited QE” of Treasury, Mortgage, and Corporate Bonds.
- March 23rd – Fed launches two Corporate Credit Facilities:
- A Primary Market Facility (Issuance of new 4-year bonds for businesses.)
- A Secondary Market Facility (Purchase of corporate bonds and corporate bond ETF’s)
- March 23rd – Fed launches the Term Asset-Backed Security Loan Facility (Small Business Loans)
- April 9th – Fed launches several new programs:
- The Paycheck Protection Program Loan Facility (Purchase of $350 billion in SBA Loans)
- A Main Street Business Lending Program ($600 billion in additional Small Business Loans)
- The Municipal Liquidity Facility (Purchase of $500 billion in Municipal Bonds.)
- Expands funding for PMCCF, SMCCF and TALF up to $850 billion.
Here is the Fed’s balance sheet through this past Wednesday (estimated at time of writing)

It is currently expected that over the course of the next several quarters, the Fed’s balance sheet will grow to $10 Trillion in total. Such would be a $6 Trillion expansion from the previous levels.
…click on the above link to read the rest of the article…
The Liquidity Crisis Is Quickly Becoming A Global Solvency Crisis As FRA/OIS, Euribor Soar
The Liquidity Crisis Is Quickly Becoming A Global Solvency Crisis As FRA/OIS, Euribor Soar
One month after turmoil was unleashed on capital markets, when the combination of the Saudi oil price war and the sweeping impact of the coronavirus pandemic finally hit developed nations, what was until now mostly a liquidity crisis is starting to become a solvency crisis as more companies realize they will lack the cash flow to sustain operations and fund debt obligations.
As Bloomberg’s Laura Cooper writes, cash-strapped companies are finding little relief from stimulus measures, and from Europe to the US, cash in hand has been hard to come by even as governments pledge funds for small businesses to bridge the financial gap until lockdowns are lifted:
- US: The March NFIB survey of U.S. small businesses noted challenges in submitting loan applications and the urgent need for federal assistance
- UK: A British Chamber of Commerce survey showed only 1% of companies reported being able to access funds dedicated for business. A complex application process for the U.K. Coronavirus Business Interruption Loan Scheme comes as 6% of U.K. firms say they have run out of cash while nearly two-thirds have funding for less than three months
- Canada: A proposed six-week roll out of emergency funds is unlikely to prevent 1 in 3 companies from laying off workers. More than 10% of the labor force has already filedemployment claims
- Europe: existing structures are aiding in the deployment of funds, but concerns remain that more is needed with EU leaders failing to reach agreement on further initiatives
As we have noted previously, small businesses – everywhere from China, to Europe, to the US – make up the majority of firms in advanced economies and account for a sizeable share of private sector employment. Quick delivery of stimulus measures is needed to curb widespread insolvencies. This could mean the difference between a short, yet sharp recession and a prolonged erosion to the labor market and economy regardless of containment of the health crisis.
…click on the above link to read the rest of the article…
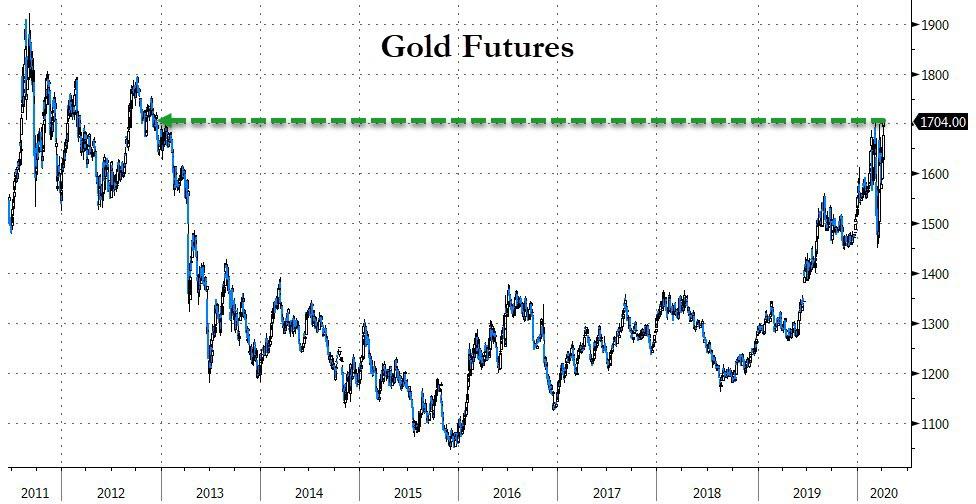
Gold Futures Extend Gains To 8 Year Highs After Pelosi’s Trillion-Dollar Promise
Gold Futures Extend Gains To 8 Year Highs After Pelosi’s Trillion-Dollar Promise
COVID-19 appears to have impacted the deep fiscally-conservative regions of the brains of politicians more than many suspected possible as left, right, and center seem to be coalescing around the fact that moar spending is better, moar helicopter money is even better-er, and moar zeros in the national debt is better-est!

Live look at Dow futures

Tonight’s latest utterance/demands from Speaker Pelosi – that the next, fourth, round of virus-relief stimulus must be at least $1 trillion – appears to have confirmed one thing (as @hkuppy notes so pointedly):
” Glad to see both parties supporting gold $10k…”
And sure enough, gold is soaring after hours following this headline…
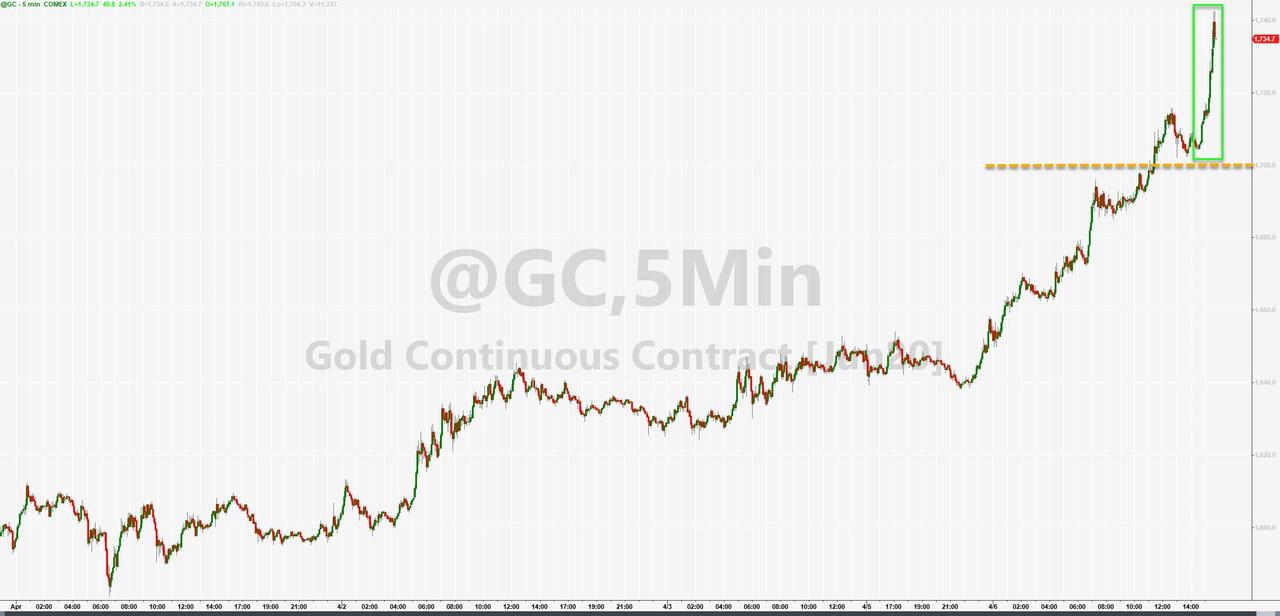
Back to Dec 2012 highs…
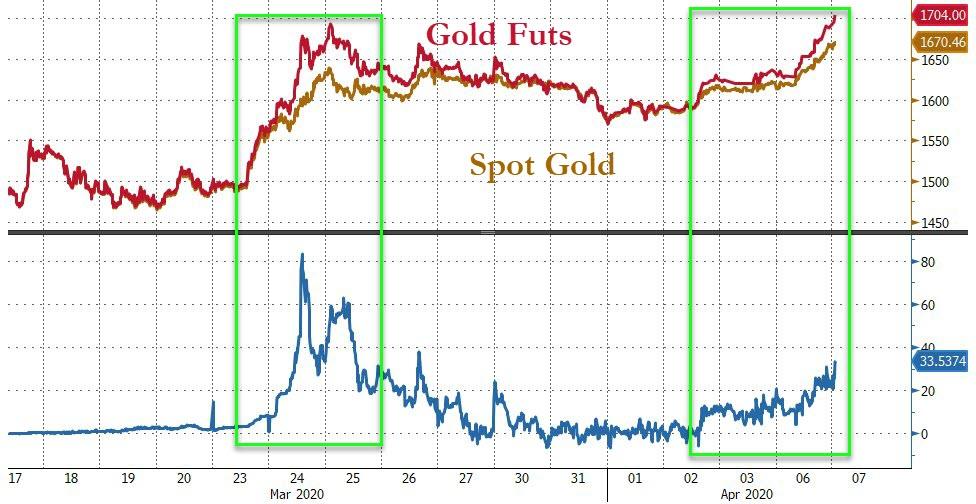
And once again futures are decoupling from spot as that physical (geographical) shortage rears its ugly head once again…
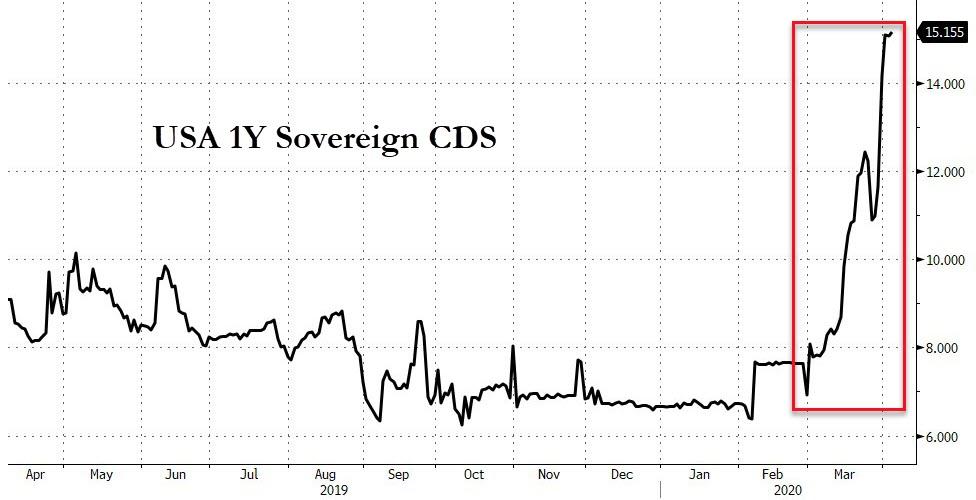
One thing is for sure, not only is gold signaling systemic risk is soaring, sovereign credit markets are starting to leak information…
Referring to his institutional market research at Global Macro Investor, we give the last word to Raoul Pal and his most recent thoughts (excerpted) on “A Dollar Standard Crisis” are
….
Don’t forget – the $13tn short dollar positions (foreign dollar debt held mainly by foreign corporation and investment vehicles) is the largest position ever taken in the history of global financial markets.
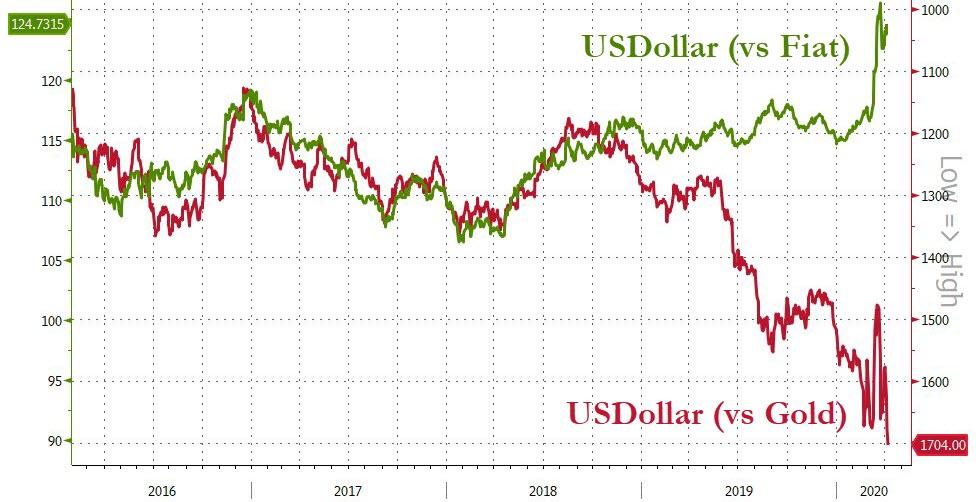
It can only mean a massive, uncontrolled dollar rally.
QE will not fix this. Swap lines will not fix this. A debt jubilee would fix this or multiple trillions of dollars in write-downs and defaults.
It is the dollar strength that brings to world to its nadir (just like the 1930s). It is the dollar system that is the really big problem.
The dollar has eaten all of its competitors and now it is going to eat itself.
…click on the above link to read the rest of the article…
When It’s Over, Will We Be the Same America?

When It’s Over, Will We Be the Same America?
If March shocked this nation as severely as 9/11, what is coming may be even more sobering.
“Depend upon it, sir, when a man knows he is to be hanged in a fortnight, it concentrates his mind wonderfully,” said Samuel Johnson.
And as it is with men, so it is with nations.
Monday, Dr. Deborah Birx, White House coronavirus response coordinator, projected some 100,000 to 200,000 U.S. deaths from the pandemic, “if we do things almost perfectly.” She agreed with Dr. Anthony Fauci’s estimate that, if we do “nothing,” the American dead could reach 2.2 million.
That 2 million figure would be twice as many dead as have perished in all our wars from the American Revolution to the Civil War, World War I and II, and Korea and Vietnam.
This does indeed concentrate the mind wonderfully.
Now add to this slaughter of our countrymen a market plunge steeper than the 1929 Crash and a 1930s-style Depression. Wall Street analysts are talking of a wipeout of 30% of our GDP and unemployment reaching 35%.
What a difference a month can make.
On March 3, Super Tuesday, we were caught up in the 14 primary contests after Joe Biden’s stunning victory in South Carolina, which broke the momentum of Sen. Bernie Sanders’ wins in Iowa, New Hampshire and Nevada.
What March 2020 produced and what it appears to portend is a sea change in U.S. history, an inflection point, an event after which things never return to what they were.
The coronavirus crisis seems to be one of those epochal events that alter the character of the country and the course of the republic.
Consider what has happened in three weeks.
The Republican Party, the party of small government and balanced budgets, approved with but a single dissent a $2 trillion emergency bill. There is talk now of a second $2 trillion bill, this one for infrastructure.
…click on the above link to read the rest of the article…


