Home » Posts tagged 'gdp' (Page 13)

Tag Archives: gdp

Olduvai
Click on image to purchase

Olduvai III: Catacylsm
Click on image to purchase

Post categories

Post Archives by Category

We’ve Reached the “Zero Point” of Debt Creation

We’ve Reached the “Zero Point” of Debt Creation

Hurtling toward a massive financial crisis.

Forty-five years and counting: We’ve been on a debt spree since the early 1970s when we went off the gold standard, covering every possible angle. Trade deficits, government deficits, unfunded entitlements, private debt – you name it! Our total debt has grown 2.5-times GDP since 1971.

How could economists not see this as a problem? How is this the least bit sustainable?

It isn’t. We’re hurtling toward a massive financial crisis, and all we have to show for it are financial asset bubbles destined to burst. And when they do, they’ll wipe out the artificial wealth they’ve created for many decades… in just a few years, as they did from late 1929 into late 1932!

The chart below shows the common-sense truth.

As with any drug – and debt is a financially enhancing drug – it takes more and more to create less and less of an effect. Eventually, you reach the “zero point” where there is no effect and the drug kills you from its very strain and toxicity.

We’re rapidly approaching that zero point, after every dollar of debt has produced less and less GDP steadily since 1966:

2016-08-31-return-on-debt

Note that the anomaly in the chart after 2008 was due to the impact of unprecedented QE. Ever since that disruption, the trends have pointed back down – making a beeline toward that zero point again.

Back in 2002, Swiss investor and market prognosticator Marc Faber published a similar chart. His findings showed the zero point for debt creation would occur around 2015. With updated data, we now see that the zero point will hit around the beginning of 2017.

…click on the above link to read the rest of the article…

Canadian Economy ‘Double-Dip’ Crashes In Q2 – Worst GDP Growth In 7 Years

Canadian Economy ‘Double-Dip’ Crashes In Q2 – Worst GDP Growth In 7 Years

The first half of 2015 saw Canada informally enter ‘recession’ with two quarters of negative GDP but then, everything bounced back and policy shifts were ‘proven’ effective. However, that dead-canadian-cat-bounce is over as Q2 2016 GDP growth just slumped 1.6% – double-dipping to the worst since Q2 2009. The problem with this plunge is that oil prices actually had their best quarter in 7 years as the economy tanked.

As Bloomberg reports, Canada’s economy suffered its biggest contraction since the 2009 recession as wildfires in Alberta crimped oil production.

Gross domestic product fell at a 1.6 percent annualized pace in the second quarter, Statistics Canada said Wednesday in Ottawa. Economists expected a 1.5 percent decline, according to the median estimate of a Bloomberg survey with 24 responses.

Exports of goods and services plunged at a 16.7 percent annualized pace, and Statistics Canada said that excluding the damage from the wildfires output edged up. Nevertheless, export declines ranged beyond the oil industry: automobiles and metals both fell while shipments of consumer goods posted the largest drop since 2003.

Wednesday’s figures showed a good handoff to the third quarter, with monthly output rising 0.6 percent for June, faster than the 0.4 percent that economists predicted. It was the fastest gain since July 2013 and reversed a similar decline for May.

The quarterly figures signaled the main forces in the economy this year are still at work: weak business investment and strong consumer spending. Business gross fixed capital formation fell 0.5 percent, the sixth straight decline, while consumer spending rose 2.2 percent.

Government spending also bolstered the economy with a 4.2 percent increase, with some of it linked to Alberta relief efforts.

So Q2 was a disaster but Q3 hope is strong.

…click on the above link to read the rest of the article…

Who Or What Will Push Italy Over The Cliff This Year?

Who Or What Will Push Italy Over The Cliff This Year?

Prime Minister Renzi Italy

Traditionally, the Eurozone’s GDP numbers of the second quarter of a calendar year are being released in the first few days of August, and this year isn’t any different. And as expected, the updated report contains some not-so-very-optimistic results.

Germany continues to be the main engine of the economy of the Eurozone, as the largest country of the bloc saw its GDP increase by 0.4%which is better than expected as the market was expecting a weaker growth result. Unfortunately Italy is once again stagnating and instead of a small economic growth of 0.2%, the economy’s growth rate fell flat and remained at exactly at the same level, indicating the program of monetary expansion of the ECB isn’t working just yet.

Italy GDP Industrial Production

Source: Bloomberg

The lower growth rate (after realizing a GDP increase of 0.3% in the previous quarter) also caused both the International Monetary Fund and the Bank of Italy to revise their growth expectations as both institutions now expect the country’s economy to grow by less than 1% in the current year. That’s a very disappointing result as the quantitative easing program of the European Central Bank was predominantly aimed at reducing the impact of economic contractions in the poorer performing countries. But the situation might actually be even worse than you’d expect.

After all, Italy could be considered to be a semi-failed state, and the current prime minister, Matteo Renzi, was planning to push some reforms through after the summer recess of the country’s parliament. Reforms will definitely be necessary to try to the Italian economy going again, as it’s one of the very few countries remaining short of the pre-crisis levels of the GDP considering Italy’s GDP is still approximately 8% lower compared to the pre-crisis GDP numbers whilst the unemployment numbers are increasing again.

…click on the above link to read the rest of the article…

Guided By Nonsense

Guided By Nonsense

“Read the directions and directly you will be directed in the right direction.” — Lewis Carroll

U.S. consumers are at it again.  After a seven year hiatus they’re once again doing what they do best.  They’re buying stuff.

According to the Commerce Department, personal consumption expenditures (PCE), which is the primary measure of consumer spending on goods and services in the U.S. economy, increased $119.2 billion in April.  That marks an increase of 1 percent, and is the biggest one month increase since August 2009…nearly seven years ago.  Indeed, this is quite an achievement.

The consumer, you know, is the primary engine of U.S. economic growth.  Without consumption GDP doesn’t go up; rather, it goes down.  Moreover, in a debt based money system, when GDP goes down the whole financial debt structure breaks down.

We don’t condone it.  Certainly we’d prefer an honest hard money system where savings and investment drives growth as opposed to borrowing and spending.  But our preference has no bearing on reality in this matter.

Still, given the vast array of pretense inherent to a debt based money system, when we hear that PCEs increased by the largest margin in nearly seven years, we take a keen interest.  Naturally, we want to know what’s going on.  Namely, we ask, where’s the money coming from?

Where’s the Money Coming From?

Middle class incomes, the last we recall, scored a big fat rotten goose egg over the last decade.  By this we mean incomes haven’t gone up.  To the contrary, they’ve going down.

Our understanding of this unfortunate situation isn’t based on anecdotes we overheard at the corner donut shop.  Nor is it based on experiences shared by the crusty fellows casting their lines off Belmont Veterans Memorial Pier.  Instead, we have hard evidence and solid proof.  Specifically, we point to the distilled findings of Pew Research released earlier this month.

…click on the above link to read the rest of the article…

The Source of Failure: We Optimize What We Measure

The Source of Failure: We Optimize What We Measure

Rather than measure consumption and metrics that incentivize debt, what if we measure well-being and opportunities offered in our communities?

The problems we face cannot be fixed with policy tweaks and minor reforms.Yet policy tweaks and minor reforms are all we can manage when the pie is shrinking and every vested interest is fighting to maintain their share of the pie.

Our failure stems from a much deeper problem: we optimize what we measure. If we measure the wrong things, and focus on measuring process rather than outcome, we end up with precisely what we have now: a set of perverse incentives that encourage self-destructive behaviors and policies.

The process of selecting which data is measured and recorded carries implicit assumptions with far-reaching consequences. If we measure “growth” in terms of GDP but not well-being, we lock in perverse incentives to boost ‘growth” even at the cost of what really matters, i.e. well-being.

If we reward management with stock options, management has a perverse incentive to borrow money for stock buy-backs that push the share price higher, even if doing so is detrimental to the long-term health of the company.

Humans naturally optimize what is being measured and identified as important.

If students’ grades are based on attendance, attendance will be high. If doctors are told cholesterol levels are critical and the threshold of increased risk is 200, they will strive to lower their patients’ cholesterol level below 200.

If we accept that growth as measured by gross domestic product (GDP) is the measure of prosperity, politicians will pursue the goal of GDP expansion.

If rising consumption is the key component of GDP, we will be encouraged to go buy a new truck when the economy weakens, whether we need a new truck or not.

…click on the above link to read the rest of the article…

Russia Frets about Risk of “Recession” in China

Russia Frets about Risk of “Recession” in China

What do they see that we don’t?

Russia’s economy has been shrinking five quarters in a row, though in the first quarter of 2016, it contracted at an annual rate of “only” 1.2%, after having contracted 3.7% in 2015, the longest recession in two decades. The budget deficit has swollen to 8.6% of GDP in April – way beyond the 3% the government is projecting for the year. It might require additional and unpopular budget cuts.

So the jump in oil prices recently, while not nearly enough, is a huge economic relief for the world’s largest oil & gas exporter.

The surge in oil prices has boosted the ruble, which had plunged late last year and early January. Now it’s back at 69 rubles to the dollar, where it had been in November, and there’s a sense that a currency crisis has been averted.

Putin’s pivot to the east with his energy policy has led to mega-contracts and projects with China, largely to supply oil and gas to the energy-hungry nation. Already, exports of crude oil to China soared 28% in 2015, which elevated Russia to China’s second largest supplier, behind only Saudi Arabia. China has become Russia’s biggest trade partner, accounting for 12.8% of Russia’s total trade.

The ties are also growing in the financial realm. Russian oil and gas companies have bought yuan-denominated bonds last year. And in 2014, the Central Bank of Russia signed a 150-billion-yuan ($23 billion) swap agreement with People’s Bank of China to allow both countries to directly settle their trade in rubles and yuan, without having to resort to the dollar.

So Russia is increasingly joined at the hip to China, and will be even more so as the new projects mature. But now Russia is fretting about the slowdown in China and a further devaluation of the yuan.

These worries percolated to the top on Wednesday at a Credit Suisse conference on emerging markets in Moscow.

…click on the above link to read the rest of the article…

Japan’s “Coma Economy” Is A Preview For The World

Japan’s “Coma Economy” Is A Preview For The World

The 1980s were the apex of Japanese culture and economic might. Back then, Japan’s economy was growing so fast, it was thought they would overtake the US. But that all came to a screeching halt. Truth is, Japan’s meteoric rise was fueled by an epic lending bubble. Similar to the Roaring 20s in America.

And when the bubble popped, the government launched massive and misguided measures that set Japan back decades. Their economy hasn’t expanded since. They are stuck in the 1980s. There’s been no growth for 30 years. And as Mike Maloney and Harry Dent explain, the United States could be going down the same path…

“For more than 20 years now, Japan has proved that Keynesian economics does not work… they’ve tried to print their way to prosperity… and failed…they didn’t let the reset happen…”


See more here…

No Wonder We’re Poorer: Wages’ Share of GDP Has Fallen for 46 Years

No Wonder We’re Poorer: Wages’ Share of GDP Has Fallen for 46 Years 

The problem is that limiting financialization will implode the system.

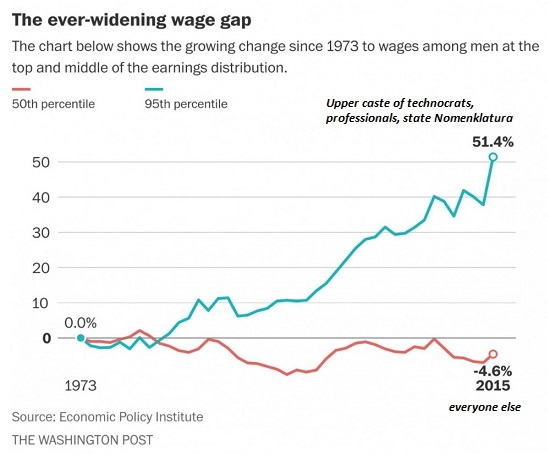
The majority of American households feel poorer because they are poorer. Real (i.e. adjusted for inflation) median household income has declined for decades, and income gains are concentrated in the top 5%:

Even more devastating, wages’ share of GDP has been declining (with brief interruptions during asset bubbles) for 46 years. That means that as gross domestic product (GDP) has expanded, the gains have flowed to corporate and owners’ profits and to the state, which is delighted to collect higher taxes at every level of government, from property taxes to income taxes.

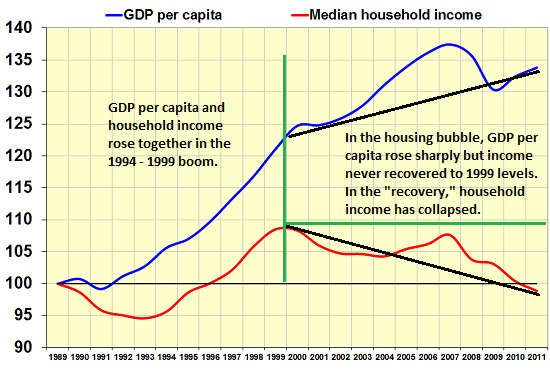
Here’s a look at GDP per capita (per person) and median household income.Typically, if GDP per capita is rising, some of that flows to household incomes. In the 1990s boom, both GDP per capita and household income rose together.

Since then, GDP per capita has marched higher while household income has declined. Household income saw a slight rise in the housing bubble, but has since collapsed in the “recovery” since 2009.

These are non-trivial trends. What these charts show is the share of the GDP going to wages/salaries is in a long-term decline: gains in GDP are flowing not to wage-earners but to shareholders and owners, and through their higher taxes, to the government.

The top 5% of wage earners has garnered virtually all the gains in income.

The sums are non-trivial as well. America’s GDP in 2015 was about $18 trillion. Wages’ share–about 42.5%–is $7.65 trillion.

If wage’s share was 50%, as it was in the early 1970s, its share would be $9 trillion.That’s $1.35 trillion more that would be flowing to wage earners.

That works out to $13,500 per household for 100 million households.

…click on the above link to read the rest of the article…

The Global Growth Funk

The Global Growth Funk

NEW YORK – The International Monetary Fund and others have recently revised downward their forecasts for global growth – yet again. Little wonder: The world economy has few bright spots – and many that are dimming rapidly.

Among advanced economies, the United States has just experienced two quarters of growth averaging 1%. Further monetary easing has boosted a cyclical recovery in the eurozone, though potential growth in most countries remains well below 1%. In Japan, “Abenomics” is running out of steam, with the economy slowing since mid-2015 and now close to recession. In the United Kingdom, uncertainty surrounding the June referendum on continued European Union membership is leading firms to keep hiring and capital spending on hold. And other advanced economies – such as Canada, Australia, Norway – face headwinds from low commodity prices.

Things are not much better in most emerging economies. Among the five BRICS countries, two (Brazil and Russia) are in recession, one (South Africa) is barely growing, another (China) is experiencing a sharp structural slowdown, and India is doing well only because – in the words of its central bank governor, Raghuram Rajan – in the kingdom of the blind, the one-eyed man is king. Many other emerging markets have slowed since 2013 as well, owing to weak external conditions, economic fragility (stemming from loose monetary, fiscal, and credit policies in the good years), and, often, a move away from market-oriented reforms and toward variants of state capitalism.

Worse, potential growth has also fallen in both advanced and emerging economies. For starters, high levels of private and public debt are constraining spending – especially growth-enhancing capital spending, which fell (as a share of GDP) after the global financial crisis and has not recovered to pre-crisis levels.

…click on the above link to read the rest of the article…
What Comes Next——Krugman’s Fiscal Equivalent Of War

What Comes Next——Krugman’s Fiscal Equivalent Of War

Somebody must have reinstated Paul Krugman’s passport. He was recently back in Japan to meet with the world’s leading economy-wrecking triumvirate —-Prime Minister Abe, BOJ Governor Kuroda and Finance Minister Taro Aso—–to dispense some desperately needed advice.

Japan is on the verge of a second recession during Abe’s tenure despite his plunge into full frontal Keynesian stimulus.  But since March 2013 when Kuroda cranked up the BOJ’s printing press to white heat, two main things have happened. The BOJ’s already bloated balance sheet has exploded by 2X and the flat-lining Japanese economy has continued undulating to nowhere.

Japan Central Bank Balance Sheet

Japan GDP Constant Prices

Professor Krugman was naturally at the ready with a solution. He recommended his hosts take a lesson from the America’s World War II playbook and declare “the fiscal equivalent of war”.

Well, the US actually didn’t borrow its way out of the Great Depression; it saved its way out. As I documented in The Great Deformation, total public and private debt at the end of 1938 amounted to 210% of GDP, but by the end of 1945 it had dropped to 190% of GDP.

That’s right. The hoary Keynesian mantra about the fiscal stick save of WWII is a complete myth.

What happened is that the US economy was entirely regimented for war mobilization.There were few consumer goods on the shelves and business had no need to borrow for working capital or equipment because financing was supplied by Uncle Sam. So private sector savings soared to nearly 20% of GDP and combined household and business debt dropped from 150% of GDP on the eve of war to 60% by the end.

…click on the above link to read the rest of the article…

The U.S. Economy Officially Joins The Global Economic Slowdown – 1st Quarter GDP Comes In At 0.5%

The U.S. Economy Officially Joins The Global Economic Slowdown – 1st Quarter GDP Comes In At 0.5%

Slow Down - Public DomainEven the government is admitting that the U.S. economy is slowing down.  On Thursday, we learned that U.S. GDP grew at just a 0.5 percent annual rate during the first quarter of 2016.  This was lower than analysts were anticipating, and it marks the third time in a row that the GDP number has declined compared to the previous quarter.  In other words, GDP growth has been declining for close to a year now, and this lines up perfectly with what I have been saying about how the second half of last year was a turning point that plunged us into the early chapters of a brand new economic crisis.  And as you will see below, the official GDP number is highly manipulated, and the way that it is calculated has been changed numerous times over the years.  So the bad number that is being reported by the government is actually the best case scenario.

Of course many of the “experts” being quoted by the mainstream media are saying that this is just a temporary blip and that good times for the U.S. economy are right around the corner.  For instance, check out this quote from Reuters

“The economy essentially stalled in the first quarter, but that doesn’t mean it is faltering,” said Joel Naroff, chief economist at Naroff Economic Advisors in Holland, Pennsylvania. “Some of the restraints to growth are dissipating. Growth is likely to accelerate going forward.” 

We have been told this same story for years, but the “acceleration” has never materialized.  In fact, Barack Obama is poised to become the only president in U.S. history to never have a single year when the economy grew by more than 3 percent during his presidency.

…click on the above link to read the rest of the article…
Eugen Bohm Von Bawerk: Chinese Dragon: Breathing Credit Fumes

Economic forecasting, no matter how complex the underlying model may be, is essentially about extrapolating historical trends. We showed last week how economic models completely fail to pick up on structural shifts using Japan as an example. On the other hand, if an economy doesn’t really change much, as in the case of Australia over the last thirty years, model “forecast” are generally quite accurate. However, spending millions of dollars to do the job of a ruler doesn’t seem like wise resource allocation to us. That said there’s obviously a very limited market for model based GDP forecast and most of them are not exchanged among pure market based players, but rather between governmental funded agencies. True, Wall Street spews out their sell-side GDP propaganda on a regular basis, but claiming international banking is anything akin to a free market is absurd. GDP forecasting is something only wasteful organizations do and that should tell you all you need to know about these exercises in futility. IMF Forecast for Australia since 1990

Take the latest IMF forecast for China as a half decent example. According to the IMF, the credit junkie known as China, which needed one trillion dollar in fresh credit in the first quarter alone to create GDP “growth” of somewhere between 6.3 and 6.7 per cent (265 billion dollars for the quarter) will continue to race ahead with six per cent growth for the foreseeable future. The Chinese economy is 100 per cent dependent on ever more money and credit expansion to maintain its completely unsustainable momentum and will very soon come crashing down. And by the way, China’s reported GDP numbers are obviously grossly overstated anyway. China GDP growth Q1 2016China TSF Q12016

…click on the above link to read the rest of the article…

With Impeccable Timing, ‘Economic Miracle’ in Spain Unravels

With Impeccable Timing, ‘Economic Miracle’ in Spain Unravels

The European Union on the verge.

Since the granddaddy of all housing bubbles popped in Spain between 2008 and 2009, unleashing one of the deepest recessions in living memory, the nation’s public debt has more than doubled, from just over 40% of GDP to almost exactly 100% today. Last year, despite the fact that Spain grew faster than almost any other European economy, the government managed to rack up a deficit of 5.2%, one full percentage point above the target that it had set itself a year earlier and over three percentage points above the Eurozone average.

It’s the third-highest deficit-to-GDP ratio in the Eurozone after Greece and Portugal. That’s some claim for Europe’s supposed economic success story.

This is the eighth consecutive year that Spain has overshot its fiscal target. Originally, the Spanish government was supposed to get its deficit back below the EU’s sacred limit of 3% of GDP by 2013. When it became clear during the darkest days of the crisis that it would be impossible, the deadline was extended by a year. A year later, Madrid had made so little progress that it got a further two-year extension, to 2016.

But still there’s no sign of progress. None of which should come as a surprise. As WOLF STREET warned in October, it was plain as day that the Spanish government would fail to rein in its spending during the run-up to a tightly fought general election. Brussels was completely aware of this fact and did nothing to address it, for obvious reasons: political expedience.

Brussels along with Spain’s big banks, corporate giants, and the Troika wanted the conservative Rajoy government to win December’s do-or-die general elections. They’d do “whatever it takes” to keep the narrative intact that the Spanish economy has never been better.

…click on the above link to read the rest of the article…

What is it like to live in a steady state economy? Miss Hokusai in Edo Japan

What is it like to live in a steady state economy? Miss Hokusai in Edo Japan

Miss Hokusai” is a delicate and beautiful movie set during the late Edo period in Japan. It may give us a feeling of what it is like to live in a steady-state economy. In the picture from the movie, you can see O-Ei (Miss Hokusai) together with her father, the painter Tetsuzo, better known by his pen name of Hokusai.

We owe to Kennet Boulding the concept that “Anyone who believes exponential growth can go on forever in a finite world is either a madman or an economist.” And we call the end of this impossible growth a condition of “no growth”, “zero growth” or “stable state.” Many people argue that such a condition is not only necessary because of physical reasons, but it is also a good condition to be in.

In practice, we don’t know what a true “zero-growth” society could be, simply because it has never existed in the modern Western World. The only hint we can find on how such a society could be is from history. Probably the best example of such a society, close in time and very well known, is Japan during the Edo Period, that historians place between 1603 and 1868.

We have no data about Edo Japan that we could compare to our modern concept of “Gross Domestic Product,” which is at the basis of our idea of “economic growth”. However, we have good data about the population of that time and there is no doubt that it remained nearly stable during the whole period. We also know that the extent of cultivated land in Japan didn’t vary over almost one century and a half, from 1720 to 1874 (source).
…click on the above link to read the rest of the article…

Why is the MSM Covering Up Recessionary Data?

WHY IS THE MSM COVERING UP RECESSIONARY DATA?

The Census Bureau put out their monthly retail sales report this morning. During good times, the MSM would be hailing the tremendous increases as proof the consumer was flush with cash and all was well with the economy. Considering 70% of our GDP is dependent upon consumer spending, you would think this data point would be pretty important in judging how well Americans are really doing.

It’s not perfect, because the issuance of debt to consumers to purchase autos, furniture, appliances and electronics can juice the retail sales numbers and create the false impression of strength. That’s what has been going on with auto sales for the last two years.

The retail sales figures have been propped up by the issuance of subprime auto loans to deadbeats, 7 year 0% interest loans to good credit customers, and an all-time high in leases (aka 3 year rentals). Despite this Fed induced auto loan scheme, retail sales have still been pitiful, as the average American has been left with stagnant wages, 0% interest on their minuscule savings, surging rent and home prices, and drastic increases in their healthcare costs due to Obamacare.

The retail sales for March, reported this morning, were disastrous and further confirmed a myriad of other economic indicators that the country is in recession. GDP for the first quarter will be negative. And this time they can’t blame it on snow in the winter. They have already doubly seasonally adjusted the figures, and they will still be negative. Retail sales in the first quarter were atrocious. It might make a critical thinking person question the establishment storyline of solid job growth being peddled by politicians and their MSM mouthpieces. If people had good paying jobs, they would be spending money.

…click on the above link to read the rest of the article…

Olduvai IV: Courage
Click on image to read excerpts

Olduvai II: Exodus
Click on image to purchase

Click on image to purchase @ FriesenPress