Home » Posts tagged 'gdp' (Page 11)

Tag Archives: gdp

Olduvai
Click on image to purchase

Olduvai III: Catacylsm
Click on image to purchase

Post categories

Post Archives by Category

Productivity and Debt


William Blake Europe Supported by Africa and America 1796
 

Earlier this week I was struck by the similarities and differences between two graphs I saw float by. And the thought occurred that they are as scary as they are interesting. The graphs show eerily similar trends. And complement each other. The first graph, which Tyler Durden posted, shows productivity, defined as more or less the same as GDP per capita. It goes all the way back to 1790 and contends that 2017 productivity is about back to the level it was at in 1790. In the article, Tyler suggests a link with the amount of time people spend on Instagram et al, but perhaps there is something more going on.

That is, America and Western Europe exported almost their entire manufacturing capacity to China etc. And how can you be productive if you don’t manufacture anything? Yeah, I know, ‘knowledge economy’ and ‘service economy’ and all that, but does anyone still really believe those terms? Sure, that may have worked for a while as others were still actually making stuff (and nobody really understood the idea anyway), but it’s a sliding scale. As productivity plunged, so did GDP per capita. We can all wrap our heads around that.

America’s Productivity Plunge Explained

For the first time since the financial crisis, US multifactor productivity growth turned negative last year, mystifying economists who have struggled to find something to blame for the fact that worker productivity is declining despite a technology boom that should make them more efficient – at least in theory. To be sure, economists have struggled to find explanations for the exasperating trend, with some arguing that the US hasn’t figured out how to properly measure productivity growth correctly now that service-sector jobs proliferate while manufacturing shrinks. But what if there’s a more straightforward explanation? What if the decline in US productivity measured since the 1970s isn’t happening in spite of technology, but because of it?

…click on the above link to read the rest of the article…

The Looming Energy Shock

Carlos E. Santa Maria/Shutterstock

The Looming Energy Shock

The next oil crisis will arrive in 3 years or less
There will be an extremely painful oil supply shortfall sometime between 2018 and 2020. It will be highly disruptive to our over-leveraged global financial system, given how saddled it is with record debts and unfunded IOUs.

Due to a massive reduction in capital spending in the global oil business over 2014-2016 and continuing into 2017, the world will soon find less oil coming out of the ground beginning somewhere between 2018-2020.

Because oil is the lifeblood of today’s economy, if there’s less oil to go around, price shocks are inevitable. It’s very likely we’ll see prices climb back over $100 per barrel. Possibly well over.

The only way to avoid such a supply driven price-shock is if the world economy collapses first, dragging demand downwards.

Not exactly a great “solution” to hope for.

Pick Your Poison

This is why our view is that either

  1. the world economy outgrows available oil somewhere in the 2018 – 2020 timeframe, or
  2. the world economy collapses first, thus pushing off an oil price shock by a few years (or longer, given the severity of the collapse)

If (1) happens, the resulting oil price spike will kneecap a world economy already weighted down by the highest levels of debt ever recorded, currently totaling some 327% of GDP:

(Source)

Remember, in 2008, oil spiked to $147 a barrel. The rest is history — a massive credit crisis ensued.  While there was a mountain of dodgy debt centered around subprime loans in the US, what brought Greece to its knees wasn’t US housing debt, but its own unsustainable pile of debt coupled to a 100% dependence on imported oil —  which, figuratively and literally, broke the bank.

…click on the above link to read the rest of the article…

Why The Markets Are Overdue For A Gigantic Bust

r.classen/Shutterstock

Why The Markets Are Overdue For A Gigantic Bust

It’s just not possible to print our way to prosperity
Let me begin with a caveat: confirmation bias is an ever-present risk for an analyst such as myself.

If you’re not familiar with the term, ‘confirmation bias’ suggests that once we’ve invested time and emotional energy into developing a worldview, we’ll then seek information to confirm that view.

After writing about the economy for so many years, I’m now so convinced that we can’t print our way to prosperity that I find myself seeing signs confirming this view everywhere, every single day. So that’s the danger to be aware of when listening to me.  I’m going to keep repeating this mantra and Im going to keep finding data that supports this view.

Based on lots of historical inputs, I have concluded that Printing money out of thin air can engineer lots of things, including asset price bubbles and the redistribution of wealth from the masses to the elites.  But it cannot print up real prosperity.

As much as I try, I simply cannot jump on the bandwagon that says that printing up money out of thin air has any long-term utility for an economy. It’s just too clear to me that doing so presents plenty of dangers, due to what we might call ‘economic gravity’: What goes up, must also come down.

Which brings us to this chart:

The 200 bubble blown by Greenspan was bad, the next one by Bernanke was horrible, but this one by Yellen may well prove fatal.  At least to entire financial markets, large institutions, and a few sovereigns.

It’s essential to note that more than two-thirds of the net worth tracked in the above chart is now comprised of ‘financial assets.’  That is, paper claims on real things.

…click on the above link to read the rest of the article…

Angry China Slams Moodys For Using “Inappropriate Methodology”

Angry China Slams Moodys For Using “Inappropriate Methodology”

The market may have long since moved on from Moody’s downgrade of China to A1 from Aa3 (by now even long-only funds have learned that in a world with $18 trillion in excess liquidity, the opinion of Moodys is even more irrelevant), but for Beijing the vendetta is only just starting, and in response to Tuesday’s downgrade, China’s finance ministry accused the rating agency of applying “inappropriate methodology” in downgrading China’s credit rating, saying the firm had overestimated the difficulties faced by the Chinese economy and underestimated the country’s ability to enhance supply-side reforms.

In other words, Moody’s failed to understand that 300% debt/GDP is perfectly normal and that China has a very explicit exit strategy of how to deal with this unprecedented debt load which in every previous occasion in history has led to sovereign default.

The Ministry of Finance reaction came after Moody’s first, and very, very long overdue, downgrade of China since 1989 citing concerns about risks from China’s relentlessly growing debt load as shown below.

“China’s economy started off well this year, which shows that the reforms are working,” the ministry said in a statement on its website.  Actually, it only shows that China had injected a record amount of loans into the economy at the start of the year, and nothing else. And now that the credit impulse is fading, the hangover has arrived.

Moody’s on Wednesday also downgraded the ratings of 26 Chinese government-related non-financial corporate and infrastructure issuers and rated subsidiaries by one notch. It also downgraded the ratings of several domestic banks, including the Agricultural Bank of China Limited’s long-term deposit rating from A1 to A2.  It also eventually downgraded Hong Kong and said credit trends in China will continue to have a significant impact on Hong Kong’s credit profile due to close economic, financial and political ties with the mainland.

…click on the above link to read the rest of the article…

The Fallacy of Endless Economic Growth

THE FALLACY OF ENDLESS ECONOMIC GROWTH

What economists around the world get wrong about the future.

The idea that economic growth can continue forever on a finite planet is the unifying faith of industrial civilization. That it is nonsensical in the extreme, a deluded fantasy, doesn’t appear to bother us. We hear the holy truth in the decrees of elected officials, in the laments of economists about flagging GDP, in the authoritative pages of opinion, in the whirligig of advertising, at the World Bank and on Wall Street, in the prospectuses of globe-spanning corporations and in the halls of the smallest small-town chambers of commerce. Growth is sacrosanct. Growth will bring jobs and income, which allow us entry into the state of grace known as affluence, which permits us to consume more, providing more jobs for more people producing more goods and services so that the all-mighty economy can continue to grow. “Growth is our idol, our golden calf,” Herman Daly, an economist known for his anti-growth heresies, told me recently.

In the United States, the religion is expressed most avidly in the cult of the American Dream. The gatekeepers of the faith happen to not only be American: The Dream is now, and has long been, a pandemic disorder. Growth is a moral imperative in the developing world, we are told, because it will free the global poor from deprivation and disease. It will enrich and educate the women of the world, reducing birth rates. It will provide us the means to pay for environmental remediation—to clean up what so-called economic progress has despoiled. It will lift all boats, making us all rich, healthy, happy. East and West, Asia and Europe, communist and capitalist, big business and big labor, Nazi and neoliberal, the governments of just about every modern nation on Earth: All have espoused the mad growthist creed.

…click on the above link to read the rest of the article…

Want to Understand Rising Wealth Inequality? Look at Debt and Interest

Want to Understand Rising Wealth Inequality? Look at Debt and Interest

“Governments cannot reduce their debt or deficits and central banks cannot taper. Equally, they cannot perpetually borrow exponentially more. This one last bubble cannot end (but it must).”
I often refer to debt serfdom, the servitude debt enforces on borrowers. The mechanism of this servitude is interest, and today I turn to two knowledgeable correspondents for explanations of the consequences of interest.
Correspondent D.L.J. explains how debt/interest is the underlying engine of rising income/wealth disparity:
If we use $16T as the approximate GDP and a growth rate of, say, 3.5%, the total of goods and services would increase one year to the next by about $500B.
Meanwhile, referencing the Grandfather national debt chart with the USDebtClock data, the annual interest bill is $3 trillion ($2.7 trillion year-to-date).
In other words, those receiving interest are getting 5-6 times more than the increase in gross economic activity.
Using your oft-referenced Pareto Principle, about 80% of the population are net payers of interest while the other 20% are net receivers of interest.
Also, keep in mind that one does not have to have an outstanding loan to be a net payer of interest. As I attempted to earlier convey, whenever one buys a product that any part of its production was involving the cost of interest, the final product price included that interest cost. The purchase of that product had the interest cost paid by the purchaser.
Again using the Pareto concept, of the 20% who receive net interest, it can be further divided 80/20 to imply that 4% receive most (64%?) of the interest. This very fact can explain why/how the system (as it stands) produces a widening between the haves and the so-called ‘have nots’.
In other words, the wealthy own interest-yielding assets and the rest of us owe interest on debt.

…click on the above link to read the rest of the article…

Where There’s Smoke…

Where There’s Smoke…

…There’s central bank manipulation

Central banks around the world have colluded, if not conspired, to elevate and prop up financial asset prices.  Here we’ll present the data and evidence that they’ve not only done so, but gone too far.

When wee discuss elevated financial asset prices we really are talking about everything.

we’re talking not just about the sky-high prices of stocks and bonds, but also of the trillions of dollars’ worth of derivatives that are linked to them, as well as real estate in dozens of countries and locations.  All are intricately linked together. For instance, stocks are elevated, in part, because bond yields are so low.  Sam for real estate.

Here are three questions most alert investors are asking:

  • Question #1: When will financial assets ever ‘correct’ and fall in price?
  • Question #2: How much does overt propping by the central banks have to do with today’s elevated prices?
  • Question #3: How much does covert propping by central banks play a role in these inflated markets?

These are important questions to consider because if central banks have been too involved and gotten themselves mixed up in trying to ‘wag the dog’ by using elevated financial asset prices as a means to drive economic expansion — then the risk is a big implosion in financial asset prices if their efforts fail.

The difficulty, as always, is that you can’t print your way to prosperity.  It’s never worked in history and it won’t work this time either.  You can, however, print (or borrow) to delay a correction, after which a boost in real economic growth (or additional income) had better materialize to save your bacon.   But if enough growth does not emerge to both pay back all the old outstanding loans plus all the newly created debt and currency, then you’re going to experience a worse correction than if you had not tried to print/borrow your way to prosperity.

…click on the above link to read the rest of the article…

The Economy Is Like a Circus

The Economy Is Like a Circus

The reason the circus stays in town is because the economy stays in sufficient balance that the economy can go on. This is much like the way many other self-organized systems function. For example, our bodies continue to function as long as there are suitable balances in many different areas (oxygen, food, water, air pressure). Ecosystems continue to function as long as there is sufficient rain, adequate temperatures, and enough sunlight.

There are many different views as to what limits we reach in a finite world. Some people think we will “run out” of oil, or of energy products. Some think that the energy return will fall too low, as measured in some manner. I see the adequacy of the energy return as being very much tied to the financial system. Thus, the forecast by US Atlanta Fed GDPNow indicating that first quarter 2017 US GDP growth will only be 0.5% is likely to be a problem, assuming it is correct.

Our economy operates on economies of scale. Once we get too close to shrinking, or actually start shrinking, we reach a point where the economic circus starts to leave town. At some point, we will discover the circus is gone. The economy we thought we had, will have left us. If some people are survivors, they will need to pick up the pieces and start over with an entirely new system.

…click on the above link to read the rest of the article…

Will Trump Accept Responsibility When This Shitshow Implodes?

WILL TRUMP ACCEPT RESPONSIBILITY WHEN THIS SHITSHOW IMPLODES?

Donald J. Trump has taken credit for making America’s economy great again. He’s been crowing about all the jobs being created, the soaring consumer confidence and record highs in the stock market. It’s all because the Donald has inspired Americans about our glorious future.

But, a funny thing has been happening in the real world. The economy has gone into the shitter and GDP will be lucky to reach 1% in the first quarter of his presidency. The bullshit consumer confidence surveys mean absolutely nothing. Feelings don’t mean shit. What consumers do is what matters.

67% of the US economy is dependent upon Americans spending money they don’t have on shit they don’t need. And they’ve dramatically reduced that spending. If consumers are so confident, why are a record number of major retailers going bankrupt and closing 3,500 stores in 2017? Mom and pop retailers have been shuttering for years.

If the narrative about a dramatically improving housing market was true, why would furniture store sales and building material store sales be falling? They wouldn’t. It seems even the spendthrift millennials have run out of dough, as restaurant sales are in free fall. Restaurant chains have begun closing units now. It has only just begun.

The auto industry ponzi scheme has come to an end, as billions in subprime loans to deadbeats is finally coming home to roost. If you lend money to idiots with no means to repay you, the loans will go bad. Auto sales have begun to fall and will continue to fall for the next couple years, as this house of cards built on the Fed’s easy money collapses.

…click on the above link to read the rest of the article…

The American Dream, Twice Removed


Vincent van Gogh Corridor In The Asylum 1889
 

Nicole Foss is in Christchurch, New Zealand right now for the Living Economies Expo, and sent me, I’m still in Athens, Greece, a piece written by yet another longtime Automatic Earth reader, Helen Loughrey (keep ’em coming!), who describes her efforts trying to find a rental home in Fairfield County, Connecticut.

The first thing that struck me is how effortless and global sending information has become (category things you know but that hit you anyway occasionally, which is a good thing). The second is that the fall-out of the financial crisis has followed the same path as the information ‘revolution’: that is, it’s spreading faster than wildfire.

And I can’t avoid linking that to earlier periods of American poverty (see the photos), times in which ‘leaders’ thought it appropriate to let large swaths of the population live in misery, so everyone else would think twice about raising their voices. A tried and true strategy.

But of course there are large differences as well today between the likes of Greece and Connecticut. In Athens, there’s a poverty problem. In Fairfield County, there’s a (fake) ‘wealth problem’. Ever fewer people can afford to buy a home, so the rental market is ‘booming’ so much many can’t even afford to rent.

We can summarize this as ‘The Ravages Of The Fed’, and its interest rate policies. Or as ‘The Afterburn of QE’. That way it’s more obvious that this doesn’t happen only in the US. Every country and city in the world in which central banks and governments have deliberately blown real estate bubbles, face the same issue. Toronto, Sydney, Hong Kong, Stockholm, you know the list by now.

…click on the above link to read the rest of the article…


Maybe The Recovery Wasn’t Real After All

Maybe The Recovery Wasn’t Real After All

Then it all started to evaporate. Lackluster manufacturing and consumer spending reports sent the Atlanta Fed’s reading of Q1 GDP off a cliff to less than 1%:

And this morning the Wall Street Journal highlighted some recent changes in the yield curve that point towards further slowing:

Flatter Yield Curve in 2017 Shows Growth Concern Lingers

Long-term Treasury yields have declined modestly, while short-term yields have risen.A flattening of the Treasury yield curve in 2017 is a worrying sign for investors banking on resurgent U.S. inflation and growth.

Long-term Treasury yields, which are largely driven by the U.S. economic and inflation outlook, have declined modestly this year, following a sharp rise in the wake of the November election of Donald Trump as president. The 10-year U.S. Treasury yield has fallen to 2.396% from 2.446% at the end of 2016.

At the same time, short-term yields, which are more influenced by monetary policy, have risen in 2017 as Federal Reserve officials have made clear that they expect to continue raising the fed-funds rate through the rest of the year.
As a result, the yield premium on the 10-year note relative to the two-year note—known in the market as the 2-10 spread—slipped Wednesday to 1.107 percentage points, its lowest level since the election.

FIRST QUARTER REPORT CARD
While the yield curve, like all market indicators, is subject to the ebb and flow of investor sentiment, economic data and political developments, a flattening yield curve gets special attention from investors world-wide because it can serve as an early signal of both economic slowing and overpricing in riskier asset classes.

…click on the above link to read the rest of the article…

The Long Run Economics of Debt Based Stimulus

Something both unwanted and unexpected has tormented western economies in the 21st century.  Gross domestic product (GDP) has moderated onward while government debt has spiked upward.  Orthodox economists continue to be flummoxed by what has transpired.

What happened to the miracle? The Keynesian wet dream of an unfettered fiat debt money system has been realized, and debt has been duly expanded at every opportunity.  Although the fat lady has so far only cleared her throat (if quite audibly, in 2008) and hasn’t really sung yet, it is already clear that calling this system careening toward a catastrophic failure.

Here is the United States, since the turn of the new millennium (starting January 1, 2001) real GDP has increased from roughly $10.5 trillion to $18.6 trillion, or 77 percent.  Over this same time government debt has spiked nearly 250 percent from about $5.7 trillion to $19.9 trillion.  Obviously, some sort of reckoning’s in order to bring the books back into balance.

Throughout this extended episode of economic and financial discontinuity, the government’s solution to jump-starting the economy has been to borrow money and spend it.  Thus far, these efforts have succeeded in digging a massive hole that the economy will somehow have to climb out of.  We’re doubtful such a feat will ever be attained.

In short, additions of government debt over this time have been at a diminishing return.  Specifically, at the start of the new millennium the debt to GDP ratio was about 54 percent.  Today, it’s well over 100 percent.

US GDP and US federal debt, indexed (1984 = 100). Mises noted back in the late 1940s already that “it is obvious that sooner or later all these debts will be liquidated in some way or other, but certainly not by payment of interest and principal according to the terms of the contract.

…click on the above link to read the rest of the article…

Eric Peters: “If China And The World Bank Are Right, We’re Headed For A Depression”

Eric Peters: “If China And The World Bank Are Right, We’re Headed For A Depression”

“Some people blindly invested offshore and were in a rush to do so,” explained China’s central bank chief, justifying his recent capital controls.

“Some of this outbound investment was not in line with our own policies and had no real gain for China.” No doubt he’s right. The tycoons fleeing Chinese capital markets have done so selfishly. “So to regulate capital flows, I think it is normal,” concluded the central banker.

Chinese credit relative to GDP has doubled in the past decade to 300%. Which remains less than the US at 350%, but the rate of Chinese credit growth is as unsustainable as it is difficult to reverse — without tanking the economy. The tycoons are running from this dynamic. Because such loops almost always end badly. 

Anyhow, after so many years of secular stagnation fears, global investors have grown conditioned to run. They’ve been running away from fear for so long, they’ve forgotten how to run toward greed. Which has left them blindly holding over $10trln of bonds, which yield negative interest.

Now, this might make sense in a deflationary depression. But the global economy has not seen such strong synchronized cyclical growth in years. Inflation is likewise firming everywhere.

But China lowered its growth target again. As the World Bank warned that today’s strong global upswing in confidence and financial markets are not enough to pull the world out of a “low-growth trap.” If they’re right, we’re surely headed for depression. Because all this new debt requires robust economic strength to shoulder the weight.

But European debt markets are still largely priced for depression. And with JP Morgan’s CEO Jamie Dimon announcing the return of animal spirits in America’s economy, it seems more likely that this cycle ends like every other. With a blind run toward greed.

…click on the above link to read the rest of the article…

China Central Bank Admits It Has A Debt Problem, Warns No Easy Solution

China Central Bank Admits It Has A Debt Problem, Warns No Easy Solution

It’s a well-known risk, perhaps the biggest to the global financial system: China’s debt is too high, with estimates ranging from 250% to 300% of GDP per the IIF:

And while China has largely ignored, or avoided, discussing the troubling implications of its unprecedented debt load, this changed today when the head of China’s central bank, Zhou Xiachuan finally admitted that it has a debt “problem” saying that corporate debt levels are too high and that “it will take time to bring them down to more manageable levels”, underlining what has become the defining battle to put the world’s second-largest economy on a more sustainable footing: keeping GDP growing at 6.5% (or above) while injecting trillions in new debt.

“Non-financial corporate leverage is too high,” PBOC Governor Zhou Xiaochuan told reporters at a news conference on the sidelines of the annual parliament session.

Quoted by Reuters, he said that efforts will be made to contain debt levels, including restructuring of firms with heavy debt burdens, alongside a push to reduce excess industrial capacity.  Furthermore, banks will withdraw support for financially unviable firms, he added, repeating pledges by other officials last year to drive such “zombie” firms out of the market.

“I personally think this process is relatively medium-term. It won’t have very obvious results in the short-term because the existing stock (of debt) is very large,” he said.


Zhou Xiaochuan, Governor of the People’s Bank of China, attends a news 

conference in Beijing China March 10, 2017. REUTERS/Jason Lee

Zhou also said that measures by local governments to cool rising house prices will slow mortgage growth to some degree, but housing loans will continue to grow at a relatively rapid pace. We profiled China’s mortgage debt problem last October when we showed that over 70% of all new loans went to fund mortgages, which in turn now account for a fifth of total Chinese outstanding loans.

…click on the above link to read the rest of the article…

Bill Gross: “Our Financial System Is A Truckload Of Nitroglycerin On A Bumpy Road”

Bill Gross: “Our Financial System Is A Truckload Of Nitroglycerin On A Bumpy Road”

Courtesy of Bill Gross’ latest monthly letter “Show Me The Money“, here are some perspectives on the only thing that has kept the global economy going since the financial crisis: debt, and lost of it.
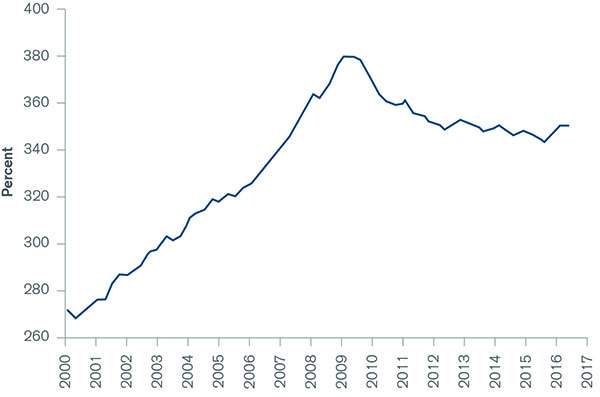
in 2017, the global economy has created more credit relative to GDP than that at the beginning of 2008’s disaster. In the U.S., credit of $65 trillion is roughly 350% of annual GDP and the ratio is rising. In China, the ratio has more than doubled in the past decade to nearly 300%. Since 2007, China has added $24 trillion worth of debt to its collective balance sheet. Over the same period, the U.S. and Europe only added $12 trillion each. Capitalism, with its adopted fractional reserve banking system, depends on credit expansion and the printing of additional reserves by central banks, which in turn are re-lent by private banks to create pizza stores, cell phones and a myriad of other products and business enterprises. But the credit creation has limits and the cost of credit (interest rates) must be carefully monitored so that borrowers (think subprime) can pay back the monthly servicing costs. If rates are too high (and credit as a % of GDP too high as well), then potential Lehman black swans can occur. On the other hand, if rates are too low (and credit as a % of GDP declines), then the system breaks down, as savers, pension funds and insurance companies become unable to earn a rate of return high enough to match and service their liabilities. 

U.S. Total Credit Market Debt as a Percent of GDP

Chart: U.S. Total Credit Market Debt as a Percent of GDP

Central banks attempt to walk this fine line – generating mild credit growth that matches nominal GDP growth – and keeping the cost of the credit at a yield that is not too high, nor too low, but just right. Janet Yellen is a modern day Goldilocks.

…click on the above link to read the rest of the article…

Olduvai IV: Courage
Click on image to read excerpts

Olduvai II: Exodus
Click on image to purchase

Click on image to purchase @ FriesenPress