Why The Gold Rush Is Just Beginning, In Six Charts
A lot of embarrassed investment advisors out there…
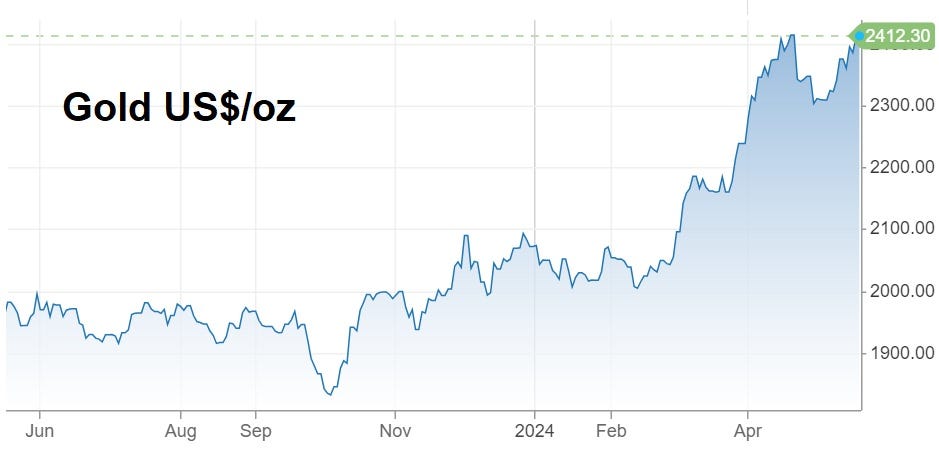
Gold blew through $2400/oz this morning:
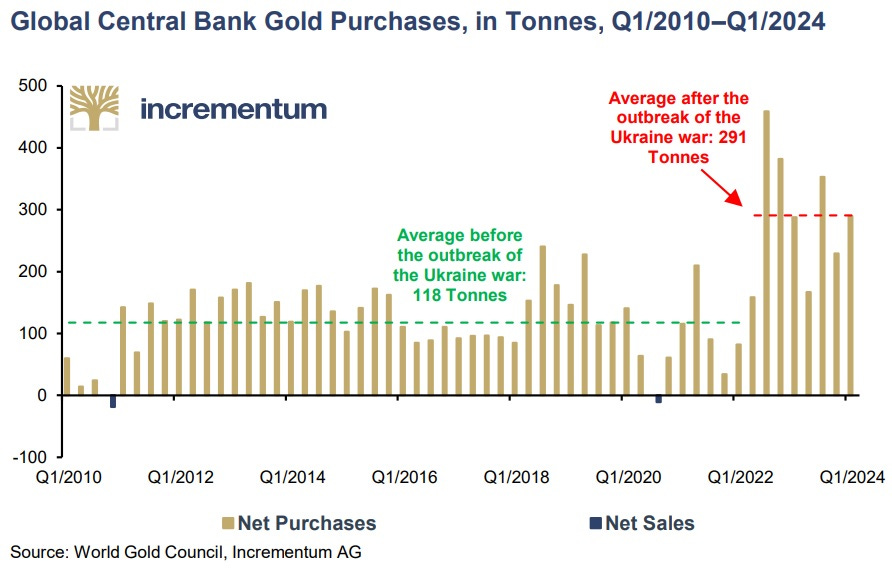
And the world’s central banks continue to add gold to their monetary reserves. Note that the real action coincided with the outbreak of the Ukraine war, when the US started slapping sanctions on everyone in sight. De-dollarization is a trend with legs.
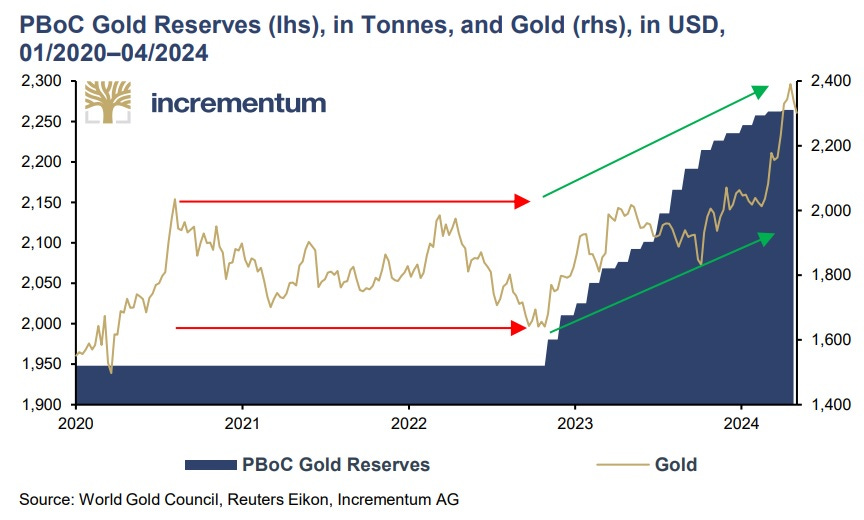
A case can be made that China alone is driving the current gold bull market. Note how the metal’s price tracks the increase in People’s Bank of China gold reserves.
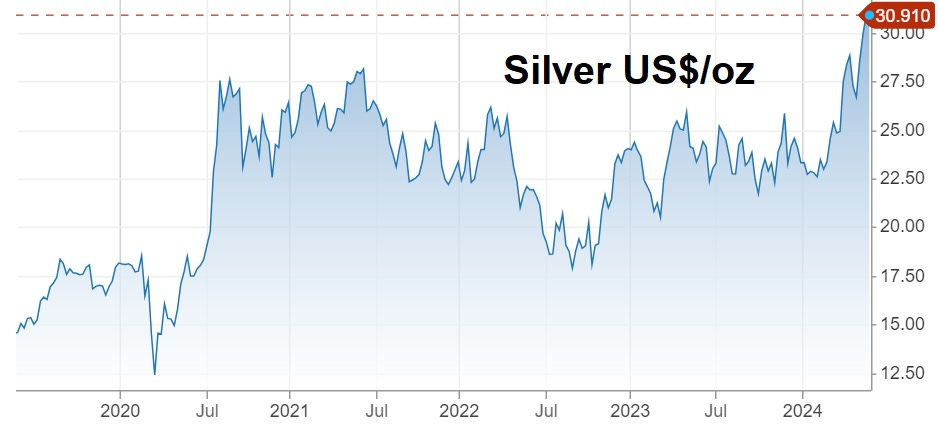
Silver just pierced its 5-year resistance. If it holds above $30/oz, $35 becomes the next big test.
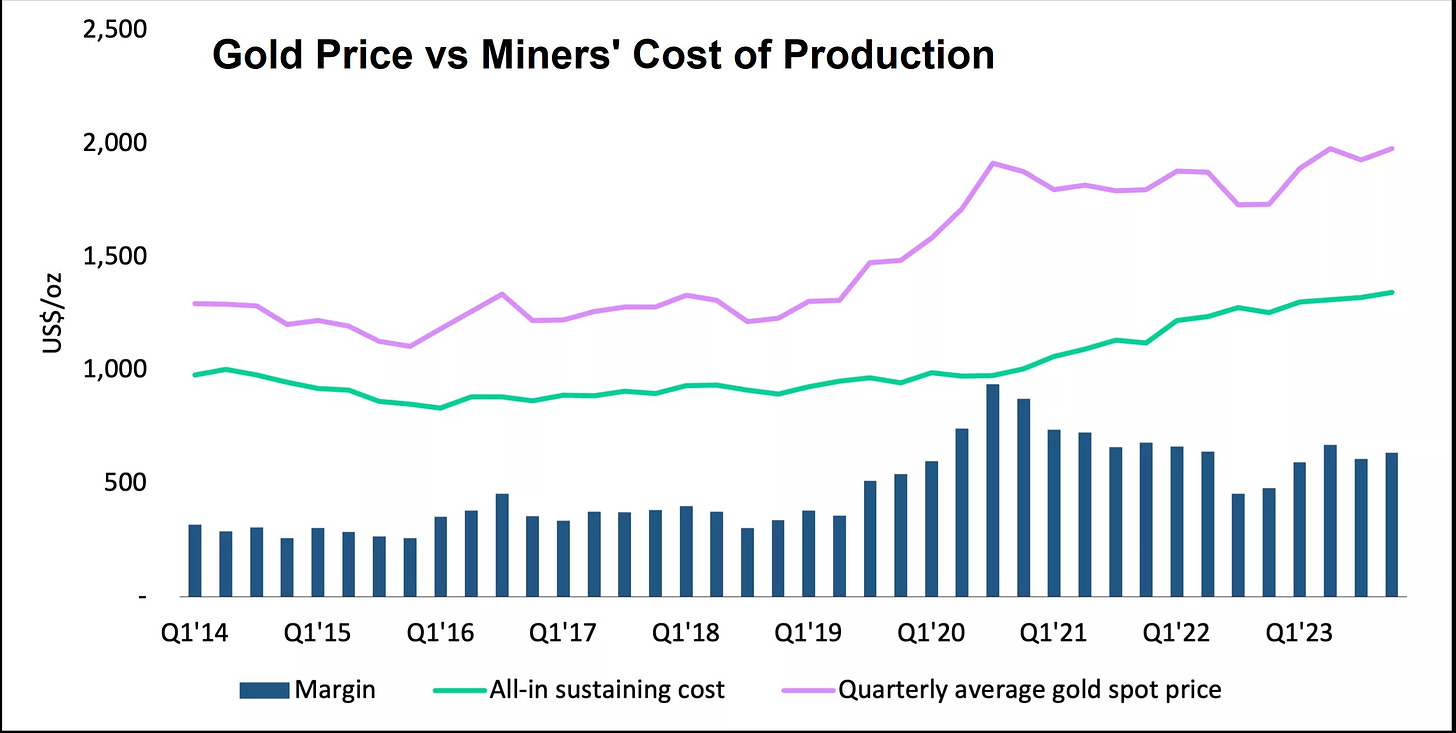
One of the problems with gold miner stocks has been the fact that mining costs are rising, which offsets some of the benefits of a higher gold price. But that’s changing, as gold rises faster than mining costs, widening miners’ margins and lighting a fire under their stocks. See Finally, Some Good-Looking Gold/Silver Miner Charts.
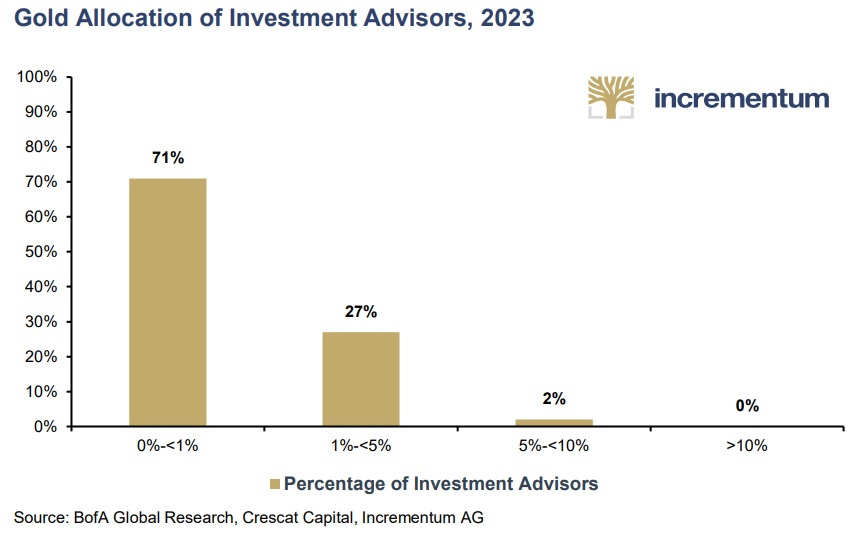
Is the gold rush played out? Well, 98% of mainstream investment advisors currently have less than 5% of their clients’ money in precious metals. Imagine all the tense upcoming meetings in which clients demand to know why they don’t own the year’s best-performing assets — and advisors apologize and promise to add gold to their mix. Just 1% of global investible capital flowing into gold would send it to the moon.
