Australian Green House Gas emissions down in 2020 due to Covid
The Australian Prime Minister claimed emissions are down 20% from 2005 levels
Prime Minister: “…Australia is part of the solution. Our emissions have fallen by 20 per cent since 2005. We are the only country to our knowledge, that engages in the transparency of reporting our emissions reductions, every sector, every gas, every quarter”
The Hon. Angus Taylor MP, Minister for Energy and Emissions Reduction: “We’re seeing extraordinary changes in farming practices, in the deployment of soil testing technologies by farmers across this country bringing down emissions, contributing to Australia’s performance, whereby we met and beat our Kyoto targets, our 2020 targets, 459 million tonnes. We beat those targets, almost a year’s worth of emissions. We’re on track to meet and beat our 2030 targets as well.”
https://www.pm.gov.au/media/press-conference-canberra-act-14
2005 is of course the year in which the Kyoto protocol (adopted in December 1997) came into force https://unfccc.int/kyoto_protocol for which Australia negotiated an INCREASE of 108% on 1990 levels for the commitment period 2008-2012. Remember that PM Rudd ratified Kyoto in December 2007, shortly after coming to power.
So let’s have a look at the latest quarterly report (December 2020) current at the time of the above media release:
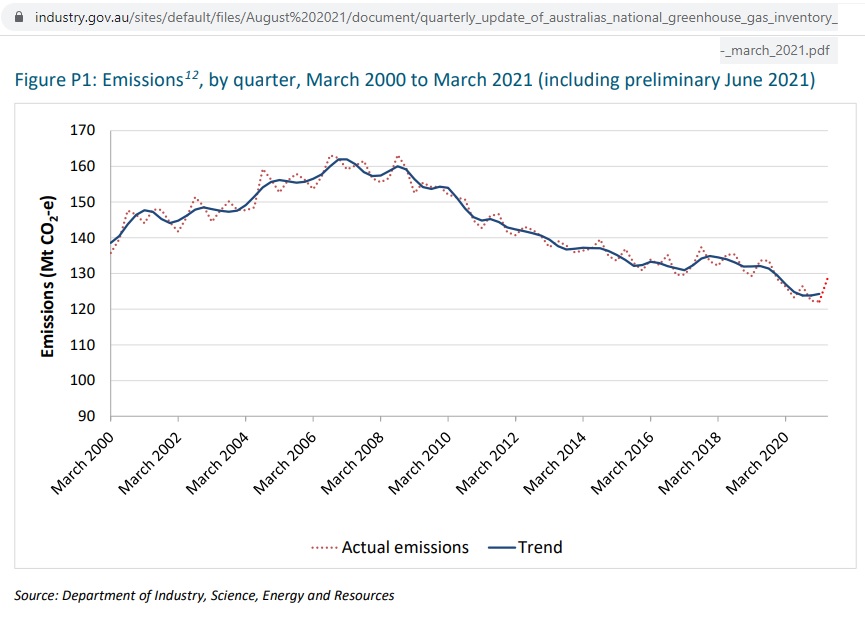 Fig 1: Australia’s emissions from the quarterly December 2020 report
https://www.industry.gov.au/data-and-publications/national-greenhouse-gas-inventory-quarterly-update-december-2020
An archive of all quarterly reports since March 2009 can be found here:
https://www.industry.gov.au/data-and-publications/national-greenhouse-gas-inventory-quarterly-updates
Note that the above graph is not zero scaled, so the decline looks impressive. The next graph with the same data gives the right perspective:
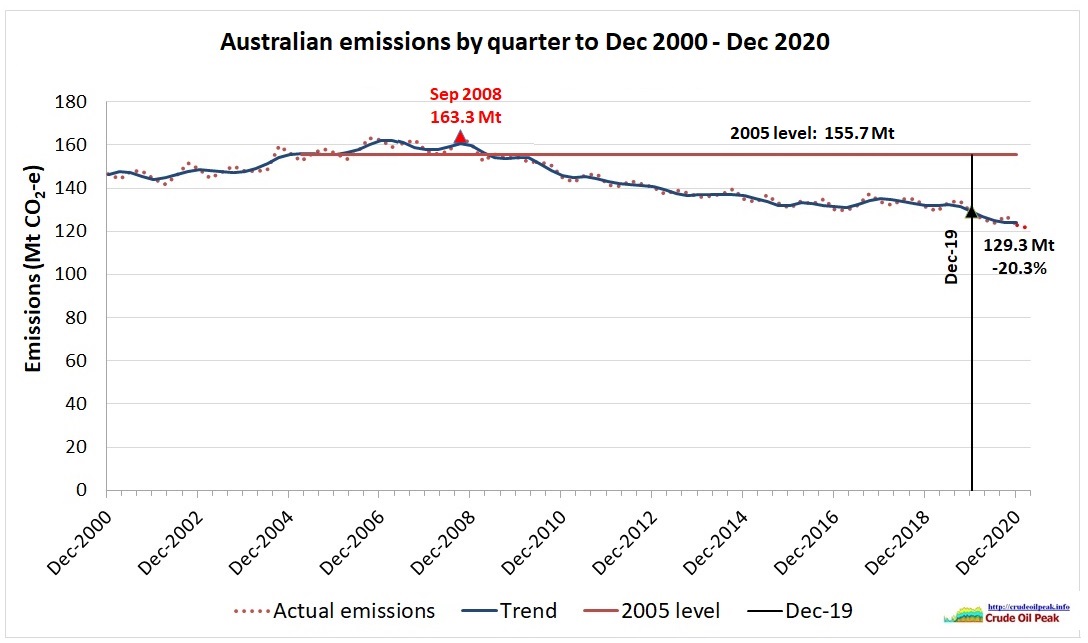 Fig 2: Quarterly emissions zero scaled with 2005 (trend) level
We use the data sources XLS file (Figure P1 sheet) and add the 2005 emissions level of 155.7 Mt (sum of quarterly emissions) as a horizontal red line which gives us a decrease of 20.3% by December 2019, the last month before Covid19 hit. The actual quarterly peak was in September 2008.
…click on the above link to read the rest of the article…