Plunge of Retail Inventories, Collapse of New & Used Vehicle Inventories: The Shortages Depicted in Charts
Inventories at retailers document this mess.
Turns out, when the US government spends $5 trillion in borrowed fiscal stimulus over 16 months, and the Fed hands out $4 trillion in monetary stimulus over the same period, causing asset prices to boom, demand for goods is going to wash over the land in tsunami-like waves, and supply chains that snake all over the world, amid finely honed just-in-time-inventory strategies, get tangled up. And as retail sales spiked in a historic manner, shortages of all kinds have been cropping up, including the semiconductor shortage that has slammed the auto industry with a vengeance.
Inventories at retailers document this mess. Inventories are tight all around, but they’re in catastrophic condition at auto dealers, which before the pandemic accounted for over one-third of total retail inventories.
Inventories at new vehicle dealers, used vehicle dealers, and parts dealers fell to $153 billion in May, down 36% from May 2019, according to data released by the Census Bureau on Friday. And the inventory-sales ratio – with inventories and sales both in dollars, the impact of inflation gets canceled out – dropped to 1.14, the lowest level in the data going back to 1992:
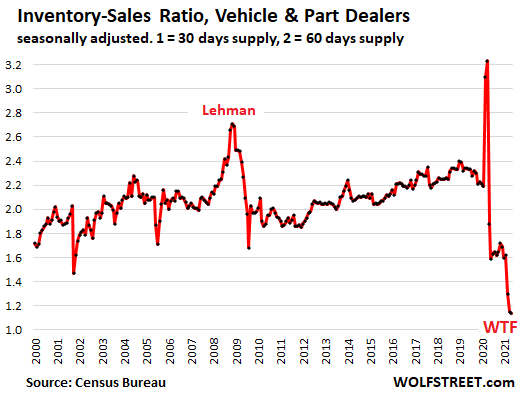
The inventory-sales ratio (inventories divided by sales) is a standard metric in the retail industry. A ratio of 1 means that the retailer has enough goods in inventory for one month of sales at the current rate of sales. This would be 30 days’ supply. A ratio of 2 – meaning 60 days’ supply – is considered healthy in the auto industry.
In dollar terms: The ever-more expensive vehicles in inventory over the years explain all of the long-term rise of inventories in the chart below. Unit retail sales – and unit inventories with them…
…click on the above link to read the rest of the article…