Graphic Anatomy of a Stock Market Crash: 1929 stock market crash, dot-com, and Great Recession

The 1929 stock market crash became the benchmark to which all other market crashes have been compared. The following graphs of the crash of 1929 and the Great Depression that followed, the dot-com crash, and the stock market crash during the Great Recession show several interesting similarities in the anatomy of the world’s greatest financial train wrecks. They also show some surprises that run against the way many people think of these most infamous of crashes.
Graphing the 1929 Stock Market Crash
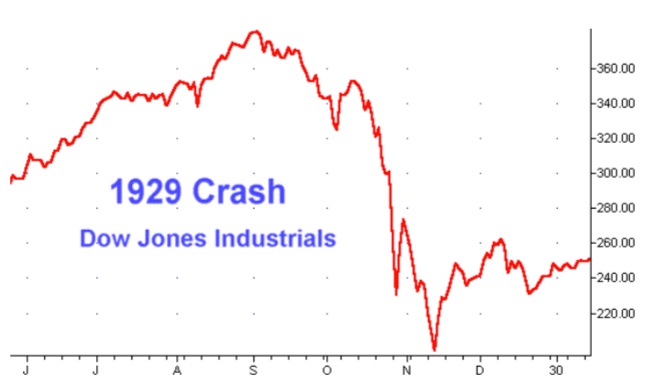
The stock market roared through the 1920’s. Building construction, retail, and automobile sales advanced from record to record … but debt also climbed as a way to finance all of that. This crescendoed in 1929 when the stock market experienced two particularly exuberant rallies about a month apart (one in June and one in August with a plateau between).
Then retail, housing and automobile sales started to fall apart.
Sound familiar?
Keep reading….
(The pattern is similar to what I described in my recent article, “Irrational Exuberance During Trump Rally Exceeded All Records! We’re sailing into a massive stock-market crash.“)
After the Dow peaked in ’29, it traded sideways for half of September and then took a fairly steep drop in the remaining half; yet, it recovered almost half of its fall during that infamous October, before rounding off quickly and plunging to its near death on Black Tuesday.
People tend to forget or not notice that even the infamous Black Tuesday crash on October 29, 1929, dog-legged back up the next week quickly and then crashed even harder over the next two weeks. Bouncing back up to its October 29 bottom, it stabilized, at a point down about 120 points from its peak, which meant the market recovered to a point about 33% below its summit. At it’s worst point that year, it was down 44%.

Graph of the Dow during the 1929 stock market crash
…click on the above link to read the rest of the article…