Home » Posts tagged 'volatility' (Page 3)

Tag Archives: volatility

Olduvai
Click on image to purchase

Olduvai III: Catacylsm
Click on image to purchase

Post categories

Post Archives by Category

Volatility and the Alchemy of Risk

Volatility and the Alchemy of Risk

Reflexivity in the Shadows of Black Monday 1987

The Ouroboros, a Greek word meaning ‘tail devourer’, is the ancient symbol of a snake consuming its own body in perfect symmetry. The imagery of the Ouroboros evokes the infinite nature of creation from destruction. The sign appears across cultures and is an important icon in the esoteric tradition of Alchemy. Egyptian mystics first derived the symbol from a real phenomenon in nature. In extreme heat a snake, unable to self-regulate its body temperature, will experience an out-of- control spike in its metabolism. In a state of mania, the snake is unable to differentiate its own tail from its prey, and will attack itself, self-cannibalizing until it perishes. In nature and markets, when randomness self-organizes into too perfect symmetry, order becomes the source of chaos (1).

The Ouroboros is a metaphor for the financial alchemy driving the modern Bear Market in Fear. Volatility across asset classes is at multi-generational lows. A dangerous feedback loop now exists between ultra-low interest rates, debt expansion, asset volatility, and financial engineering that allocates risk based on that volatility. In this self-reflexive loop volatility can reinforce itself both lower and higher. In a market where stocks and bonds are both overvalued, financial alchemy is the only way to feed our global hunger for yield, until it kills the very system it is nourishing.

The Global Short Volatility trade now represents an estimated $2+ trillion in financial engineering strategies that simultaneously exert influence over, and are influenced by, stock market volatility(2). We broadly define the short volatility trade as any financial strategy that relies on the assumption of market stability to generate returns, while using volatility itself as an input for risk taking. Many popular institutional investment strategies, even if they are not explicitly shorting derivatives, generate excess returns from the same implicit risk factors as a portfolio of short optionality, and contain hidden fragility.

…click on the above link to read the rest of the article…

Get Ready To Party Like It’s 2008

Get Ready To Party Like It’s 2008

Apparently Treasury Secretary, ex-Goldman Sachs banker Steven Mnuchin, has threatened Congress with stock crash if Congress doesn’t pass a tax reform Bill.  His reason is that the stock market surge since the election was based on the hopes of a big tax cut.  This reminds me of 2008, when then-Treasury Secretary, ex-Goldman Sachs CEO, Henry Paulson, and Fed Chairman, Ben Bernanke, paraded in front of Congress and threatened a complete systemic collapse if Congress didn’t authorize an $800 billion bailout of the biggest banks.

The U.S. financial system is experiencing an asset “bubble” that is unprecedented in history. This is a bubble that has been fueled by an unprecedented amount of Central Bank money printing and credit creation. As you are well aware, the Fed printed more than $4 trillion dollars of currency that was used to buy Treasury bonds and mortgage securities. But it has also enabled an unprecedented amount of credit creation. This credit availability has further fueled the rampant inflation in asset prices – specifically stocks, bonds and housing, the price of which now exceeds the levels seen in 2008 right before the great financial crisis.

However, you might not be aware that Central Banks outside of the U.S. continue printing money that is being used to buy stocks and risky bonds. The Bank of Japan now owns more than 75% of that nation’s stock ETFs. The Swiss National Bank holds over $80 billion worth of U.S. stocks, $17 billion of which were purchased in 2017. The European Central Bank, in addition to buying member country sovereign-issued debt is now buying corporate bonds, some of which are non-investment grade.

…click on the above link to read the rest of the article…

The S&P Is A Bloated Corpse


Fan Ho In Paris 1953

Update: I never did this before, but now I think I must: change the title of an article. “Minsky and Volatility” isn’t nearly as good as “The S&P Is A Bloated Corpse”. Simple, really. The URL will be the same as before

According to Hyman Minsky, economic stability is not only inevitably followed by instability, it inevitably creates it. Complacent humans being what they are. If he’s right, and would anyone dare doubt it, we’re in for that mushroom cloud on the financial horizon. We know that because market volatility, as measured for instance by the VIX, the Chicago Board Options Exchange (CBOE)’s volatility index, is scraping the depths of the Mariana trench.

Two separate articles at Zero Hedge this weekend, one by NorthmanTrader.com and one by LPLResearch.com, address the issue: it is time to be afraid and wake up. And that is not just true for investors or traders, it’s true for ‘everyone out there’ perhaps even more. Central bank policies, QE and ultra low rates, have distorted the financial system to such an extent -ostensibly in an attempt to save it- that the depressed, compressed volatility these policies have created can only come back to life with a vengeance.

Feel free to picture zombies and/or loss of heartbeat as much as you want; it’s all true. Financial markets haven’t been functioning for years, and there have been no investors either, only gamblers and profiteers, as savers and pensioners have been drawn and quartered. Central bankers have eradicated price discovery, nobody knows what anything is really worth anymore, be it stocks, bonds, housing, gold, bitcoin, you name it.

…click on the above link to read the rest of the article…

The Waiting Is The Hardest Part

BLOG

imgflip.com

The Waiting Is The Hardest Part

Tom Petty’s anthem for today’s investors

Man, what an awful stretch of events.

When I penned last week’s article on tragedy, little did I expect something as horrible as the Las Vegas massacre would immediately follow. And nearly lost in the headlines was the untimely passing of rock legend, Tom Petty, one of my all-time favorite musicians. Sure can’t wait for this week to be over…

In memory of Tom, I’ve been listening to a lot of his and the Heartbreakers’ best hits. The lyrics to one song in particular, The Waiting, well-captures an important message today’s investors should take to heart:

The waiting is the hardest part
Don’t let it kill you baby, don’t let it get to you

Those waiting for the financial markets to experience some sort (any sort!) of pullback have been waiting a long, looong time. How long?

  • It has been over 100 months (more than 8.5 years) since the current bull market began in April of 2009
  • It has been 15 months since the last (and very brief) drop of 5% in the S&P 500
  • This past September saw record low volatility, including a stretch now claimed to be “the most peaceful days in the history of the markets
  • Since last year’s presidential election, at which point the markets were already considered dangerously overvalued, the Dow Jones Industrial Average is up over 20%
  • As of this article’s publishing, the Dow, the S&P and the NASDAQ are all trading at record highs

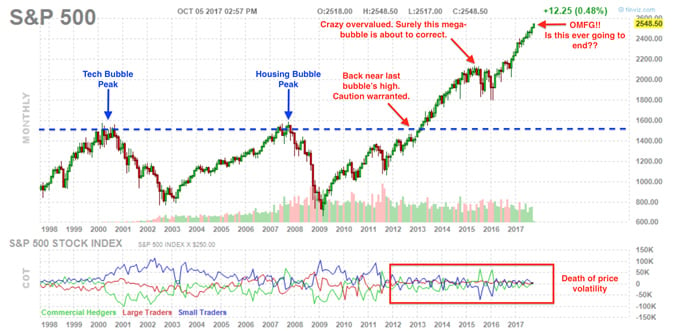
Or, to put it visually:

The stock market is now 70% higher than it was at the previous bubble peak immediately preceding the 2008 Great Financial Crisis.

Reflect for a moment how painful the crash from Oct 2008-March 2009 was. How much more painful will a crash from today’s much dizzier heights be?

…click on the above link to read the rest of the article…

Eric Peters On Tipping Points: “It All Worked Incredibly Well, Until It Blew Up”

Eric Peters On Tipping Points: “It All Worked Incredibly Well, Until It Blew Up”

Two years ago, long after we first suggested that the transformation of VIX from a measure of implied market volatility to a reflexive instrument that can be traded – and thus influence the underlying assets whose volatility it was supposed to measure – allowed the VIX to serve as the “fulcrum security” for broad asset manipulation, first the FT, then the WSJ confirmed what we said, namely that pervasive market manipulation was not only possible, but took place on a regular basis, courtesy of the VIX (see “Conspiracy “Fact” – VIX Manipulation Runs The Entire Market” and “Another Rigged Market: Scientific Study Finds Systemic VIX Auction Manipulation“).

Today, one of our favorite hedge fund commentators, One River Asset Mgmt CIO Eric Peters, discussed various market “tipping points” in his latest weekly notes, which emphasized why volatility is no longer a “measurement”, as much as a “target.” More his latest Sunday anecdote:

 “When a measure becomes a target, it ceases to be a good measure,” said the Englishman, stepping outside of himself.

“That’s Goodhart’s Law.” Charles Goodhart observed that central banks measured money supply, and found certain M1 growth rates to be optimal. But once they targeted that optimal range, M1 lost its value as a measure.

Market and economic actors adjusted their behavior to game the M1 system. So central bankers shifted to M2, then M3, and M4.

“Investing is obviously not a science, but if it were, we would say that you can’t act on something and observe it at the same time.” French colonialists discovered this in rat infested Hanoi, when they offered a bounty for killing rodents. To receive the reward, the Vietnamese were required to produce severed tails. Soon thereafter, tail-less rats scurried throughout the city. The bounty hunters removed their tails and released them to the filthy sewers to breed. Boosting their bounty.

…click on the above link to read the rest of the article…

Volatility in Housing: What Surges & Crashes the Most?

Volatility in Housing: What Surges & Crashes the Most?

It depends on the value of the home.

What happens to home prices during the current housing boom and the next housing bust depends to some degree on whether the home is relatively “affordable” — whatever that means at today’s prices — or more expensive.

This is an important data point in the consideration for lenders that have to worry about their collateral value and for residential property investors and for homeowners who might want to get a foretaste of what is next.

The CoreLogic Case-Shiller Home Price Index offers an index based on three tiers of prices — low tier, middle tier, and high tier. Like small-cap stocks versus large-cap stocks, the less expensive homes show much more price movements up anddown and are thus far more volatile during booms and busts than their more expensive counterparts.

The Tiered Home Price Index (TPI) comprises 16 metro areas: Boston, New York City, Washington DC, Chicago, Denver, Las Vegas, Los Angeles, San Diego, San Francisco (five-county Bay Area), Miami, Atlanta, Minneapolis, Phoenix, Portland, Seattle, and Tampa.

Prices in the low tier rose 10.8% year-over-year, according to the TPI, published in August. For mid-tier homes, the index rose 7.5%. And for expensive homes prices rose 4.8%.

That principle has been true for the past 17 years of the index, covering two housing booms and one housing bust so far. The chart below shows how prices of homes in the low tier (yellow line) rise much faster than higher priced homes, but during the bust, they also plunge much faster and bottom out a lot lower (chart via  John Burns Real Estate Consulting):

…click on the above link to read the rest of the article…

BofA: “Central Banks Are Now In A Desperate Dilemma”…”Start Buying Volatility”

BofA: “Central Banks Are Now In A Desperate Dilemma”…”Start Buying Volatility”

One week after the second biggest weekly inflow to Wall Street on record, the “risk on” rotation ended abruptly in the ensuing five days, when as Bank of America writes overnight, it observed “Inflows to structural “deflation”, outflows from cyclical “inflation”; with oil the “poster child” for this trend.”

Half a year after central bankers around the globe rejoiced that the Trump victory may finally spur the long-delayed period of global reflation, that hope is now dead and buried (even as the Fed keeps hiking into some imaginary inflation wave) which BofA’s Michael Hartnett observes not only in asset prices, but also in fund flows.

As the BofA strategist writes in a note aptly titled “Bubble, bubble, oil & trouble”, the big flow message “is structural “deflation” dominating cyclical “inflation” (oil price is the “poster child” for victory of deflation): outflows from TIPS; first outflows from bank loans in 32 weeks; outflows from US value funds in 8 of past the 9 weeks; 1st inflows to REITS in 11 weeks; biggest inflows to utilities in 51 weeks.

More importantly the tsunami of recent inflows, mostly into US equities, appears to finally be slowing: following sizable inflows to equities & bonds last week ($33.5bn in aggregate), a week of modest flows: $5.0bn into bonds, $0.5bn into equities, $0.8bn outflows from gold. Additionally, after the recent “tech wreck”, flows show confirm that contrarians – or simply stopped out algos – have flirted with sector rotation as inflows to energy ($0.4bn) were offset by outflows from tech ($0.2bn) & growth funds ($2.1bn);

Looking at BofA’s client base, Harnett notes that private clients were also sellers of tech past 4 weeks; and adds that despite the 20% YTD decline in oil price, energy funds ($2.8bn) and MLPs ($2.6bn) see inflows in 2017.

…click on the above link to read the rest of the article…
A Murderous Complacency

Dark omens are circling everywhere in today’s markets

murder: a flock of crows

~ Miriam-Webster dictionary

Many view the appearance of crows as an omen of death because ravens and crows are scavengers and are generally associated with dead bodies, battlefields, and cemeteries, and they’re thought to circle in large numbers above sites where animals or people are expected to soon die.

~ “Nature”, PBS.org

Running PeakProsperity.com requires me to read and process a lot of data on a daily basis. As it’s hard to digest it all in real-time, I keep a running list of charts, tables and articles that catch my attention, to return to when I have the time to give them my full focus.

Lately, that list has been getting quite long. And it’s largely full of indicators that concern me; signals that the long era of “extend and pretend” in today’s markets may finally be at its terminus.

Like crows circling overhead, every day brings with it new worrisome statistics that portend an ill change ahead. Indeed, these omens are increasing so quickly now that it’s hard not to feel like Tippi Hedren in Hitchcock’s suspense classic The Birds:

So what are the data that make me think these crows will soon be feasting on the carcass of the great bull market that has powered stock, bonds, real estate and most other asset classes to record highs since 2009?

Rogue’s Gallery

Complacent Investors

Investors have enjoyed remarkably gentle treatment by the stock markets over the past half-decade. Retracements have occurred much less frequently than historical norms, and have been shallow and short-lived when they happened.

Tom Lee, head of research at Fundstrat and often referred to as “Wall Street’s biggest bull” notes that 2016 was the mildest year on record for the S&P 500, with only 7 days in which the index traded at less than 3% of its 52-week high.

…click on the above link to read the rest of the article…


Sorry, Central Banks: Risk and Volatility Cannot be Extinguished

Sorry, Central Banks: Risk and Volatility Cannot be Extinguished

Central bank market intervention doesn’t extinguish risk–it simply transfers it to the system itself.
The unspoken claim of central bank policy is that risk can be extinguished by intervention/manipulation: once the Fed has your back, i.e. is supporting the market, risk disappears, and the easy profits flow to those who buy the dips with supreme confidence in the Fed’s ability to magically turn risk-assets into risk-free assets.
Unfortunately for the credulous investors who believe this, risk cannot be extinguished, it can only be transferred to others or to the system itself.
This confidence in central banks raises a pernicious systemic risk: assuming the “100-year flood” can’t happen every 6 years or so. I have from time to time highly recommended The Misbehavior of Markets. The author, fractal pioneer Benoit Mandelbrot, explains in simple mathematical ways how Modern Portfolio Theory, i.e. the management of risk, is based on a faulty conception of risk and statistical chance.
In a nutshell: while modern portfolio management is statistically based (all those “standard deviations” you always see referenced in quantitative analyses), the markets behave fractally. Fractals are known as the geometry of chaos, for they describe how seemingly stable systems can quickly, and unpredictably, degrade into chaos.
But as Mandelbrot explains, “100-year floods” actually occur with startling regularity in all markets. Put another way: you cannot disappear all risk with fancy statistical models and credit default swaps, etc., that offload the risk onto others, i.e. counterparties.
In other words, all you’re really doing is masking the risk–you’re not eliminating it. And in hiding the real risk, you are lulling the market participants into a pernicious choice architecture in which their willingness to take riskier and riskier actions is rewarded and encouraged, while caution is punished.

…click on the above link to read the rest of the article…

State Street: “Move Over Zero Hedge, There Is A New Bear In Town”

State Street: “Move Over Zero Hedge, There Is A New Bear In Town”

By Mr. Risk – State Street Global Markets

Unleash Volatility Beast

Thanks for nothing, central banks!

  1. If central banks provided the prototypical inflection point, risk assets should get destroyed next week.
  2. Feast your eyes on a compendium of volatility charts. The beast wants out.
  3. Keys to watch: DXY, EURAUD, and 10-year yields. Move over ZEROHEDGE. There is a new BEAR in town,

* * *

Ahead of the BOJ and Fed meetings, volumes slowed to a trickle, traders got back to flat, and algos reached for the offswitch. Now that event risk is in the rear view mirror, it is time to vote. Buy-the-dip or ‘‘sell everything?’’ If classic market reflexes are in play, a market meltdown following the passing of event risks is by far the more likely outcome. That US equities launched higher is nothing, because it  always does that on Fed day. The obligatory central bank forensic is a good place to begin.

Expectations as measured by overnight volatility ahead of the BOJ were the third highest in 3-years. Notably, 7 out of the 10 highest readings have occurred in 2016, which says something about the growing perception about policy failure. Expanding monetary base has not delivered higher inflation expectations or a weaker currency. Just about every 2016 meeting USDJPY sunk like the proverbial stone.

The ‘‘monetary assessment’’ conducted by the BOJ was an admission that QQE was unsustainable, and needed to be tweaked. Plan B is ‘‘QQE with yield curve control.’’ No, that is not a new shampoo. Here is the stripped down ghetto-economist version.

  1. Negative interest rate
  2. Stabilize 10-year yields at 0%
  3. Keep asset purchases at ¥80 tn/year
  4. Abandon monetary base target
  5. Aim to overshoot the 2.0% inflation target
  6. Rebalance ETF by buying less Nikkei 225 linked ETFs and more Topix, removing a well-flagged distortion.

…click on the above link to read the rest of the article…

Chaos & Volatility On The Rise

Chaos & Volatility On The Rise

The systems that support us are breaking down

The economy no longer spins off enough surplus for the elites to take what they consider their share with enough left over for everyone else.  So the wealth gap grows unchecked into politically and socially destabilizing levels.

The oceans are rapidly dying off: with corals bleaching, tide pools acidifying, and phytoplankton disappearing.  Weather weirdness is now so entrenched that all of the 50, 100 and 500-year events that happen each week are mainly reported on locally and garner little national and international attention.

Financial markets are increasingly volatile and dominated by an unruly universe of computer algorithms that now mainly play against each other, having driven off all the humans.

Politically, we’re seeing the former fringes of both parties increasingly come into power as they appeal to increasingly disenfranchised and disappointed electorates.

All of these are signs that the status quo has failed and continues to fail us. But the form of power expressed by our so-called ‘leaders’ today seems nearly incapable of healthy introspection coupled to correct action; preferring instead to do more of the same things that got us into this mess in the first place.

Those of us who can read the signs for what they are, not what we wish or believe them to be, have a special duty to first prepare ourselves for what’s coming and then help others. To put on our own oxygen masks first, and then help the others around us.

…click on the above link to read the rest of the article…

The SPV Loophole: Draghi Just Unleashed “QE For The Entire World”… And May Have Bailed Out US Shale

The SPV Loophole: Draghi Just Unleashed “QE For The Entire World”… And May Have Bailed Out US Shale

Almost exactly one year ago, we wrote “Mario Draghi, Collateral Scarcity, And Why The ECB Will Soon Buy Corporate Bonds.” 11 months later, the ECB confirmed this when for the first time ever, Mario Draghi said he would do purchase corporate bonds when he launched the ECB’s Corporate Sector Purchase Programme (CSPP), confirming that with government bond collateral evaporating and the liquidity situation getting precariously dangerous and forcing moments of historic volatility (as in the April/May 2015 Bund fiasco), he had run out of other options.

And while we have been covering this key development closely since its announcement more than a month ago, we were surprised by how little attention most of the sellside was paying to what is clearly a watershed moment in capital markets as a central banks now openly backstops corporate bond issuance (among other things pointing out a month ago Why The ECB Will Be Forced To Buy Junk Bonds Next). Ironically, the market was fully aware of what the ECB’s action meant as we showed in the “The ECB Effect: European Telecom Issues Largest Ever Junk Bond After More Than 100% Upsizing.”

Now, following the release of the full details of its corporate bond buying program, analysts are once again keenly focused on hits program who impact will be dramatic over the coming years.

First, as a reminder, here are the big picture details:

  • May buy in primary and secondary markets
  • Issue share limit of 70% per ISIN
  • Inclusion of bonds issued by insurance companies
  • Can buy bonds of companies incorporated in the euro area whose ultimate parent is not based in the euro area
  • Remaining maturity of 6 months and maximum of 30Y

…click on the above link to read the rest of the article…

SocGen: “Now We Know Why The Fed Desperately Wants To Avoid A Drop In Equity Markets”

SocGen: “Now We Know Why The Fed Desperately Wants To Avoid A Drop In Equity Markets”

With the ECB now unabashedly unleashing a bond bubble in Europe of which it has promised to be a buyer of last resort with the stronly implied hint that European IG companies should issue bonds and buy back shares, and promptly leading to the biggest junk bond issue in history courtesy of Numericable, it will come as no surprise that the world once again has a debt problem.

For the best description of just how bad said problem is we go to SocGen’s Andrew Lapthorne, one of last few sane analyzers of actual data, a person who first reveaked the stunning fact that every dollar in incremental debt in the 21st century has gone to fund stock buybacks, and who in a note today asks whether “central bank policies going to bankrupt corporate America?”

His answer is, unless something changes, a resounding yes.

Here are the key excerpts:

Sensationalist headlines such as the one above are there to grab the reader’s attention, but the question is nonetheless a serious one. Aggressive monetary policy in the form of QE and zero or negative interest rates is all about encouraging (forcing?) borrowers to take on more and more debt in an attempt to boost economic activity, effectively mortgaging future growth to compensate for the lack of demand today. These central bank policies are having some serious unintended consequences, particular on mid cap and smaller cap stocks.

Aggressive central bank monetary policies have created artificial demand for corporate debt which we think companies are exploiting by issuing debt they do not actually need. The proceeds of this debt raising are then largely reinvested back into the equity market via M&A or share buybacks in an attempt to boost share prices in the absence of actual demand.

…click on the above link to read the rest of the article…

Diversify Into Gold As An “Insurance Policy” Against Geopolitical Risk

Diversify Into Gold As An “Insurance Policy” Against Geopolitical Risk

“Investors could be forgiven for heading for the hills given the tumultuous start to 2016,”  so writes Andrew Oxlade in The Telegraph today who advises investors to diversify into gold as an “insurance policy”:

We have long been advocates of exposure to gold as an insurance policy. This was demonstrated once again in the recent sell-off when the price of bullion surged from $1,061 (£762) an ounce on New Year’s Day to $1,246 (£895) by early February. In times of fear, gold is in demand. The price also rises when inflation becomes a danger.

Deflation remains the bigger threat for now, which is partly why gold has been a poor investment in recent years, but the money printing excesses of central banks could yet unleash inflation. In the meantime, the gold price offers some protection during repeat episodes of buckling confidence.

Gold_GBP
Gold in GBP – 5 Years

The Telegraph, like GoldCore, had warned of such turbulence at the start of the year. John Ficenec, editor of the Questor column, warned of the real risk of volatility and falls in stock markets.

We believe that the tragic events in Brussels show the continued very high degree of geopolitical risk and the need for an insurance policy.

Further attacks are quite possible, including in the U.S., and this should support gold.

Geopolitical risk is frequently underestimated and it would be unwise to discount the risk of a September 11 style attack in the coming months. Intelligence agencies and ISIS themselves are warning of such attacks and investors need to be diversified to hedge this growing risk.

It gives us no pleasure to be the bearer of this bad news but it is important that the reality of the real risks of today are considered in order to protect and grow wealth in these uncertain times.

…click on the above link to read the rest of the article…

Economics Is Like A Religion – Just Faith In Theory

Economics Is Like A Religion – Just Faith In Theory

Everyone is missing the serious problem that ultra-low interest rates have created for retirees.

Pension funds are still assuming that future returns will be in the 7½–8% range. And as people get older and have no practical way to go back to work, pension funds that are forced to reduce payments in 10 or 15 years (and some even sooner) will destroy the lifestyles of many.

So what made Europe and Japan agree that negative rates-with all their known and unknown consequences—are a solution to our current economic malaise?

I have been trying to explain this by comparing economic theories to a religion.

Everyone understands that there is an element of faith in their own religious views, and I am going to suggest that a similar act of faith is required if one believes in academic economics.

Economics and religion are actually quite similar. They are belief systems that try to optimize outcomes. For the religious, that outcome is getting to heaven, and for economists, it is achieving robust economic growth-heaven on earth.

I fully recognize that I’m treading on delicate ground here, with the potential to offend pretty much everyone. My intention is to not to belittle either religion or economics, but to help you understand why central bankers take the actions they do.

The No. 1 Commandment of a Central Bank

Central bankers are always-and everywhere-opposed to inflation. It’s as if they are taken into a back room and given gene therapy. Actually, this visceral aversion is also imparted during academic training in the elite schools from which central bankers are chosen.

This is our heritage; it’s learning derived not only from the Great Depression but also from all of the other deflationary crashes in our history (not just in the US but globally).

…click on the above link to read the rest of the article…

Olduvai IV: Courage
Click on image to read excerpts

Olduvai II: Exodus
Click on image to purchase

Click on image to purchase @ FriesenPress