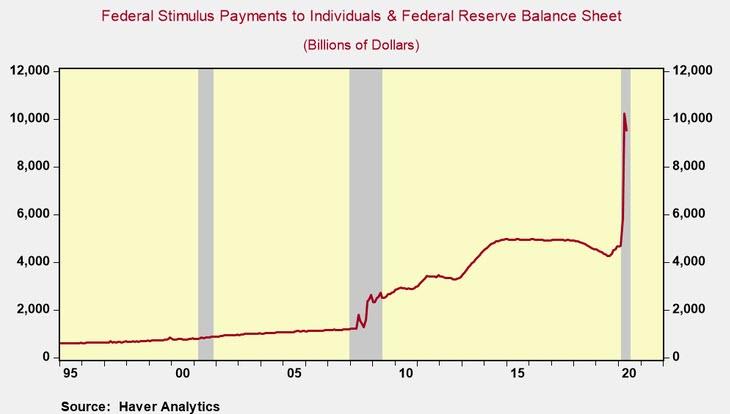
Never Before Has So Much Stimulus Been Injected In The Economy In A Single Quarter
Pandemic-Driven Recession Is Not Over
Back-to-back strong monthly gains in retail sales in May and June and a powerful rebound in the equity markets in Q2 create the impression the recession is over. But the recessionary environment is only delayed, hidden by the record amount of fiscal and monetary stimulus that has postponed layoffs, spending cutbacks, bankruptcies, and business failures and operating losses.
The pandemic crisis is unique in that it involves public health, finance, and economics. An all-out policy package of fiscal and monetary stimulus helped finance recover and the economy to rebound. However, a pandemic-driven recession runs on its own timeline and is unaffected by the scale of stimulus. The new wave of COVID cases could quickly trigger a shift in investor sentiment from optimism to pessimism as the rebound in corporate earnings is postponed.
Record Output Loss & Record Stimulus
According to the latest GDP NOW report from the Federal Reserve Bank of Atlanta, Q2 GDP is estimated to have declined 35% at an annualized rate. That would be 4x times larger than the prior record decline of 8.4% annualized in Q4 2008.
Quarterly dollar estimates of GDP are reported on an annual rate basis. So assuming the GDP NOW estimate is close to the mark, Q2 Nominal GDP would fall below the $20 trillion (or $ 5 trillion for the quarter), a level last seen in 2017.
$5 trillion in nominal output (and income) in Q2 would essentially match the record amount of fiscal and monetary stimulus that hit the economy in the period.
According to my estimates, the combination of federal stimulus payments to individuals (i.e., stimulus checks to individuals, additional unemployment benefits to a broader range of workers never before eligible and other programs) plus the expansion of Federal Reserve Balance sheet amounted to an increase of approximately $5 trillion in aggregate fiscal and monetary stimulus over the three months ending in June (see chart).

…click on the above link to read the rest of the article…