Seeing the market crash from a few weeks ago, it is clear how quickly the markets can ferociously thrust past one’s risk models. Risk models that failed to safeguard against risk when it absolutely mattered the most. Models that left many large hedge funds hemorrhaging – top funds which by definition were supposed to protect their investors during the August tumult. Instead when markets broke bad, a lot of things “went wrong”. And stayed that way. In this article, we explore a number of the large U.S. market crashes since the mid-20th century, and show how the recent bust compares. We learn why relying on tail risk models
whose approximations presume to work consecutively at all times, can lead to failure. The key for investors (if they must be active) is to always remain vigilant. Professor Nassim Taleb recently expressed it nicely:
The *only* way to survive is to panic & overreact early, particularly [as] those who “don’t panic” end up panicking & overreacting late.
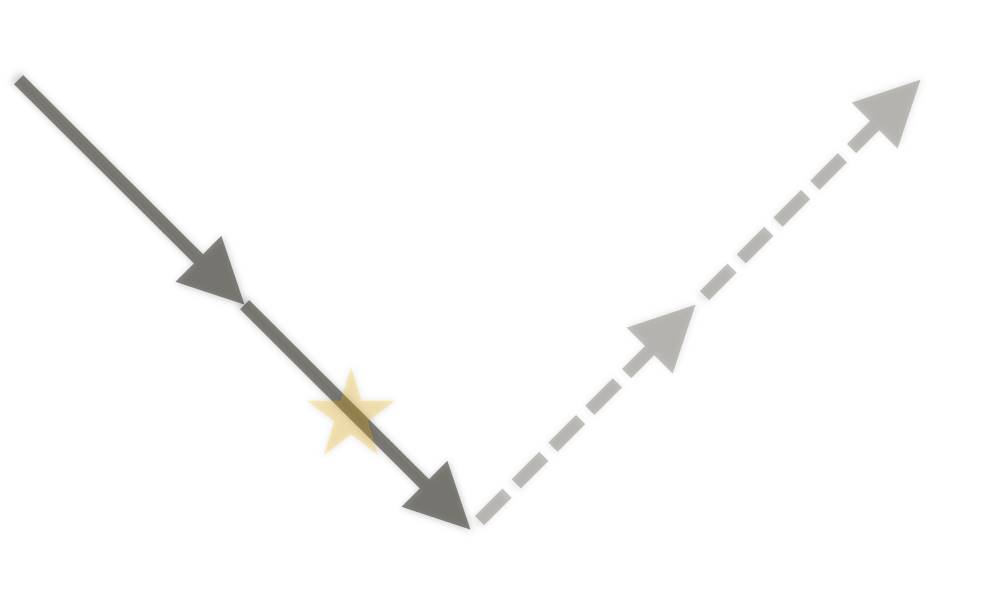
And there were many who wound up in panic mode, in recent weeks. Expeditiously selling at a loss, under record volume on August 24 (China’s Black Monday). Let’s first consider what an overall market crash look like. We quickly show a symmetrical V-shaped illustration here. This illustration also shows a rise in fear on the way down, with peak panic near the bottom (the orange star), then followed by up-moves that mirror the previous down-moves. We will need to review this overall shape in a future article. But for now we discuss simply the left side of the illustration (the solid brown down-arrows).
…click on the above link to read the rest of the article…