Home » Posts tagged 'housing market' (Page 2)

Tag Archives: housing market

Olduvai
Click on image to purchase

Olduvai III: Catacylsm
Click on image to purchase

Post categories

Post Archives by Category

The “Nightmare Scenario” For Beijing: 50 Million Chinese Apartments Are Empty

Back in 2017, we explained why the “fate of the world economy is in the hands of China’s housing bubble.” The answer was simple: for the Chinese population, and growing middle class, to keep spending vibrant and borrowing elevated, it had to feel comfortable and confident that its wealth would keep rising. However, unlike the US where the stock market is the ultimate barometer of the confidence boosting “wealth effect”, in China it has always been about housing as three quarters of Chinese household assets are parked in real estate, compared to only 28% in the US, with the remainder invested financial assets.

Source: Xinhua

Beijing knows this, of course, which is why China periodically and consistently reflates its housing bubble, hoping that the popping of the bubble, which happened in late 2011 and again in 2014, will be a controlled, “smooth landing” process.  For now, Beijing has been successful in maintaining price stability at least according to official data, allowing the air out of the “Tier 1” home price bubble which peaked in early 2016, while preserving modest home price appreciation in secondary markets.

How long China will be able to avoid a sharp price decline remains to be seen, but in the meantime another problem faces China’s housing market: in addition to being the primary source of household net worth – and therefore stable and growing consumption – it has also been a key driver behind China’s economic growth, with infrastructure spending and capital investment long among the biggest components of the country’s goalseeked GDP. One result has been China’s infamous ghost cities, built only for the sake of Keynesian spending to hit a predetermined GDP number that would make Beijing happy.

…click on the above link to read the rest of the article…

Here Comes The Housing Bust “Reverse Wealth Effect,” Australia Edition

Here Comes The Housing Bust “Reverse Wealth Effect,” Australia Edition

For the past few years, homeowners just about everywhere have been able to finesse life’s problems by thinking “at least my house is going up.” This home equity accretion allowed them to buy stuff on credit, safe in the knowledge that even as they maxed out yet another credit card their net worth continued to rise. They felt smart and confident, in other words, and so continued to behave in ways that the modern world defines as normal and natural.

But now that’s ending. Home prices have stopped rising in many places and in a few canaries in the financial coal mine have begun to plunge. Here’s what “plunge” means for Australians:

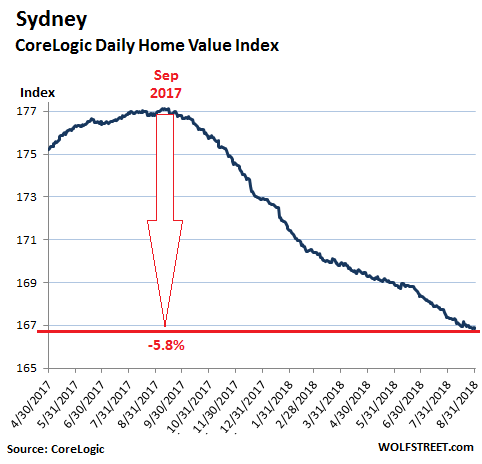
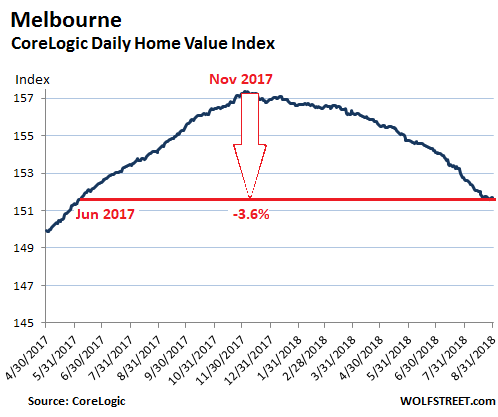
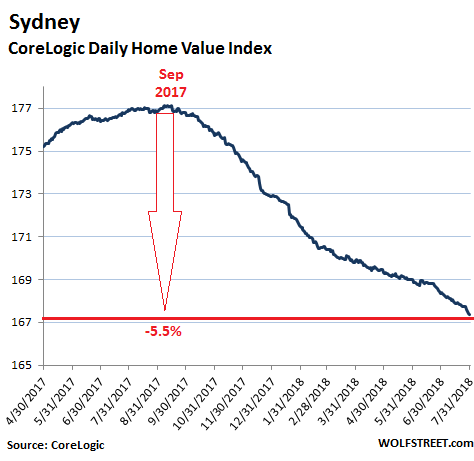
House prices ‘falling by over $1,000 a week’ in Sydney and Melbourne, Deloitte says

The boom time is over and we’re now officially experiencing the “house price fall we had to have”, according to Deloitte Access Economics’s latest business outlook.

It has found what many had been predicting: prices are dipping as interest rates are rising, with our biggest cities feeling the winds of change most keenly.

“Our house prices here in Australia had streaked past anything sensible by way of valuation,” said Deloitte partner Chris Richardson.
“Now, finally gravity has caught up with that stupidity and prices are falling.

“In Sydney and Melbourne, housing prices are falling by over $1,000 a week.”

Prices had surged across the country over the past five years as historically low interest rates have driven Australians to load up on debt, while investors had also cashed in.

Not if, but by how much
Housing forecasts have gone from disagreement over whether home prices will fall to debates about how much they’ll decline.

…click on the above link to read the rest of the article…

Violence, Public Anger Erupts In China As Home Prices Slide

Last March, we discussed why few things are as important for China’s wealth effect and economy, as its housing bubble market. Specifically, as Deutsche Bank calculated at the time, “in 2016 the rise of property prices boosted household wealth in 37 tier 1 and tier 2 cities by RMB24 trillion, almost twice their total disposable income of RMB12.9 trillion.” The German lender added that this (rather fleeting) wealth effect “may be helping to sustain consumption in China despite slowing income growth” warning that “a decline of property price would obviously have a large negative impact.”

Naturally, as long as the housing bubble keeps inflating and prices keep rising, there is nothing to worry about as the population will keep spending money buoyed by illusory wealth appreciation. It is when housing starts to drop that Beijing begins to panic.

Fast forward to today, when Beijing may be starting to sweat because whereas Chinese property developers usually count on September and October to be their “gold and silver” months for sales, this year has turned out to be different. As the SCMP reports, not only were sales figures grim for September, but the seven-day national holiday last week also brought at least two “fangnao” incidents – when angry, and often violent, homeowners protest against price cuts offered by developers to new buyers.

These protests are often directed at sales offices, with varying levels of intensity – from throwing rocks to holding banners and putting up funeral wreaths. The risk, of course, is that as what has gone up (wealth effect) will come down, and as home ownership has remained the most important channel of investment for urban households in China in the past decade, price cuts have become increasingly unacceptable and a cause for social unrest.

…click on the above link to read the rest of the article…

Evidence The Housing Bubble Is Bursting?: “Home Sellers Are Slashing Prices At The Highest Rate In At Least Eight Years”

Evidence The Housing Bubble Is Bursting?: “Home Sellers Are Slashing Prices At The Highest Rate In At Least Eight Years”

The housing market indicated that a crisis was coming in 2008.  Is the same thing happening once again in 2018?  For several years, the housing market has been one of the bright spots for the U.S. economy.  Home prices, especially in the hottest markets on the east and west coasts, had been soaring.  But now that has completely changed, and home sellers are cutting prices at a pace that we have not seen since the last recession.  In case you are wondering, this is definitely a major red flag for the economy.  According to CNBC, home sellers are “slashing prices at the highest rate in at least eight years”…

After three years of soaring home prices, the heat is coming off the U.S. housing market. Home sellers are slashing prices at the highest rate in at least eight years, especially in the West, where the price gains were hottest.

It is quite interesting that prices are being cut fastest in the markets that were once the hottest, because that is exactly what happened during the subprime mortgage meltdown in 2008 too.

In a previous article, I documented the fact that experts were warning that “the U.S. housing market looks headed for its worst slowdown in years”, but even I was stunned by how bad these new numbers are.

According to Redfin, more than one out of every four homes for sale in America had a price drop within the most recent four week period…

In the four weeks ended Sept. 16, more than one-quarter of the homes listed for sale had a price drop, according to Redfin, a real estate brokerage. That is the highest level since the company began tracking the metric in 2010. Redfin defines a price drop as a reduction in the list price of more than 1 percent and less than 50 percent.

…click on the above link to read the rest of the article…

Australia’s Big Banks Raise Mortgage Rates, Sparking Housing Market Fears

For decades, the housing market in Australia – which has not seen a recession in 27 years – appeared immune to any external or internal shocks, as prices kept rising gingerly year after year. That all changed in the past year, when according to Core Logic, home prices across Australia’s 5 top cities peaked in October of 2017 and have since declined by 3.5% on average.

That decline is now set to accelerate because overnight, two of Australia’s biggest banks, Commonwealth Bank of Australia and Australia and New Zealand Banking Group, announced within minutes of each other that they are raising mortgage rates citing higher funding costs, cutting chances of an official rate hike and risking a political backlash.

The rate increases followed one week after Australia’s second largest bank, Westpac, became the first of the so-called “Big Four” to raise rates. That prompted fierce criticism from Prime Minister Scott Morrison. The former Treasurer demanded the bank explain itself and suggested unhappy borrowers should shop around.

“They have to justify, in this environment when people are really feeling it, why they believe they need to clip that ticket a little harder when people in Australia and their customers I think are doing it tough,” he told reporters.

Fourth-ranked National Australia Bank Ltd is the only one of the majors not to deliver an out-of-cycle rate rise.

CommBank will increase all variable home loan rates by 15 basis points from October 4, while ANZ will hit all borrowers with a 16 basis point increase from September 27. The change means a customer with a $400,000 loan from CommBank will pay an extra $37 a month, or $447 a year. An ANZ customer with the same loan will pay an extra $40 a month, or $476 a year.

…click on the above link to read the rest of the article…

Housing Bubble Pops in Sydney & Melbourne, Australia

Housing Bubble Pops in Sydney & Melbourne, Australia

And with impeccable timing, an immense flood of new construction.

In Sydney, breeding ground for one of the world’s biggest housing bubbles, prices of single-family houses dropped 7.3% in August, compared to a year earlier. Prices of “units” — condos in US lingo — fell 2.2% year-over-year. Price declines were the sharpest at the high end, with prices down 8.1% in the most expensive quarter of home sales. Prices of all types of homes combined fell 5.6%, according to CoreLogic’s Daily Home Value Index. The index is down 5.8% from its peak last September:

Melbourne, where the inflection point has been lagging a few months behind Sydney’s, is in the process of catching up. Over the three month-period, June-August, prices fell 2.0%, making Melbourne the weakest housing market among the capital cities. By segment, house prices fell 2.7% from a year ago while condo prices still inched up 1.5%. At the most expensive quarter of sales, prices fell 5.2% from a year ago. For all types of dwellings combined, prices declined 1.7% year-over-year, to the lowest level since early June 2017, according to CoreLogic. Prices are down 3.6% from their peak at the end of November 2017:

Corelogic tracks the largest five of Australia’s eight capital cities in a separate index. Due to the size of their housing markets, Sydney and Melbourne weigh the most. In the remaining three of the five capital cities in the index, prices were mixed in August:

  • In Brisbane, home prices inched up 0.9% year-over-year.
  • In Adelaide, home prices ticked up 1.0%.
  • In Perth, home prices fell 2.0%, with houses down 1.5% and condos down 4.4%. Prices have been skidding since late 2014, when Western Australia mining boom turned into a mining bust.

The aggregate five capital cities index fell 3.1% in August year-over-year. The index has declined month-to-month for 11 months in a row and is down 3.5% from its peak in October 2017:

…click on the above link to read the rest of the article…

More Evidence The Economy Is Deteriorating

More Evidence The Economy Is Deteriorating

“Financial-market and economic prospects remain far shy of the hype and headlines, amidst tanking consumer optimism and negative revisions to recent reporting.” – John Williams, Shadowstats.com

The economy may seem like it’s doing well if you are part of the upper 10% demographic. Though, in reality, for most of the upper 10%, doing “well” has been a function of having easy access to credit. NASA Federal Credit Union is offering 0% down, 0% mortgage insurance for mortgages up to $2.5 million.

Someone I know suggested the tax cut stimulus had run its course. But the narrative that the tax cuts would stimulate economic activity was pure propaganda. The tax cuts stimulated $1 trillion in expected share buybacks and put more money in the pockets of corporate insiders and billionaires. The average middle class household spent its tax cut money on more expensive gasoline and food. Since the tax cut took effect, auto sales and home sales have declined. Retail sales have been mixed. However, it’s difficult to distinguish between statistical manipulation and inflation. I would argue that, net of real inflation and Census Bureau statistical games, real retail sales have been declining.

As an example, last week Black Box Intelligence released July restaurant sales. While comparable store sales were up 0.54% over July 2017, comparable restaurant traffic was down 1.8%. On a rolling three months, comp sales are up 0.46% but comparable traffic is down nearly 2%. With traffic declining, especially a faster rate relative to the small increase in sales, it means the sales “growth” is entirely a function of price inflation. If Black Box Intelligence could control it’s data for price increases, it would show that there is no question that real sales are declining. I have been loathe to recommend shorting restaurant stocks because, for some reason, the hedge funds love them.

…click on the above link to read the rest of the article…

So Bloody Predictable: Sydney Ground Zero in Interest-Only Mortgage Implosion

Australia’s housing boom is over. A recession is not far away.

It’s “all so bloody predictable” says Australia Macro Business as Western Sydney Ground Zero in Interest-Only Mortgage Bust.

Selling agents are starting to reveal the truth behind recent listings in Sydney’s west with Belle Property Strathfield’s Jimmy Kang saying up to 50 per cent of his clients were asking him to sell their homes in Sydney’s western suburbs because they can no longer afford their new principal-and-interest mortgages.

…A couple asked him to sell a two-bedroom weatherboard home in Veron Street in Wentworthville, 27 kilometres west of Sydney, for $950,000 when it was only worth about between $820,000 and $830,000. They bought the home for $790,000, two years ago.

“I asked them where they got that number from and they said that was the number they need to pay back the $200,000 they borrowed from family to buy the home as well as repay their interest-only loan,” he said.

“A lot of them initially paid $2000 to $2500 a month on their interest-only loans, and now they have to pay $4000.”

Auctions in Western Sydney’s mortgage belt have collapsed. This is exactly what happened in the 2003 Sydney bust. Western Sydney is basically a low income ghetto that occasionally catches the house price bug then is astonished when its paltry income can’t support the prices.

This is going to melt down worse than 2003. Back then it was bailed out by the mining boom, rising rents and wages. As well, other city house prices took off and supported consumption. Today Western Sydney is the epicentre of the mass immigration wages crush and falling rents, and it’s increasingly national.

Correction Just Started

​Home prices are Just Starting to Decline.

…click on the above link to read the rest of the article…

Global Housing Bubble Is Popping. Here Comes The “Reverse Wealth Effect”

Global Housing Bubble Is Popping. Here Comes The “Reverse Wealth Effect”

Just a few months ago, real estate was on fire. Prices were blowing past records set during the previous decade’s housing bubble as desperate buyers bought whatever was available at above the asking price while homeowners, confident that prices would keep rising, held out for the next big pop to sell. Notice on the following chart how the ascent steepens at the beginning of this year.

home prices wealth effect

Then, as if someone flipped a switch, the trend shifted into reverse. Not just in the US but nearly everywhere. This list of recent headlines tells the tale:

Housing demand sees biggest drop in more than 2 years

Hamptons property sales slow as caution spreads to the wealthy

Home Prices Are Falling in One of America’s Richest Suburbs

First Time Ever, More Chinese sellers than buyers

Vancouver Suffers Its Worst July for Home Sales Since 2000

Record Drop in Foreigners Buying U.S. Homes

Australian home prices take biggest dip since 2011

The End of the Global Housing Boom

Manhattan Real Estate: Prices Plummet, Sales Tank

What’s happening and why is it happening now?
Several things came together pretty much simultaneously to turn houses from must-have-at-any-price necessities into completely optional and maybe not even desirable: First, prices rose beyond the reach of all but the seriously affluent. The gap between the price of the average home and the size of the mortgage the average local buyer can afford has been rising for years, but recently in the hottest markets it has become a chasm. Meanwhile, mortgage rates have started to rise, increasing the monthly payment on a given house dramatically.

mortgage rates wealth effect

If you live in San Francisco or Sydney or Vancouver, chances are you can’t afford to buy a decent house – not even close. And if you can’t you don’t.

…click on the above link to read the rest of the article…

A Housing Bubble Pops: Update on Australia

A Housing Bubble Pops: Update on Australia

It is rare that a housing market makes such a beautifully defined U-turn, after a long hard surge.

In Sydney, Australia’s largest housing market and one of the world’s biggest housing bubbles, prices of homes of all types fell 5.4% in July compared to a year ago, and 5.5% from the peak in September. Prices of single-family houses dropped 7.0%, and prices of condos (“units”) fell 1.6%, according to CoreLogic’s Daily Home Value Index:

The most expensive quarter of the market got hit the hardest, with prices down 8.0% in July compared to a year ago. Across the so-called “most affordable quarter of the market” – “least unaffordable” would be more appropriate – prices fell by 1.8%.

And supply in Sydney is starting to come out of the woodwork: Total number of homes listed for sale, based on a rolling 28-day count, jumped 22% from a year ago to 26,103 listings, according to CoreLogic, the most since July 2012.

In the chart below, the number of homes listed for sale in 2018 is denoted with the black line. It’s below only the blue line (2012), but creeping up on it. Note the seasonality, with listings getting pulled during the Christmas holiday period (chart via CoreLogic):

And so goes the rental market, where “conditions eased further in July,” CoreLogic noted in its report: In Sydney rents fell 0.4% year-over-year. While that might not sound like much of an annual decline, it is “the largest decline on record” in CoreLogic’s data going back over a decade.

Melbourne lags a few months behind Sydney but is now catching up. Home prices in Melbourne fell 0.5% in July year-over-year, according to CoreLogic, and are down 3.0% from their peak at the end of November 2017: House prices fell 1.4% from a year ago while condos are still up 2.3%. The index is now back where it had been at the end of June, 2017:

…click on the above link to read the rest of the article…

Spending on Housing Dropped 12% in Canada in June

Spending on Housing Dropped 12% in Canada in June

The national slowdown was particularly unkind to the province of BC.

Canadian housing data continued to disappoint in the month of June. Albeit the year-over-year decline in home sales was not nearly as disappointing as the month of May. National home sales fell 11% year-over-year in June, a slight upgrade from the 16% decline suffered in May.

As sales dipped, so too did the total amount spent on real estate. The total dollar volume dipped 12% year-over-year in June, totaling C$23.5 billion. A tough blow to government tax coffers which have reaped record sums of property tax dollars in recent years.

The national slowdown was particularly unkind to the province of BC where home sales slid 33% year over year, the largest draw-down since June of 2008. Weak buying activity hit Greater Vancouver & Victoria the hardest, sales fell 38% and 30% respectively.

However, the pullback was not exclusive to the province of BC. Other than small year over year gains in Quebec City, Toronto, and Montreal, most major cities were hit with a drop in home sales.

The average sales price across the nation dipped in June for the first time since June of 2012, shedding 1% year over year. While this marked the fifth month in a row in which the national average price was down on a year-over-year basis, it was the smallest decline among them. The Aggregate Composite MLS® HPI was up 0.9% y-o-y in June 2018, marking the 14th consecutive month of decelerating gains. It was also the smallest increase since September 2009.

Despite the rather grim data, the Canadian Real Estate Association remained upbeat, CREA President Barb Sukkau noted, “This year’s new stress-test on mortgage applicants has been weighing on homes sales activity; however, the increase in June suggests its impact may be starting to lift.”

…click on the above link to read the rest of the article…


Canada’s Housing Market- Ready to implode!

Despite what the mortgage companies and loan-sharks tell you: All’s NOT hunky-dory with the Canadian real estate scene. Even the government, at all levels – Federal, Provincial, Municipal – are trying desperately to put on a brave face on the impending market correction. However, the numbers never lie.

Here’s why many analysts believe that Canada is heading for a housing bubble crash that could be much bigger than what our neighbours to the South experienced in 2008-09!

Facts and figures

When Royal Bank of Canada (RBC) pushed out its Housing Affordability indicators for Q4-2017 a short while ago, it indicated that there was some improvement in the average Canadian’s ability to afford a home. This was the first good news in over two years. RBC’s Canada-wide affordability indicator stood at 48.3% in Q4 2017, compared to an average of 39.4% since 1985.

So, what do these facts and figures mean? Well, in simple terms: Higher is bad. Lower is good!

48.3% means that, for the average Canadian household, 48.3% of their household budget will be consumed on home ownership spending. That includes utilities, property taxes (not to mention HST/GST and other taxes) and yes – especially mortgages! Back in 1985, only 39.4% of a household’s income went towards affording a home. To put things in perspective then, Canadian’s spend 48.3 cents, on the average, out of every dollar they earn on housing affordability.

Posing a rhetorical question: “Are we at a turning point for affordability?”, the RBC report offers us this gloomy outlook for Canada’s real estate market:

“No… Rising interest rates will put upward pressure on home ownership costs, and recent policy measures are more likely to reduce household and market risks than provide material affordability relief”

…click on the above link to read the rest of the article…

The Yield Curve Is The Economy’s Canary In A Coal Mine

The Yield Curve Is The Economy’s Canary In A Coal Mine

The economy has hit a wall and is now sliding down it. I don’t care what bullish propaganda may or may not be bubbling up in the headlines from the financial media and Wall Street, the hard numbers I look at everyday show accelerating economic weakness. The fact that my view is contrary to mainstream consensus and political propaganda reinforces my conviction that my view about the economy is correct.

As an example of the ongoing underlying systemic decay and collapse conveyed by this week’s title, it was announced that General Electric would be removed from the Dow Jones Industrial Average index and replaced by Walgreen’s. GE was an original member of the index starting in 1896 and was a continuous member since  1907.

GE is an original equipment manufacturer and industrial product innovator. It’s products are used in broad array of applications at all levels of the economy globally.  It is considered a “GDP company.” GE was iconic of American innovation and economic dominance. Walgreen’s is a consumer products reseller that sells pharmaceuticals and junk. Emblematic of the entire system, GE has suffocated itself with poor management which guided the company into a cess-pool of financial leverage and hidden derivatives.

As expressed in past issues (the Short Seller’s Journal), I don’t put a lot of stock in the regional Fed economic surveys, which are heavily shaded by “hope” and “expectation” metrics that are used to inflate the overall index level. These are so-called “soft” data reports. But now even the “outlook” and “expectations” measurements are falling quickly (see last week’s Philly Fed report). The Trump “hope premium” that inflated the stock market starting in November 2016 has left the building.

…click on the above link to read the rest of the article…

CMHC: 55% Of Toronto And Vancouver Real Estate Buyers Were In A Bidding War

CMHC: 55% Of Toronto And Vancouver Real Estate Buyers Were In A Bidding War

Have you ever woke up after a night of drinking, and only had a vague recollection of what happened? Then your responsible friend sets off a chain of text messages, trying to figure out where you went wrong? Well that’s what the Canadian real estate industry just did, and man-o-man did people screw up. The Canada Mortgage and Housing Corporation (CMHC), the Crown corporation in charge of mortgage liquidity, conducted a massive survey of recent buyers in Toronto, Vancouver, and Montreal. After getting drunk on exuberance, buyers indulged in a little too much borrowing, blaming everything from land scarcity to foreign buyers for the street fights bidding wars they entered.

About The Survey

The CMHC designed a massive survey to try and figure out where buyer exuberance started. Buyers in Toronto and Vancouver saw a quick rise in home prices, and adopted “excessive” expectations of price growth. To determine where the disconnect between fundamentals and price growth started, they took a novel approach – they asked the buyers. 30,000 recent buyers were sent surveys, asking questions ranging from what their budgets were, to why they didn’t stick to their budget.

The majority of price movements were driven by exuberance in Toronto and Vancouver. Yes, fundamentals played a part – but a small part. Instead, the survey focuses on finding out which data points buyers felt drove their FOMO. The fear of being “locked out” is always a powerful motivator, which tends to amplify the read on fundamentals.

Now, issues like foreign buyers are important, and need to be tracked and dealt with. However, no one forced anyone to buy in the small window of exuberance. The homeowner life didn’t choose these buyers, buyers chose the homeowner life.

…click on the above link to read the rest of the article…

Booming Stocks, Booming Home Prices, Booming Risk of Collapse

Booming Stocks, Booming Home Prices, Booming Risk of Collapse

The American Dream of home ownership is once again on its death bed.

Home prices have dramatically increased in price, rising from their 2012 lows by a stunning 75%, with the average median home price now resting at $245,000!

This is up 4.5% over the last year alone, which means prices are increasing and increasing fast.

This has made home ownership essentially unaffordable for many millennial’s who are looking to purchase their first home. This is causing more and more to either return home and live with their parents, or asking them for assistance in purchasing their home.

Profits for many businesses are rising and consumer confidence is way up, recently hitting a thirteen year high,but this has not directly translated into an increases in wages, which continues to stagnate .

This truly is the worst of both worlds for many average working citizens, who are just trying to make ends meet and pay the bills. This is what many in the precious metals community have warned about for years, stagflation.

Sadly, many are completely ignorant to what is unfolding in front of their eyes, and they appear incapable of seeing just how similar this current environment is to that which led to one of the greatest meltdowns in modern history, the 2008 crisis.

Stocks have roared higher, causing valuations to become more and more disconnected from reality, home prices are becoming increasing more unaffordable and wages are stagnating in comparison to inflation. This has the hallmarks of a disaster in the making.

These problems on their own should cause one to take notice and pause in reflection, but this is not it, these are not the only problems that need to be taken into consideration.

…click on the above link to read the rest of the article…

Olduvai IV: Courage
Click on image to read excerpts

Olduvai II: Exodus
Click on image to purchase

Click on image to purchase @ FriesenPress