Home » Posts tagged 'Housing Bubble' (Page 3)

Tag Archives: Housing Bubble

Olduvai
Click on image to purchase

Olduvai III: Catacylsm
Click on image to purchase

Post categories

Post Archives by Category

Update on the Most Splendid Housing Bubbles in the US

Update on the Most Splendid Housing Bubbles in the US

Everything spikes.

Prices of houses and condos across the US surged 6.3% from a year earlier (not seasonally-adjusted), according to the S&P CoreLogic Case-Shiller National Home Price Index for February, released this morning. The index is now 6.7% above the crazy peak of “Housing Bubble 1” in July 2006 just before the hot air hissed out, and 47% above the bottom of “Housing Bust 1”:

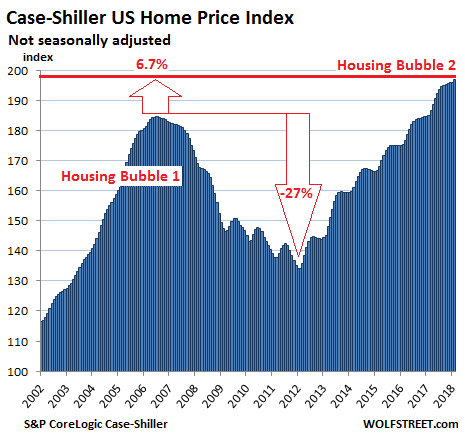
Real estate is local though prices are also impacted by national and global factors — such as monetary policies and offshore investors who consider US housing as an asset class and escape route — as well as by local factors. Together they create local housing bubbles. As local housing bubbles accumulate, even as some housing markets remain in the doldrums, they turn into a national housing bubble, as depicted in the chart above.

The Case-Shiller Index is based on a rolling three-month average; today’s release is for December, January, and February. The index, based on “home price sales pairs,” compares the sales price of a house in the current month to the last transaction of the same house years earlier. The index then incorporates other factors and uses algorithms to arrive at a data point. The index was set at 100 for January 2000; so an index value of 200 means prices as figured by the index have doubled.

So here are the most splendid housing bubbles in major metro areas in the US:

Boston:

The Case-Shiller home price index for the Boston metro jumped 0.7% on a monthly basis, to a new record, after two months of increases that followed three declines in a row, that had followed a 22-month surge during which the index defied not only gravity but also normal seasonal variations. The index is up 5.7% from a  year ago. During Housing Bubble 1, from January 2000 to October 2005, the index had skyrocketed 82% before dropping. It now tops that crazy peak by 13%:

…click on the above link to read the rest of the article…

Toronto’s Epic Housing Bubble Turns to Bust

Toronto’s Epic Housing Bubble Turns to Bust

Prices of detached houses plunge C$207,000 from a year ago as sales collapse.

After having ballooned for 18 years with barely a dip during the Financial Crisis, Toronto’s housing market, Canada’s largest, and among the most inflated in the world, is heading south with a vengeance, both in terms of sales volume and prices, particularly at the high end.

Home sales in the Greater Toronto Area (GTA) plunged 39.5% in March compared to a year ago, to 7,228 homes, according to the Toronto Real Estate Board (TREB), the local real estate lobbying group. This was spread across all types of homes, even the formerly red-hot condo sector:

  • Detached houses -46.3%
  • Semi-detached houses -30.6%
  • Townhouses -34.2%
  • Condos -32.7%.

While new listings of homes for sale fell 12.4% year-over-year, at 14,866, they’d surged 41% from the prior month, and added to the listings of homes already on the market. The total number of active listings – new listings plus the listings from prior months that hadn’t sold or been pulled without having sold – more than doubled year-over-year to 15,971 homes, and were up 20% from February.

At the current sales rate, total listings pencil out to a supply of 2.1 months. The average days-on-the-market before the home is sold or the listing is pulled without having sold doubled year-over-year to 20 days. Both data points show that the market is cooling from its red-hot phase, that potential sellers aren’t panicking just yet, and that potential buyers are taking their time and getting more reluctant, or losing their appetite altogether, with the fear of missing out (FOMO) having evaporated.

Sales volume has been plunging for months while listings of homes for sale have also surged for months. Prices follow volume, and prices have been backing off, but in February they actually fell on a year-over-year basis, the first since the Financial Crisis, and in March, they fell more steeply. This is what the report called a “change in market conditions.”

…click on the above link to read the rest of the article…

Australia’s Housing Bubble Finally Popped?

Australia’s mining towns are getting crushed. Not even Sydney is immune.

Perth Investors Fear the Worst

West Australia property investors are suffer as the mining slump lingers. Nearly One-Third Losing Money on Resale.

A report from property research firm CoreLogic shows one-third of investors in Perth property lost money on resale in the December quarter.

The figure of 33.6 per cent was equal with Darwin as the highest proportion of loss-making resales nationally.

In regional WA, the situation was even worse — 47.5 per cent of resales by investors made a loss in the quarter.

80% of Gladstone Homes Sell at Loss

Five years ago, investors from all over Australia scrambled to snap up a property in Gladstone. Today, you have to pay to get out. More than 80 Percent of Gladstone Homes Sell at a Loss.

SITTING at the southern tip of the Great Barrier Reef, and famed for being one of the nation’s industrial powerhouses, is the central Queensland city of Gladstone.

Four decades ago, Gladstone was a tiny port town best known for its fishing industry and boasting easy access to the southern reaches of the reef.

A decision to build a liquefied natural gas plant was made — encouraging thousands of construction workers to fly into the already prosperous town in an attempt to score a piece of the plant pie. By 2012, the LNG plant was built, the construction workers were getting laid off and the city started to experience a severe downturn. Six years later and things are no better.

In the last December quarter, more than 80 per cent of Gladstone homes sold at a loss, according to new data released by CoreLogic. That rate is the highest in Queensland and second highest in Australia, based on the average home price more than halving in the past five years.

…click on the above link to read the rest of the article…

Loonie Spikes As Canadian Consumer Prices Surge

Oh, Canada… growth is stagnating, housing bubbles imploding, and now inflation is surging

Canadian Consumer prices surge 2.2% YoY (well above expectations of +1.9% and January’s +1.7% YoY)

Core prices – which exclude more volatile items like energy and are considered a gauge of inflation pressures – inched higher for a fifth month to 2.03 percent, which is the fastest since 2012.

Statistics Canada cited higher prices for gasoline, cars, and mortgage interest costs as main contributors to annual inflation. The minimum wage increases in Ontario also seem to have had an impact, with food purchased from restaurants pushing up nationwide prices by 4 percent from a year ago.

Faster-than-expected inflation could add pressure on the Bank of Canada – which has kept the expansion going with low interest rates – to keep hiking borrowing costs to more normal levels.

And the Loonie is surging…


Real Estate Bubbles: These 8 Global Cities Are At Risk

If you had $1 billion to spend on safe real estate assets, where would you look to buy?

For many funds, financial institutions, and wealthy individuals, the perception is that the world’s financial centers are the places to be. After all, world-class cities like New York, London, and Hong Kong will never go out of style, and their extremely robust and high-density city centers limit the supply of quality assets to buy.

But, as Visual Capitalist’s Jeff Desjardins asks, what happens when too many people pile into a “safe” asset?

According to UBS, certain cities have seen prices rise at rates that are potentially not sustainable – and eight of these financial centers are at risk of having real estate bubbles that could eventually deflate.

Global Real Estate Bubble Index

Every year, UBS publishes the Global Real Estate Bubble Index, and the most recent edition shows several key markets in bubble territory.

The bank highlights Toronto as the biggest potential bubble risk, noting that real prices have doubled over 13 years, while real rents and real income have only increased 5% and 10% respectively.

However, the largest city in Canada was certainly not the only global financial center with real estate appreciating at rapid rates in the last year.

In Munich, Toronto, Amsterdam, Sydney and Hong Kong, prices rose more than 10% in the last year alone.

Annual increases at a 10% clip would lead to the doubling of prices every seven years, something the bank says is unsustainable.

In the last year, there were three key markets where prices did not rise: London, Milan, and Singapore.

London is particularly notable, since it holds more millionaires than any other city in the world and is rated as the #1 financial center globally.

Rate Squeeze in Vancouver & Toronto Housing Bubbles

Rate Squeeze in Vancouver & Toronto Housing Bubbles

Variable-rate mortgages, the HELOC phenomenon, and new stress tests meet higher rates.

The Bank of Canada raised interest rates another 25 basis points last week. It was the third time in the past six months. Rates have more than doubled in that time, going from 0.50% to 1.25%. This hike was baked into the economic data, and now it’s getting baked into the debt loads of Canadian households.

Following the announcement, Canadian banks hiked their prime lending rateby an equivalent 25 basis points. The prime lending rate is the annual interest rate Canada’s major banks use to set interest rates on variable-rate loans, lines of credit, variable-rate mortgages, and HELOCs (Home Equity Lines of credit).

This means nearly instantly higher interest payments for borrowers carrying variable-rate mortgages, HELOCs, and lines of credit.

This is critically important, considering the context of the current situation. Interest rates have been at historically low emergency levels since the Financial Crisis. This has allowed households to absorb elevated house prices and a record amount of debt. Each rate hike reduces the ability to service that debt.

Given the current size of the mortgages, for Vancouver households, a 1% rate increase in their variable mortgage rate would require an additional 9.2% of their income to make the payment, according to Better Dwelling, and for households in Toronto, it would require an additional 8.3% of their household income. In Montreal, it would require an additional 3.2% of their household income:

Further, the newly required stress tests for variable-rate mortgages require that applicants qualify at the minimum specified rate of the stress test, which just jumped from 4.99% to 5.14%, or at the actual rate they’re borrowing at PLUS 2%, whichever is greater.

…click on the above link to read the rest of the article…

Australian Banks – First The Housing Bubble Bursts, Now A Public Inquiry

Australian Banks – First The Housing Bubble Bursts, Now A Public Inquiry

We keep returning to the subject of Australia and the growing signs that its bubble economy is bursting. Earlier this month, we discussedhow the world’s longest-running bull market – 55 years – in Australian house prices appears to have come to an end. We followed this up with “Why Australia’s Economy Is A House Of Cards” in which Matt Barrie and Craig Tindale described how Australia’s three decades long economic expansion had mostly been the result of “dumb luck”.

As a whole, the Australian economy has grown through a property bubble inflating on top of a mining bubble, built on top of a commodities bubble, driven by a China bubble.

Last week, in “The Party’s Over For Australia’s $5.6 Trillion Housing Market Frenzy”, we highlighted some scary metrics for Australia’s housing bubble – notably how the value of Australian housing is more than four times gross domestic product – higher than other nations with housing bubbles, e.g. New Zealand, the UK and Canada. Two days ago, we noted the number of Australians optimistic about the year ahead had plunged to a record low.

Moving on to the nation’s banks, while Australian households are the second most indebted in the world, its banks are the most exposed to housing debt…

…which doesn’t augur well if, as we expect, the housing bubble deflates. We pointed out that an additional risk for Australia’s banking sector, which certainly wouldn’t help the property market either, was the growing demand for a public inquiry. This follows a series of scandals relating to misleading financial advice, attempted rate-rigging, fee gouging and alleged breaches of anti-money laundering laws. According to Australia’s ABC News.

…click on the above link to read the rest of the article…

Sweden: The World’s Biggest Housing Bubble Cracks

Sweden: The World’s Biggest Housing Bubble Cracks

Sweden’s property bubble is probably the world’s biggest, despite which it gets relatively little coverage in the mainstream financial media – although that might be about to change. Warnings about this bubble are not new. In March 2016, Moody’s issued a very explicit warning that Sweden’s negative interest rates were propagating an unsustainable housing bubble.

The central banks of Switzerland, Denmark and Sweden (all rated Aaa stable) have been among the first to push policy rates into negative territory. A year into this novel experience, Moody’s Investors Service concludes that, from among the three countries, Sweden is most at risk of an – ultimately unsustainable – asset bubble…

“The Riksbank has not been successful in engineering higher inflation, while Sweden’s GDP growth continues to be among the strongest in the advanced economies,” says Kathrin Muehlbronner, a Senior Vice President at Moody’s.

“At the same time, the unintended consequences of the ultra-loose monetary policy are becoming increasingly apparent – in the form of rapidly rising house prices and persistently strong growth in mortgage credit”, adds Ms Muehlbronner. In Moody’s view, these trends will likely continue as interest rates will remain low, raising the risk of a house price bubble, with potentially adverse effects on financial stability as and when house prices reverse trends.

In October 2016, the Riksbank’s Governor, Stefan Ingves, spoke in grave terms to the FT about the impact of negative rates on house prices.

But despite a lack of drama so far, Mr Ingves remains worried about a bad ending due to risks over financial stability.

He said: “It remains an issue because we are mismanaging our housing market. Our housing market isn’t under control, in my view.” The ratio of household debt to disposable income in Sweden is one of the highest in the world at more than 180 per cent and the Riksbank estimates it will continue to rise in the coming years.

…click on the above link to read the rest of the article…

The Unbearable Slowness of Fourth Turnings

THE UNBEARABLE SLOWNESS OF FOURTH TURNINGS

“The next Fourth Turning is due to begin shortly after the new millennium, midway through the Oh-Oh decade. Around the year 2005, a sudden spark will catalyze a Crisis mood. Remnants of the old social order will disintegrate. Political and economic trust will implode. Real hardship will beset the land, with severe distress that could involve questions of class, race, nation and empire. The very survival of the nation will feel at stake. Sometime before the year 2025, America will pass through a great gate in history, commensurate with the American Revolution, Civil War, and twin emergencies of the Great Depression and World War II.” – Strauss & Howe The Fourth Turning 

This Fourth Turning was ignited suddenly in September 2008 as the housing bubble, created by the Federal Reserve and their criminal puppeteer owners on Wall Street, collapsed, revealing the greatest control fraud in world history. A crisis mood was catalyzed as the stock market dropped 50%, unemployment surged to highs not seen since 1981, foreclosures exploded, and captured politicians bailed out the criminal bankers with the tax dollars of the victims.

The mood of the country darkened immediately as average Americans flooded their congressmen’s websites and phone lines with a demand not to bailout the felonious Wall Street banks with $700 billion of TARP. But they ignored their supposed constituents and revealed who they are truly beholden to.

Trust in the political and financial system disintegrated and has further deteriorated as the ruling elite continue to loot and pillage as if the 2008/2009 global financial meltdown never happened. From the perspective of the archaic social order there is no longer a crisis. The recovery narrative, flogged ceaselessly by the crooked establishment and their propaganda fake news corporate media mouthpieces, has convinced millions of willfully ignorant Americans progress is occurring.

…click on the above link to read the rest of the article…

Unprecedented Housing Bailout Revealed, As China Property Sales Drop For First Time In 30 Months

Unprecedented Housing Bailout Revealed, As China Property Sales Drop For First Time In 30 Months 

Back in March, we explained why the “fate of the world economy is in the hands of China’s housing bubble.” The answer was simple: for the Chinese population, and growing middle class, to keep spending vibrant and borrowing elevated, it had to feel comfortable and confident that its wealth will keep rising. However, unlike the US where the stock market is the ultimate barometer of the confidence boosting “wealth effect”, in China it has always been about housing: three quarters of Chinese household assets are parked in real estate, compared to only 28% in the US with the remainder invested financial assets.

Beijing knows this, of course, which is why China periodically and consistently reflates its housing bubble, hoping that the popping of the bubble, which happened in late 2011 and again in 2014, will be a controlled, “smooth landing” process. 

The other reason why China is so eager to keep its housing sector inflated – and risk bursting bubbles – is that as shown in the chart below, in 2016 the rise of property prices boosted household wealth in 37 tier 1 and tier 2 cities by RMB24 trillion, almost twice the total local disposable income of RMB12.9 trillion. For any Fed readers out there, that’s how you create a wealth effect, fake as it may be. 

Unfortunately for China, whose record credit creation in 2017, and certainly in the months leading up to the 19th Chinese Communist Party Congress which started last week, has been the primary catalyst for the “global coordinated growth”, the good times are now again over, and according to the latest real estate data released last week, property sales in China dropped for the first time since March 2015, or more than two-and-half years, in September and housing starts slowed sharply reinforcing concerns that robust growth in the world’s second-largest economy is starting to cool.

…click on the above link to read the rest of the article…

Update on the Deflating Housing Bubble in Toronto

Update on the Deflating Housing Bubble in Toronto

Missing Chinese money? Hardest hit is the priciest segment: detached houses.

Home sales in the Greater Toronto Area plunged 35% in September compared to a year ago, to 6,379 homes. The plunge in volume was spread across all types of homes. Even condos got hit:

  • Detached houses -40.4%
  • Semi-detached houses -30.2%
  • Townhouses -34.4%
  • Condos -27.5%.

As total sales plunged, new listings of homes for sale rose 9% year-over-year to 16,469, according to the Toronto Real Estate Board (TREB). And the total number of active listings of homes for sale soared 69% year-over-year to 19,021.

While Toronto’s housing market is still not drowning in listings, the plunge in sales volume and the surge in listings combined is a major change in market direction. And prices have followed.

The report tried to brim with industry hope: “The improvement in listings in September compared to a year earlier suggests that home owners are anticipating an uptick in sales activity as we move through the fall,” And it grabbed at straws: “Consumer polling undertaken for TREB in the spring suggested that buying intentions over the next year remain strong.”

Alas, “in the spring” – precisely in April – Toronto’s housing bubble peaked with a final and phenomenal melt-up of home prices: The average price had soared 30%  year-over-year to C$920,761! And the mood of the housing market was at its most buoyant.

So how did the plunge in volume and the surge in listings impact prices?

The average price of all homes in the Greater Toronto Area, at C$775,546 in September, is down 16% from the crazy peak in April. Year over year, the average price is now up only 2.6%.

That’s a lot of backpedaling from a 30% year-over-year increase in April. To cool the housing market euphoria – and the risk it poses to lenders and homeowners – and to put a lid on ballooning affordability issues, the Ontario government introduced a laundry list of measures on April 20, including a 15% transfer tax on nonresident foreign speculators.

…click on the above link to read the rest of the article…

Housing Bubble Symmetry: Look Out Below

Housing Bubble Symmetry: Look Out Below

Housing markets are one itsy-bitsy recession away from a collapse in domestic and foreign demand by marginal buyers.

There are two attractive delusions that are ever-present in financial markets: One is this time it’s different, because of unique conditions that have never ever manifested before in the history of the world, and the second is there are no cycles, they are illusions created by cherry-picked data; furthermore, markets are now completely controlled by central banks so cycles have vanished.

While it’s easy to see why these delusions are attractive, let’s take a look at a widely used measure of the U.S. housing market, the Case-Shiller Index:

If we look at this chart with fresh eyes, a few things pop out:

1. The U.S. housing market had a this time it’s different experience in the 2000s, as an unprecedented housing bubble inflated, pushing housing far above the trendline of the Case-Shiller National Home Price Index.

2. It turned out this time wasn’t different as this extreme of over-valuation collapsed.

3. For a variety of reasons (massive central bank and state intervention, the socialization of the mortgage market via federally guaranteed mortgages, historically low mortgage rates, massive purchases of mortgage backed securities by the Federal Reserve, etc.), the collapse in prices did not return to the trendline.

4. There is a remarkable time symmetry in each phase of expansion and collapse; each phase took roughly the same period of time to travel from trough to peak and peak to trough.

5. The Index has now exceeded the previous bubble peak, suggesting this time it’s different once again dominates the zeitgeist.

…click on the above link to read the rest of the article…

Toronto Home Price Bubble Descends into Bear Market

Toronto Home Price Bubble Descends into Bear Market

With surprise rate hike, Bank of Canada turns against housing market.

Home sales in the Greater Toronto Area, the largest housing market in Canada, plunged 34.8% in August compared to a year ago, to 6,357 homes, with sales of detached homes and semi-detached homes getting eviscerated:

Sales by type:

  • Detached houses -41.6%
  • Semi-detached houses -37.3%
  • Townhouses -27.5%:
  • Condos -28.0%.

Even as total sales plunged, the number of active listings of homes for sale soared 65% year-over-year to 16,419, with 11,523 new listings added in August, according to the Toronto Real Estate Board (TREB).

“The relationship between sales [plunging] and listings in the marketplace today [soaring] suggests a balanced market,” the report explained, adding hopefully:

“If current conditions are sustained over the coming months, we would expect to see year-over-year price growth normalize slightly above the rate of inflation. However, if some buyers move from the sidelines back into the marketplace, as TREB consumer research suggests may happen, an acceleration in price growth could result if listings remain at current levels.”

And the average price of all homes, at C$732,292 in August, plunged 20.5% from the crazy peak in April (C$920,761). By this measure, it has now entered a bear market.

The average price in April had shot up 30% year-over-year. To cool this nutty business, the Ontario government introduced a laundry list of measures on April 20. It included most prominently a 15% transfer tax on nonresident foreign speculators. That appears to have done the trick.

Given the enormous price gains in recent years, the market remains hyper-inflated, and the four-month downturn into a bear market hasn’t even brought prices back to the year-ago level, with the average price for all types of housing up 3%, and the condo price up 21.4% year-over-year.

…click on the above link to read the rest of the article…

Next Brick to Drop on UK Economy: Housing Bubble Deflates

Next Brick to Drop on UK Economy: Housing Bubble Deflates

London home prices are already tanking, as demand sags.

The symbiotic sectors of construction and real estate have been a vital engine of economic growth in the United Kingdom for decades, but that could be about to come to an end. In the words of Paul Smith, the chief executive of the UK’s largest independent lettings and real estate agency, Haart, “unaffordability in the UK’s property market is now reaching crisis point.” If drastic measures are not taken to tame prices, the UK could lose its place as a property owning democracy, he warns.

The latest figures published by the Office for National Statistics (ONS) reveal that the average cost of a home jumped by £10,000 in June from a year earlier, to £223,000. In the last eight years prices have surged by almost 50%. Its National House Price Index is now 18% higher than during the peak of the prior housing bubble (September 2007). This chart is for the UK overall. But home prices in London have now turned the other way.

Demand is already sagging. In the first six months of 2017 alone, first-time buyer registrations dropped by almost 20% across Haart branches. It seems that a trend that began in London is now going nationwide.

For well over a decade soaring property prices have priced most Londoners out of the market. The number of homeowners in London in the 25 to 29 age bracket has dropped more than 50% since 1990. Foreign buyers have virtually cornered the market, acquiring as much as three-quarters of all new-build housing in the capital in recent years.

…click on the above link to read the rest of the article…

Dear Fed, It’s Not “Really Hard to Spot Bubbles”

Dear Fed, It’s Not “Really Hard to Spot Bubbles”

Here are some visual aids to help the Fed spot the housing bubble.

Minneapolis Fed President Neel Kashkari was the latest Fed official to claim in an essay – thus following in the time-honored footsteps of former Fed Chair Ben Bernanke – that “spotting bubbles is hard,” that the Fed cannot see them, and that if it could see them, it shouldn’t do anything to stop them because it had only “limited policy tools,” and because “the costs of making policy mistakes can be very high.”

But it’s OK to use these “limited policy tools” to inflate the greatest bubbles the world has ever seen and then preside over the damage they cause to the real economy before they even implode.

Neither Kashkari nor anyone else working at the Treasury Department in 2006 – when they were tasked by Secretary of the Treasury Hank Paulson to look for signs of trouble because they were “due for some form of crisis,” as he writes – could see any bubbles, not even the housing bubble although it was already beginning to deflate.

“It is really hard to spot bubbles with any confidence before they burst,” Kashkari writes, specifically naming stock prices and house prices. “Everyone can recognize a bubble after it bursts, and then many people convince themselves that they saw it on the way up.”

So here are some visual aids I put together for Kashkari and other Fed governors. It will help them “spot” the beautiful housing bubbles in the US – because bubbles really aren’t hard to recognize before they burst, if you want to recognize them.

What’s hard to predict accurately is when they’ll burst.

…click on the above link to read the rest of the article…


Olduvai IV: Courage
Click on image to read excerpts

Olduvai II: Exodus
Click on image to purchase

Click on image to purchase @ FriesenPress