Home » Posts tagged 'craig hemke'

Tag Archives: craig hemke

Olduvai
Click on image to purchase

Olduvai III: Catacylsm
Click on image to purchase

Post categories

Post Archives by Category

Fed Prints Money or the Whole Thing Blows Up-Craig Hemke

Fed Prints Money or the Whole Thing Blows Up-Craig Hemke

By Greg Hunter’s USAWatchdog.com (Saturday Night Post)

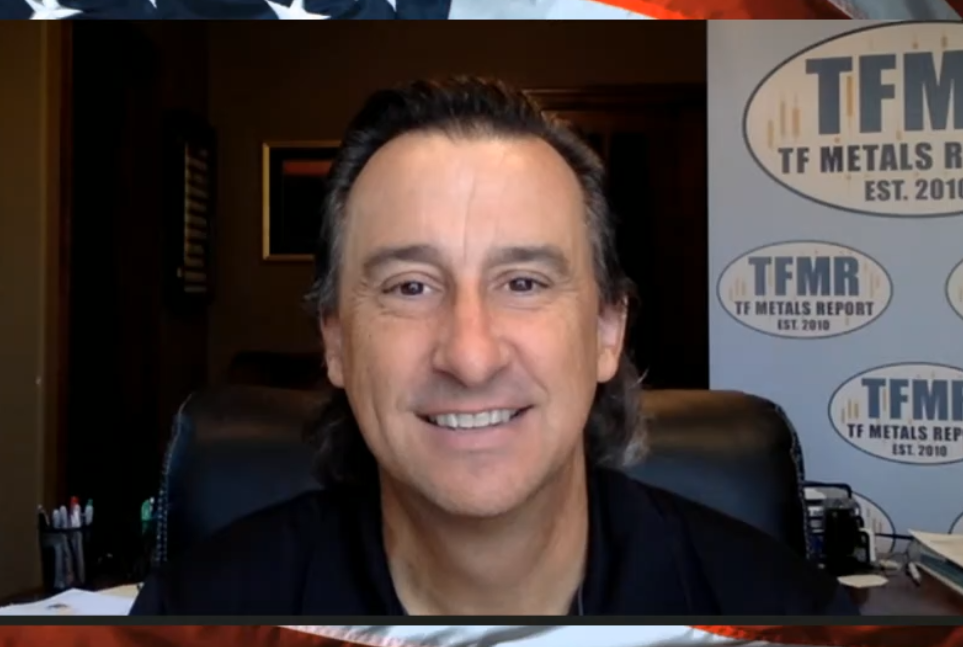
Financial writer, market analyst and precious metals expert Craig Hemke says the Fed has all but said it was going to delay the so-called “taper” of easy money policies–forever.  This is why gold and silver spiked as the dollar tanked on Friday.  Hemke contends, “The Chinese, four months in a row, have been net sellers of Treasuries. . . . They’re not buying them.  Well, somebody has got to buy.  Congress just announced this week that they came to a deal where they are going to spend $4.1 trillion on what is allegedly called infrastructure. . . . The money has got to come from somewhere. There is this notion that they are just going to raise taxes on rich people.  Rich people are just going to change how they spend and do their taxes.  Who is going to loan us money?  It’s not going to be the Chinese or other foreign countries because they don’t have confidence in us anymore.  So, the money is going to come from somewhere.  Of course, the Fed is going to keep monetizing the debt because if they don’t, interest rates have got to rise to a point people are willing to loan it to the U.S.  If interest rates go to 3% or 5%, the whole thing blows up.”

Hemke points out, “All we can do is prepare for a time when this finally implodes because it will.  Confidence will eventually collapse.  Confidence is like Hemmingway’s explanation of how he went bankrupt.  He was asked, ‘How did you go broke?’  He said, ‘At first slowly, and then, all at once.’…

…click on the above link to read the rest of the article…

When “Unallocated” Becomes Unavailable

For the past ten years, we’ve railed against the Bullion Bank fractional reserve and digital derivative pricing scheme. The solution has always been the removal of physical metal from the hands of the Banks and the Mints. Are we finally making some progress?

Before we begin, it is crucial that you understand this basic point: The globally recognized prices of gold and silver are not determined through the exchange of actual physical metal. Price is instead determined by the exchange of derivative contracts. Thus, the supply and demand of physical metal has very little day-to-day bearing on the derivative price. Instead, it is the supply and demand of the derivative itself that determines price.

About four years ago, I wrote the article linked below with the purpose of explaining, in as simple terms as possible, how and why this digital derivative pricing scheme benefits The Bullion Banks that have monopolistic control of these “markets”. If you’ve never read this post, please do so now:

The key pillars in maintaining this fraudulent pricing scheme are the market activities in New York and London. The CME-owned COMEX and the LBMA collective work together to manage price and the flow of physical metal that is needed to legitimize it. To understand this hand-in-glove approach, consider that Michael Nowak—the recently indicted former head of global precious metals trading for JPMorgan—also sat on the board of directors of the LBMA:

For precious metal investors everywhere, it is vital that we one day force this pricing scheme to collapse. Since The Scheme is built upon leverage and hypothecation, the only way we can win this fight is if we can force a deleverage of the fractional reserve system…

…click on the above link to read the rest of the article…


Real Gold vs Pretend Gold

Real Gold vs Pretend Gold

Real Gold vs Pretend Gold - Craig Hemke (14/01/2020)

The battle continued in 2019, and rarely has the disparity been this sharp.

And what do we mean?

Well, on one hand, you have real physical gold. This is gold that you store yourself or at a trusted vaulting company. This is gold that you can actually hold in your hands. This is the gold that is demanded at record levels by central banks around the globe.

On the other hand, we have pretend gold. This is the domain of the bullion banks. They offer futures contracts, unallocated accounts, and ETFs…all as an alternative to the real thing and as a way of increasing the total supply of “gold” in what amounts to a modern day alchemy.

What’s astonishing is that the investment world allows a physical price to be determined through the trading of the pretend alternative. More on that in a minute. But first, let’s look at two data points that stand in stark contrast to each other.

First, there’s demand for the real thing: physical gold. One great story in 2019 was how the Polish central bank purchased—and then demanded immediate delivery of—about 100 metric tonnes of physical gold. The Poles are no dummies, and they apparently wanted no part of the unallocated promises from the LBMA: https://www.bloomberg.com/news/articles/2019-11-25…

In total, it appears that reported central bank demand for gold will exceed 670 metric tonnes in 2019. This follows what was a 50-year record demand of 641 metric tonnes in 2018. This from the World Gold Council at the end of Q32019: https://www.gold.org/goldhub/research/gold-demand-…

So, as price rose by 18% in 2019, a logical conclusion would be that this was due to strong physical demand. And that conclusion would be mostly correct. This is Econ 101. Surging demand often leads to higher prices, and the central banks alone soaked up nearly 25% of global gold production in 2019.

…click on the above link to read the rest of the article…

Ask the Expert – Nomi Prins – October 2019

Ask the Expert – Nomi Prins – October 2019

Ask the Expert - Nomi Prins - October 2019

Bestselling author Nomi Prins is an American author, journalist, and public speaker. A former managing director at Goldman Sachs and senior managing director at Bear Stearns, her latest book is Collusion: How Central Bankers Rigged the World. Her previous book All the Presidents’ Bankers explored over a century of close relationships between 19 Presidents from Teddy Roosevelt through Barack Obama and the key bankers of their day, based on original archival documents. Prins also received recognition for her whistleblower book, It Takes a Pillage: Behind the Bonuses, Bailouts, and Backroom Deals from Washington to Wall Street , for her views on the U.S. economy, for her published spending figures on federal programs and initiatives related to the 2008 bailout, and for her advocacy for the reinstatement of the Glass–Steagall Act and regulatory reform of the financial industry.

This month, Nomi answers seven of your listener-submitted questions, including:

• When will the U.S. dollar end its reign as global reserve currency?

•  Should you be concerned about gold confiscation?

  • Plus: If the financial system crashes, are you at risk?

Central Banks Begin to Panic

Central Banks Begin to Panic

Central Banks Begin to Panic - Craig Hemke (22/10/2019)

After rapidly reversing policy in 2019, does it seem to you that the global central banks have moved into full panic mode over the past several weeks? To that point, consider some of the headlines that have appeared over just the past few days.

Let’s start with Count Draghi and his insistence that the ECB restart their QE programs as soon as possible. Beginning next month, the ECB will begin regular purchases of up to €20B in bonds each month.

•  https://www.ft.com/content/de4a958a-eab3-11e9-a240…

Not to be outdone, the U.S. Fed went from “neutral” to “Large Scale Asset Purchase Program” in less than four weeks with the announcement on October 11 of a new $60B/month debt monetization program. The Fed also announced that their liquidity-providing repo facilities will remain open through January of 2020, at a minimum.

•  https://www.cnn.com/2019/10/11/investing/fed-qe-po…

So what is prompting this quick reversal in monetary policy? Is it simply the worsening global economy, or is something darker lurking in the shadows? As I type, it’s Tuesday morning, October 22, and here is a collection of headlines from just the past week.

First, here’s the Secretary General of the UN—a largely symbolic, international diplomatic post—urging global central bankers, the IMF, and World Bank to “do everything possible” in order to stave off a potential crisis: https://www.zerohedge.com/economics/central-banks-…

Next, the consulting firm McKinsey & Co. is out with a new report that concludes that more than half of the world’s banks may not be strong enough to maintain economic viability in the next crisis(a crisis which is inevitable, I might add ). Remember, the central banks are owned by and serve their own member banks. If the majority of the world’s banks are in financial trouble, then it’s understandable that the majority of the world’s central banks would be quite nervous:https://www.bloomberg.com/news/articles/2019-10-21…

 …click on the above link to read the rest of the article…

The Same Old COMEX Games

The Same Old COMEX Games- Craig Hemke (31/10/2018)
A small move in price enables The Banks to lay the shorts right back on.

Just three weeks ago, we warned you to ignore newsletter pundits who were claiming that one day soon, The Banks that operate on the COMEX will be long and on the side of the regular investor/stacker. As with all nonsense, this sentiment ignores reality. Before reading further, I urge you to read this post from October 9: https://www.sprottmoney.com/Blog/the-banks-are-not…

October 9 was a Tuesday, and that’s pretty handy because all of the CFTC’s Commitment of Traders surveys are taken after the COMEX close on Tuesdays. Back on October 9, the price of COMEX gold closed at $1191. The CoT survey taken that day was reported on Friday, October 12. And what did it show? Check the handy spreadsheet below from Goldseek.

As you can see, on October 9 the positions were summarized as follows:

The Large Speculators (primarily hedge funds, managed money, trading funds) NET SHORT 38,175 contracts. This was a new ALL-TIME HIGH NET SHORT position for this category.

The Commercials (primarily Big Banks like JPM, HSBC, MS, etc.) NET LONG 25,866 contracts . This was a new ALL-TIME HIGH NET LONG position for this category.

On the disaggregated report, the sub-category “Managed Money” was historically NET SHORT 109,544 contracts, as you can see below.

Fast-forward two weeks to Tuesday, October 23. The price of COMEX gold had risen $45 to $1236 and another CoT survey was taken. This report was released last Friday, the 26th, and it is shown below.

So, on a price move of less than 4%, it’s quite clear that The Banks have revealed themselves as NOT “on your side”. Not now, not ever. The positions on this most recent report can be summarized as:

…click on the above link to read the rest of the article…

What Do The Banks Know? 

What Do The Banks Know? - Craig Hemke (21/08/2018)

Much is being made of the current makeup of the Commitment of Traders report for Comex gold. However, similar historical irregularities are appearing in other assets, too. Thus the question, are The Banks setting the stage for a wildly volatile second half of 2018?

First, an update on the Commitment of Traders report for Comex gold. For the survey week ended Tuesday, August 14, more astonishing changes appeared within the general CoT structure:

  • The Large Speculator (hedge funds, managed money, trading funds) NET position is now SHORT 3,688 contracts. This is the first reported NET short position for this group since December of 2001.
  • The Large Speculator GROSS short position is 215,467 contracts. This is a new ALLTIME high.
  • The Commercial (Big Bank) NET short position is just 7,350 contracts. This is the smallest Commercial NET position since the CoT report surveyed on December 1, 2015.
  • The Commercial GROSS short position of 171,545 contracts is the smallest since the survey of January 5, 2016.
  • The Large Speculators are now GROSS short 43,922 contracts more than The Commercials. This is a new ALLTIME record.

And consider this, too. That 215,467 contract GROSS short position for the Large Speculators is truly an unbacked position. This group has no metal to deliver, nor do they contract with miners for future delivery. Instead, they are simply speculating on the future direction of the Comex derivative price. As a reminder, each Comex contract was originally designed to represent the potential obligation to take or make delivery of 100 ounces of gold. Thus, with a GROSS position of 215,467 contracts, the Large Speculator category is short 21,546,700 ounces or about 670 metric tonnes.

…click on the above link to read the rest of the article…

Has The PBOC Taken Control of The Gold “Market”?

Has The PBOC Taken Control of The Gold "Market"? - Craig Hemke (10/07/2018)

The evidence is mounting, and we invite you to consider the implications.

First, a few items of background information. Perhaps these are unrelated, perhaps they are not.

Fast forward to the summer of 2018. Two weeks ago, our fellow columnist here at Sprott Money, David Brady, wrote an insightful piece regarding a new correlation for the global gold price—the USDCNY—which is the exchange rate of US$ to Chinese yuan. Though the PBOC maintains a “peg” for this rate, the rate is allowed to fluctuate if the PBOC deems it necessary. Before we go on, I urge you to read David’s column: https://www.sprottmoney.com/Blog/gold-the-chinese-…

Now consider this. Since the PBOC began to actively devalue the yuan versus the dollar four weeks ago, the price of COMEX gold has tracked the yuan nearly tick-for tick. This is clearly shown on the chart below. We’ve taken the USDCNY and inverted it to CNYUSD. This is shown in candlesticks. The price of the Aug18 COMEX gold is represented as a blue line.

…click on the above link to read the rest of the article…

The Volcano of Debt

The Volcano of Debt - Craig Hemke (11/06/2018)

Just as gravity propels the lava from Kilauea inexorably toward the sea, a mountain of public and private debt looms over today’s markets.

Earlier this week, the Boards of Trustees for both U.S. Social Security and Medicare released their latest updates on the “solvency” of the programs. The advisories can be read here:https://www.ssa.gov/oact/TRSUM/index.html

Though it’s common knowledge that these programs are vastly underfunded, the degree to which the pending crisis is accelerating should come as a shock to all Americans.

In their report, the Trustees state that the “Social Security Trust Fund” will be exhausted in 2034. Though this retirement income program is already running on fumes due to simple demographics— and the notion of a “trust fund” is really nothing more than an accounting trick

The report that it will be insolvent in just fifteen years should come as a cold slap to the face for anyone still clinging to the belief that the funding problems plaguing this income redistribution program can be put off indefinitely. From the report:

“Social Securitys total cost is projected to exceed its total income (including interest) in 2018 for the first time since 1982, and to remain higher throughout the projection period. Social Security s cost will be financed with a combination of non-interest income, interest income, and net redemptions of trust fund asset reserves from the General Fund of the Treasury until 2034 when the OASDI reserves will be depleted.”

Even worse was the report from the Trustees of the Medicare program. Sharply rising healthcare costs and the increase in program participation due to aging Baby Boomers led the Trustees to project insolvency as soon as 2026. That’s just eight years from now! Also from the report:

…click on the above link to read the rest of the article…

Ask The Expert- James Grant

Ask The Expert- James Grant

James Grant is an author, columnist, and founder of Grant’s Interest Rate Observer. A frequent guest on business television, including CNBC, Fox Business News and a ten-year stint on “Wall Street Week”, Jim’s writing has appeared in the Wall Street Journal, Foreign Affairs, and The Financial Times. An inductee into the Fixed Income Analysts Society Hall of Fame, Mr. Grant is also a member of the Council on Foreign Relations and a trustee of the New-York Historical Society.

We are thrilled to have him answer seven of your burning questions, including:

  • Will the Fed continue hiking the Fed Funds rate?
  • Can we expect a surge in inflation soon?
  • What factors will lead to a stock market correction?

Get the answers to these questions, plus James’ forecast for gold prices, by listening here:

Listen to Ask The Expert on SoundCloud:

“In the long run, owning gold and silver is going to be, by far, the smartest thing one could have done.”

“In the long run, owning gold and silver is going to be, by far, the smartest thing one could have done.”


It’s Friday the 13th, and after an almost perfect week, things are looking bumpy again. Eric stops by to calm our frazzled nerves on this, the unluckiest day.

In this chat you’ll hear:

  • Why you shouldn’t rely on fiat currencies
  • Eric’s thoughts on price suppression in the precious metals space
  • His top picks for mining companies to look into

“We are seeing people throughout the world buying more physical gold… The logic for that is getting stronger all the time. We have a stock market that’s getting very jittery here, we have a bond market that’s in a bear market, we have inflation rising, we have craziness going on in various currencies… How many people does it take watching their currencies being that volatile before you say, ‘Give me something little more secure?’”

To hear Eric’s full thoughts, listen here: https://soundcloud.com/sprottmoney/sprott-money-ne…

When the big ones start going, you better head for the hills.” – Eric Sprott on volatile markets (Weekly Wrap-up, April 06,2018)

When the big ones start going, you better head for the hills.” – Eric Sprott on volatile markets (Weekly Wrap-up, April 06,2018)


That’s another week in the books, and Eric Sprott returns once again to break it down for you. In this week’s wrap-up, you’ll hear his thoughts on:

  • What a weak US jobs report means for gold and silver
  • The “terrible vulnerability” of the stock market
  • Plus: Surging open interest in COMEX silver

“The big worry when I look at the stock market in general … I would be very concerned about some of the things that are happening on a macro scale. And one of them, of course, is what happened to cryptocurrencies … It’s a wipeout! People doing exactly the wrong thing with their money … And it just tells you about markets. Let’s go to the stock market … [Facebook, Google, Amazon…] They’re getting picked off one by one. When the big ones start going, you better head for the hills … I just think that this stock market is looking terribly vulnerable. I wouldn’t want to be in it. There are so many things that can go wrong here.”

To hear Eric’s full thoughts, listen here: https://soundcloud.com/sprottmoney/sprott-money-ne…


Total U.S. Debt and Gold

Total U.S. Debt and Gold - Craig Hemke (27/02/2018)

After rising together through 2012, the past five years have seen a massive divergence between the total amount of accumulated U.S. government debt and the price of COMEX gold. When, if ever, will we see this correlation reappear?

After falling together through the late 1990s, the price of COMEX god and the total accumulated U.S. debt began to rise together since 2002. With the help of Nick Laird at GoldChartsRUs, we’ve been able to plot this relationship on the chart below:

As you’ll recall, and as you can see in the chart above, massive U.S. military efforts and the economic collapse during The Great Financial Crisis led to a surge in the total US debt from $6T to $15T in the ten years between 2003-2012. And what happened to the price of COMEX gold over the same time period? It moved up from $400 to $1,800 per ounce.

However, a (not so) funny thing happened in late 2012. The price of COMEX gold began to consistently fall, this despite the over $1T QE3 program that The Fed ran from late 2012 to early 2014 AND a continuing surge in total U.S. debt from $15T to $20T.

Of course, we can debate WHY and HOW this occurred, but that’s a topic for another day. For now, let’s just take another good, long look at that chart of total debt and gold.

It could be said that, beginning with The Great Financial Crisis, gold got ahead of itself. Price had consistently risen with the accumulated debt through 2009 but, by 2011, it was considerably above the established trend. In the correction that followed and ended in 2015, you might note that price fell to roughly the same distance below the established trend. Perhaps this visual aid will help?

…click on the above link to read the rest of the article…

On Guard Against The Banks

On Guard Against The Banks - Craig Hemke

Following the events of yesterday, it seems wise this morning to take an in-depth look at the charts in order to discern what moves The Banks may take next in the hope of stemming this rally and reversing the trends.

Let’s start with Comex Digital Gold. It has been in an UPtrend since July 10 and this rally has carried it $150 or about 12.5%. In doing so, The Commercials on the CoT have increased their NET short position by 182,000 contracts and, specifically, the 24 Banks of the Bank Participation Report have doubled their NET short position, going from 104,748 contracts NET short in July to 213,746 NET short last week.

This places the CoT in its “worst” position since last September and this BPR reveals the largest NET short position on record. Therefore, you KNOW that The Banks will do just about anything at this point to reverse the trend and begin flushing The Specs back out of paper gold. Though they are clearly capable of pulling this off, it may take them a while to do it. Why, you ask?

For CDG, it’s all about the moving averages. We noted early last week that CDG’s 50-day had bullishly crossed UP and through both its 10-day and 200-day MAs. This is a very bullish trend indicator and, most importantly, it sets the Spec HFTs into a “buy the dip mode”. You can see this playing out already when you look at the daily chart.

Also last week, we began to discuss the significance of the $1331 level as support in any pullback. This was the level of resistance and then support in late August so we hoped/expected that same action on any pullback. And look what has happened thus far this week! Even though the all-important USDJPY is up another 50 pips today and pressing against 110, Comex gold is hanging firm at….$1332! For us, this is clear evidence of the HFTs buying the dip.

…click on the above link to read the rest of the article…

Total G-3 Central Bank Control – Craig Hemke

Total G-3 Central Bank Control - Craig Hemke


There’s a lot of amazement and wonder at how the “stock market” can be up today with the devastating news out of Texas and the latest North Korean missile launch. Longtime readers of TFMR know exactly how this market levitation is accomplished so this post is designed as a public service in order to better educate and inform everyone else.

Let’s just keep it simple…

In 2017…and, actually, since 2008…the “markets” don’t actually exist. Oh sure, there are trades and prices but in terms of what the markets were 20 years ago?…those days are long gone. Instead, what we have now is total HFT domination. Over 90% of all volume on the NYSE and NASDAQ is now done through HFT machines that swap positions back and forth. This is common knowledge and if you and I know this, then you can be assured that The Fed, The ECB and the BoJ ( known henceforth as the G-3) know this, too.

To that end, since the G-3 are dedicated to market stability and the wealth effect, these central banks clearly seek to influence the direction of the equity markets by influencing the two key drivers of the HFT machines. And what are these drivers? The currency pair of USDJPY and the volatility index known as the VIX. Simply stated, if your wish is to drive “the stock market” higher, all you need to do is buy the USDJPY while at the same time selling the VIX. It truly is that simple.

To that end, daily observation of trading patterns allows us to observe a clear and obvious, algo-driven program in the all-important USDJPY. Because of the sheer size of the forex market (up to $7T/day), any algorithm put in place to manage this pair could only come from pockets deep enough to make it happen….namely, the G-3.

…click on the above link to read the rest of the article…

Olduvai IV: Courage
Click on image to read excerpts

Olduvai II: Exodus
Click on image to purchase

Click on image to purchase @ FriesenPress