Home » Posts tagged 'What Is Going To Happen In September 2015'
Tag Archives: What Is Going To Happen In September 2015


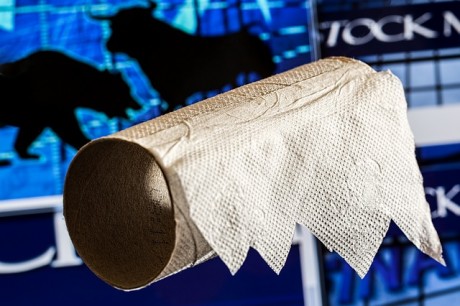
This Is EXACTLY What The Early Phases Of A Market Meltdown Look Like
This Is EXACTLY What The Early Phases Of A Market Meltdown Look Like
 There is so much confusion out there. On the days when the Dow goes down by several hundred points, lots of people pat me on the back and tell me that I “nailed” my call for the second half of this year. But on the days when the Dow goes up by several hundred points, I get lots of people contacting me and telling me that they are confused because they thought the stock market was supposed to go down. Well, the truth is that if there is going to be a full-blown market meltdown, we would expect for there to be wildly dramatic swings in the market both up and down. A perfect example of this is what we experienced during the financial crisis of 2008. 9 of the 20 largest single day declines in stock market history happened that year, but 9 of the 20 largest single day increases in stock market history also happened that year. If we are moving into another great financial crisis, there should be massive ups and massive downs, and that is precisely what we are witnessing right now.
On Tuesday, the Dow surged several hundred points. There was much celebrating in the mainstream media over this, but what they failed to realize was that this was another big red flag. And we saw this volatility carry over into Wednesday. The Dow was up 171 points early in the day before ending down 239 points.
By themselves, those two days don’t mean a whole lot. The key is to look at them in context. And in context, we have already witnessed the most dramatic stock market crash since the last financial crisis.
There will be more days when the stock market absolutely plummets and there will be more days when it absolutely soars. No stock market crash in U.S. history has ever gone in just one direction continually.
…click on the above link to read the rest of the article…
If You Want To Know The Truth About The Unemployment Rate Read This Article
If You Want To Know The Truth About The Unemployment Rate Read This Article
 The Obama administration is telling us that the unemployment rate in the United States has fallen to 5.1 percent, but does that number actually bear any resemblance to reality? On Friday, news outlets all over America celebrated the fact that the U.S. economy added 173,000 jobs in August. We were told that the unemployment rate has fallen to a seven year low and that wages are going up. So everything must be getting better for the middle class, right? After all, isn’t that what the official numbers are telling us?
The financial markets are buzzing over this news because the unemployment rate has fallen into a range that the Federal Reserve has typically considered to be “full employment”, so there is an expectation that the Fed may raise interest rates shortly. The following comes from Business Insider…
The unemployment rate fell to 5.1% in August, the lowest since April 2008. This was lower than forecast, and put the measure in the middle of the 5.2% – 5.0% range the Federal Reserve considers to be “full employment.” The economy added 173,000 jobs, below the expectation for 217,000, although August payrolls are usually revised higher. We also saw some wage growth, with average hourly earnings rising 0.3% month-on-month, and 2.5% year-over-year. The payrolls gain for July was revised up to 245,000 from 215,000.
But do we actually have anything close to “full employment” in this country?
Of course not.
The truth is that the only way they have been able to get the official “unemployment rate” to steadily go down over the past few years is to eliminate hundreds of thousands of Americans that are chronically unemployed from the official labor force numbers every month. Jim Quinn elaborated on this very eloquently in one of his recent articles…
…click on the above link to read the rest of the article…
Stock Market Crash 2015: The Dow Has Already Plummeted 2200 Points From The Peak
Stock Market Crash 2015: The Dow Has Already Plummeted 2200 Points From The Peak
 Those that watched their stocks steadily increase in value for years are now seeing all of that “wealth” disappear at a staggering pace. The only way you actually make money in the stock market is if you get out in time, and many Americans are discovering that all or most of their gains have already been wiped out. At this point, the Dow Jones Industrial Average has dipped below where it was at the end of the 2013 calendar year. That means that nearly two years of gains have already been obliterated. On Friday, the Dow was down another 272 points, and it is now down more than 2200 points from the peak of the market back in May. For months, I have been detailing how things were setting up for this kind of financial crash in textbook fashion, and now events are playing out just as I warned. But this is just the beginning – what is coming next is going to shock the world.
We have already seen the 8th largest and 10th largest single day stock market crashes in all of U.S. history happen within the past few weeks. In fact, it was actually the very first time that we have ever seen the Dow fall by more than 500 points on consecutive trading days.
On August 25th, I warned that there would be some huge rebound days where we would see lots of “panic buying”, and on August 26th we witnessed the 3rd largest single day stock market increase in all of U.S. history.
Headlines all over America trumpeted the “fact” that the stock market had “recovered”, but the mainstream media failed to mention that the only two better days for the stock market were right in the middle of the stock market crash of 2008.
…click on the above link to read the rest of the article…
September 2015 Sure Started Off With Quite A Bang, Eh?
September 2015 Sure Started Off With Quite A Bang, Eh?
 After enduring their worst August in 17 years, U.S. stocks are off to their worst start to a September in 13 years. Just yesterday, I declared that we would be entering the “danger zone” this month, and it didn’t take long for the action to begin. Historically, this month is the worst month of the year for stocks, and most of the biggest stock market crashes throughout our history have come in the fall. On Tuesday, the Dow plunged another 469 points, and it is now down more than 10 percent from the peak of the market back in May. That means that we have officially entered “correction” territory. Asian stocks also crashed hard on Tuesday, so did European stocks, and the price of oil plummeted about 8 percent. For a long time, there have been a lot of people out there that have been warning that a financial crisis would happen in the second half of 2015, and they are being proven right. It is actually happening.
Of course there will be plenty of ups and downs still to come. I cannot emphasize enough that we should fully expect waves of panic selling and waves of panic buying. This always happens during any market crash.
For instance, just consider what happened when the tech bubble crashed. The following analysis comes from Graham Summers…
In a six month period, investors moved stocks down 19%, up 8%, then down 27%, then up 21%, then down 22%, then up 34%, then down 17%, then up 16%, then down 28%, then up 16%, and finally down 17%. Only at that point did stocks break their trendline for the bubble (the blue line) and it became obvious that the bubble had burst.
…click on the above link to read the rest of the article…
During Every Market Crash There Are Big Ups, Big Downs And Giant Waves Of Momentum
During Every Market Crash There Are Big Ups, Big Downs And Giant Waves Of Momentum This is exactly the type of market behavior that we would expect to see during the early stages of a major financial crisis. In every major market downturn throughout history there were big ups, big downs and giant waves of momentum, and this time around will not be any different. As I have explained repeatedly, markets tend to go up when things are calm, and they tend to go down when things get really choppy. During a market meltdown, we fully expect to see days when the stock market absolutely soars. Waves of panic selling are often followed by waves of panic buying. As you will see below, six of the ten best single day gains for the Dow Jones Industrial Average happened during the financial crisis of 2008 and 2009. So don’t be fooled for a moment by a very positive day for stocks like we are seeing on Tuesday. It is all part of the dance.
At one point on Tuesday, the Dow was up over 400 points, and many of the talking heads on television were proclaiming that the stock market had “recovered”. This is something that I predicted would happen yesterday…
And if stocks go up tomorrow (which they probably should), all of those same “experts” will be proclaiming that the “correction” is over and that everything is now fine.
No, everything is not “fine” now. The extreme volatility that we are witnessing just tells us that more trouble is coming. Early on Tuesday the market was “burning up energy” as short-term investors sought to “buy the dip”. But now that wave of panic buying is subsiding and the Dow is only up 240 points as I write this.
Overall, the Dow is still down more than 2,200 points from the peak of the market. Even though I specifically warned that a market crash was coming, I didn’t expect the Dow to be down this far in late August. Even after the “rally” we witnessed today, we are still way ahead of schedule.
…click on the above link to read the rest of the article…
This 2 Day Stock Market Crash Was Larger Than Any 1 Day Stock Market Crash In U.S. History
This 2 Day Stock Market Crash Was Larger Than Any 1 Day Stock Market Crash In U.S. History
 We witnessed something truly historic happen on Friday. The Dow Jones Industrial Average plummeted 530 points, and that followed a 358 point crashon Thursday. When you add those two days together, the total two day stock market crash that we just witnessed comes to a grand total of 888 points, which is larger than any one day stock market crash in U.S. history. It is also interesting to note that this 888 point crash comes in the 8th month of our calendar. Perhaps that is just a coincidence, and perhaps it is not. It just struck me as being noteworthy. This is the first time that the Dow has dropped by more than 300 points on two consecutive days since November 2008, and we all remember what was happening back then. Overall, this was the worst week for the Dow in four years, and there have only been five other months throughout historywhen the Dow has fallen by more than a thousand points (the most recent being October 2008). Of course we still have six more trading days left in August, so there is plenty of time remaining for even more carnage.
By itself, the 530 point plunge on Friday was the ninth worst stock market crash in all of U.S. history. The following list of the top eight comes from Wikipedia…
#1 2008-09-29 −777.68
#2 2008-10-15 −733.08
#3 2001-09-17 −684.81
#4 2008-12-01 −679.95
#5 2008-10-09 −678.91
#6 2011-08-08 −634.76
#7 2000-04-14 −617.77
#8 1997-10-27 −554.26
Another very interesting thing to note is that the largest stock market crash in U.S. history took place on the very last day of the Shemitah year of 2008, and now we are less than a month away from the end of this current Shemitah year.
It is funny how these strange “coincidences” keep happening.
…click on the above link to read the rest of the article…

