Home » Posts tagged 'nat gas' (Page 2)
Tag Archives: nat gas


Chesapeake’s AIG Moment: Energy Giant Faces $1 Billion In Collateral Calls
Chesapeake’s AIG Moment: Energy Giant Faces $1 Billion In Collateral Calls
And then, just two days later, in an unexpected turn, Chesapeake announced that contrary to public opinion, the troubled energy giant “is planning to pay $500 million of debt maturing in March, using a combination of cash on hand and other liquidity that may include its credit line, according to a person with knowledge of the matter.” The issue referenced was precisely the bond that was our “trade of the year.”
To be sure, the bond promptly surged, even as the stock priced tumbled, on what was seen as a very bondholder-friendly action (and thus to the detriment of shareholders) and hit a price of 95 cents while the stock tumbled by 15%, generating a 30% return for anyone who had decided to go along. At that moment we urged anyone in the trade to take their profits and go home, taking a few weeks, or the rest of 2016, off.
A quick update since then shows that those same bonds are currently trading effectively at par (99.25 cents)…

… suggesting that the risk of a near-term Chesapeake bankruptcy may be gone for now.
But is it truly off the table?
Sadly, we think that despite the brief hiccup in optimism, CHK’s troubles are about to get worse, even if this particular bond is ultimately repaid, for one simple reason: in its 10-K filed yesterday, Chesapeake announced that it has just reached its own “AIG moment.”
…click on the above link to read the rest of the article…
A Reality Check For U.S. Natural Gas Ambitions
A Reality Check For U.S. Natural Gas Ambitions
Something unusual happened while we were focused on the global oil-price collapse–the increase in U.S. shale gas production stalled (Figure 1).

Figure 1. U.S. shale gas production. Source: EIA and Labyrinth Consulting Services, Inc.
(click image to enlarge)
Total shale gas production for June was basically flat compared with May–down 900 mcf/d or -0.1% (Table 1).
![]()
Table 1. Shale gas production change table. Source: EIA and Labyrinth Consulting Services, Inc.
(click image to enlarge)
Marcellus and Utica production increased very slightly over May, 1.1 and 1.5 mmcf/d, respectively. The Woodford was up 400 mcf/d and “other” shale increased 300 mcf/d. Production in the few plays that increased totaled 3.3 mmcf/d or one fair gas well’s daily production.
Related: The Broken Payment Model That Costs The Oil Industry Millions
The rest of the shale gas plays declined. The earliest big shale gas plays–the Barnett, Fayetteville and Haynesville–were down 25%, 14% and 48% from their respective peak production levels for a total decline of -4.8 bcf/d since January 2012.
The fact that Eagle Ford and Bakken gas production declined suggests tight oil production may finally be declining as well.
To make matters worse, total U.S. dry natural gas production declined -144 mmcf/d in June compared to May, and -1.2 bcf/d compared to April (Figure 2). Marketed gas declined -117 mmcf/d compared to May and -1 bcf/d compared to April.

Figure 2. U.S. natural gas production. Source: EIA and Labyrinth Consulting Services, Inc.
(click image to enlarge)
Although year-over-year gas production has increased, the rate of growth has decreased systematically from 13% in December 2014 to 5% in June 2015 (Figure 3).

Figure 3. U.S. dry gas year-over-year production change. Source: EIA and Labyrinth Consulting Services, Inc.
(click image to enlarge)
This all comes at a time when the U.S. is using more natural gas for electric power generation. In April 2015, natural gas used to produce electricity (32% of total) exceeded coal (30% of total) for the first time (Figure 4).
…click on the above link to read the rest of the article…
Have Natural Gas Prices Bottomed?
Have Natural Gas Prices Bottomed?
Last Friday we finally got confirmation of where all the natural gas supply has been coming from as Cabot (COG) reported its earnings. Just like Chesapeake (CHK), they reduced natural gas output, but on a much grander scale. CHK has yet to report and will do so on May 6th providing even more color on the subject.
Last month they announced a 2% reduction in NGAS volumes to 1-3% for 2015 vs. 3-5%. But the ramp up of supply from Marcellus, and to a lesser extent Utica, and a corresponding flat to up rig count in natural gas rigs in those areas appears to be the reason why NGAS has crashed some 30% despite a relatively cold winter in the mid-west and East especially. The magnitude of the supply increase is simply stunning, begging the question: what was Cabot’s management thinking by increasing NGAS production in Marcellus by some 40% to 162 BCF in 1Q15 and up 12.5% sequentially from 4Q14? And, to boot, 4Q14 was up over 13% sequentially from 3Q14!

Source: Company Data
The Marcellus region began ramping up in 2010 which has resulted in a surge in production which has probably peaked 1Q15 in terms of rate of growth. It has by far contributed to the largest increases in output and has signal handily resulted in the crash in prices.
With spot prices hovering around $2.45/MMBTU and within 10% of the most bearish estimate targets this quarter, it seems the worst of the oversupply is behind the market especially with EPA rules forcing coal to NGAS switching in volume this summer. Coal still represents the majority of fuel used to generate electricity despite this trend.
…click on the above link to read the rest of the article…
Natural Gas Futures Drop Below $3 for First Time Since 2012 – Bloomberg
Natural Gas Futures Drop Below $3 for First Time Since 2012 – Bloomberg.
Natural gas futures slumped below $3 per million British thermal units for the first time since 2012 on speculation that record production will overwhelm demand for the heating fuel.
Futures have slid 29 percent this year, heading for the first annual decline since 2011, as mild weather leaves stockpiles at a surplus to year-ago levels for the first time in two years. Temperatures may be mostly above average in the eastern half of the U.S. through Dec. 28, according to Commodity Weather Group LLC.
In the absence of extreme weather, rising production will leave inventories at an all-time high above 4 trillion cubic feet by the end of October 2015, BNP Paribas SA said in a report Dec. 23. U.S. gas production may climb 5.5 percent this year to a fourth consecutive record, government data show.
“This market continues to look oversupplied,” said Aaron Calder, senior market analyst at Gelber & Associates in Houston, said by phone on Dec. 24. “We are seeing support at $3 but I would say that once we break that I think $2.70 is probably our lower technical target.”
Fracking Fracas: The Trouble with Optimistic Shale Gas Projections by the U.S. Department of Energy Post Carbon Institute
On December 3, 2014, Nature published “Natural Gas: The Fracking Fallacy”, which suggested that the forecasts of the Energy Information Administration (EIA) for four major U.S. shale gas plays were wildly optimistic, based on a comparison to forecasts for the same plays by the University of Texas Bureau of Economic Geology (UT/BEG). This was followed by a formal denunciation of the article both by the EIA and UT/BEG, despite the fact that the substance of the article was correct. Arthur Berman provided an excellent overview of the merits—or in this case the lack thereof—of the attack by both of these agencies on what is essentially the reality behind the shale revolution.
The Nature piece steered clear of any discussion of my recent Drilling Deeper report (published by Post Carbon Institute), which looked at twelve major shale gas and tight oil plays accounting for most of U.S. shale production, and which also came to the conclusion that the EIA’s projections were extremely optimistic. Naturefocused instead on the four plays described in two published and two unpublished studies by UT/BEG. TheNature article sparked a lot of media attention, which prompted the EIA and UT/BEG to issue rebuttals.
The argument of the EIA and UT/BEG that their projections of shale gas production from the plays mentioned in the Nature article are fundamentally similar is untrue, given the publicly available data. The implications of the EIA being wrong on its projections of cheap and abundant gas for decades are considerable, given that investment decisions are now being made based on these projections— including construction of infrastructure for LNG exports, gas-fired generation and even crude oil exports. Hence it is worthwhile to examine the EIA’s optimistic projections in more detail in light of the projections available from UT/BEG and the Drilling Deeperreport (DD).
First Oil, now US Natural Gas Plunges off the Chart, “Negative Igniter” for New Debt Crisis | Wolf Street
Friday, natural gas futures plunged 6%. Monday morning, when folks were thinking about the beautiful Santa Rally, NG futures plunged nearly 10% to $3.12 per million Btu, the lowest since January 10, 2013. But the crazy day had just begun. NG bounced off and jumped nearly 4%, only to give up much of it later. Tuesday morning, as I’m finishing this up, NG continues to decline, now at $3.11/mmBtu. Down 30% from a month ago.
NG demand peaks when the heating season starts. It’s a bet on the weather. Our gurus forecast warmer than normal temperatures across the country, so prices plunged. Or shorts piled into the pre-holiday session with exaggerated effect to make a quick buck.
Here is what this 30-day, 30% plunge looks like (each bar = 5 hours):
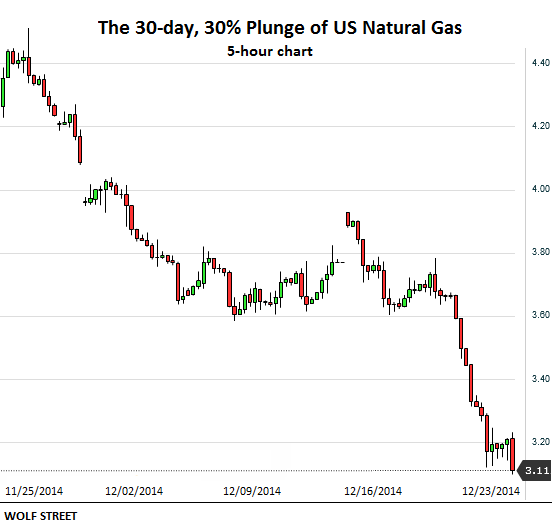
Whatever the cause, NG has traded below the cost of production of many wells for years. That lofty $4.40/mmBtu on the left side in the chart above is still below the cost of production for many wells. The price simply fell from bad to terrible.
Peak Oil Notes – Oct 23
New York oil futures traded around $82 a barrel this week until Wednesday’s stocks report showed an unexpected 7 million barrel jump in US crude stocks. The jump resulted in a nearly $2 decline in the futures market to a close of $80.52 a barrel, the lowest settlement since June of 2012. London’s crude, which had been trading around $86 slid $1.51 on Wednesday to a close of $84.71. Refinery maintenance is in full swing with utilization down to 86.7 percent, the lowest since March, as changeover to winter blends continues. Refinery maintenance, the primary cause of the crude inventory build, is now at its peak, but should be over in a few weeks. Gasoline inventories fell last week due to less production, but distillates increased as demand for heating oil and diesel is currently weak.
US natural gas futures fell to a new 11-month low on Wednesday as traders are expecting that Thursday’s report will show that a larger than normal amount of gas was injected into storage last week. Mild weather, with minimal demand for heating gas, is expected to continue across the US for the next couple of weeks and long-range forecasts are predicting that really cold weather will not settle in across the US until January.
…click on the link above to read the rest of the article…

