

BP recently published energy data through December 31, 2017, in its Statistical Review of World Energy 2018. The following are a few points we observe, looking at the data:
[1] The world is making limited progress toward moving away from fossil fuels.
The two bands that top fossil fuels that are relatively easy to see are nuclear electric power and hydroelectricity. Solar, wind, and “geothermal, biomass, and other” are small quantities at the top that are hard to distinguish.
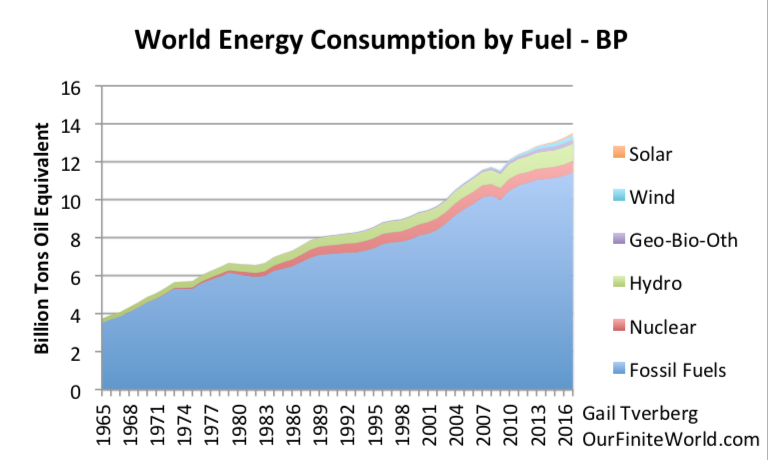
Figure 1. World energy consumption divided between fossil fuels and non-fossil fuel energy sources, based on data from BP 2018 Statistical Review of World Energy 2018.
Wind provided 1.9% of total energy supplies in 2017; solar provided 0.7% of total energy supplies. Fossil fuels provided 85% of energy supplies in 2017. We are moving away from fossil fuels, but not quickly.
Of the 252 million tons of oil equivalent (MTOE) energy consumption added in 2017, wind added 37 MTOE and solar added 26 MTOE. Thus, wind and solar amounted to about 25% of total energy consumption added in 2017. Fossil fuels added 67% of total energy consumption added in 2017, and other categories added the remaining 8%.
[2] World per capita energy consumption is still on a plateau.
In recent posts, we have remarked that per capita energy consumption seems to be on a plateau. With the addition of data through 2017, this still seems to be the case. The reason why flat energy consumption per capita is concerning is because oil consumption per capita normally rises, based on data since 1820.1 This is explained further in Note 1 at the end of this article. Another reference is my article, The Depression of the 1930s Was an Energy Crisis.
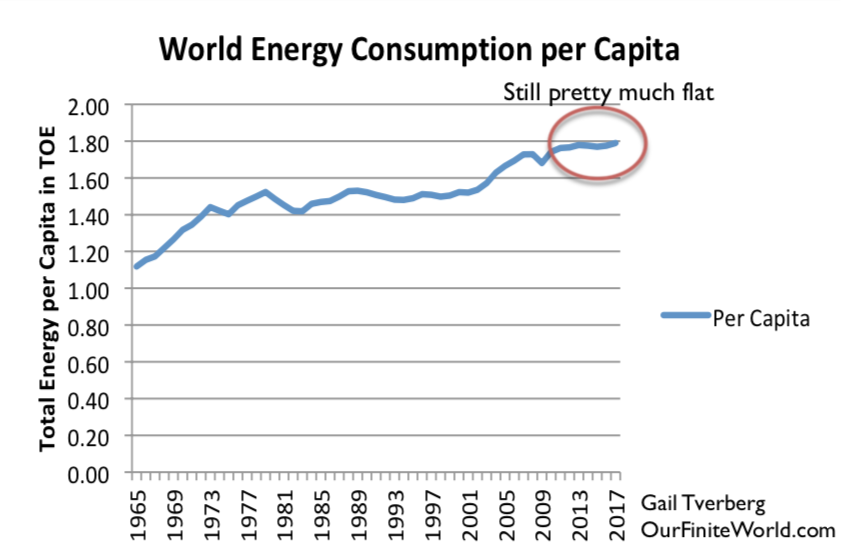
Figure 2. World energy consumption per capita, based on BP Statistical Review of World Energy 2018 data.
While total energy consumption is up by 2.2%, world population is up by about 1.1%, leading to a situation where energy consumption per capita is rising by about 1.1% per year. This is within the range of normal variation.
…click on the above link to read the rest of the article…

