Home » Posts tagged 'carbon brief' (Page 2)
Tag Archives: carbon brief


In-depth: BP’s global data for 2017 shows record highs for coal and renewables

Renewable energy grew by the largest amount ever last year, while coal-fired electricity also reached a record high, according to new global data from oil giant BP.
However, set against continued rapid rises in energy demand fuelled by oil and gas, renewables were not enough to prevent global CO2 emissions rising significantly for the first time in four years, the figures show.
This was partly because cyclical economic changes had flattered progress in previous years and, last year, cancelled out some of the slow, continuing shift towards a lower-carbon energy, BP says.
Still, the goals of the Paris Agreement look as far away as ever in the wake of these latest figures, given emissions must, ultimately, reach net-zero by mid-century to avoid dangerous warming.
Carbon Brief runs through the 2018 BP Statistical Review of World Energy, which, for the first time, covers all sources of electricity and the key materials needed for electric vehicles.
Another renewables record
Wind, solar and other non-hydro renewable energy sources grew by 69m tonnes of oil equivalent (Mtoe) in 2017. This was their largest-ever increase, breaking last year’s record of 53Mtoe. Renewables were also the fastest-growing source of energy last year, up 17%.
Nevertheless, all low-carbon sources together met just a third of the 253Mtoe (2.2%) increase in global energy demand in 2017. Fossil fuels met the remaining two thirds, with gas (+83Mtoe, 3.0%) the single-largest source of new energy supply last year.
Changes in the sources of global energy supply between 2016 and 2017, millions of tonnes of oil equivalent. Source: BP Statistical Review of World Energy 2018 and Carbon Brief analysis. Chart by Carbon Brief using Highcharts.…click on the above link to read the rest of the article…
Sea level rise due to Antarctic ice melt has ‘tripled over past five years’
The study, published in Nature, finds that ice loss from Antarctica has caused sea levels to rise by 7.6mm from 1992-2017, with two fifths of this increase occurring since 2012.
At a press conference held in London, scientists said the results suggest that Antarctica has become “one of the largest contributors to sea level rise”.
A glaciologist not involved in the paper tells Carbon Brief that the findings show “there now should be no doubt that Antarctica is losing ice due to regional climate change, likely linked to global warming”.
Melting continent
The new research was carried out by a team of scientists from the Ice Sheet Mass Balance Inter-comparison Exercise (IMBIE). The international group was established in 2011 with the aim of creating a comprehensive view of how melting in world’s polar regions could be contributing to sea level rise.
In its last assessment report, released in 2012, it found that ice melt in Antarctica was causing global sea levels to rise by 0.2mm a year. (Over the past two decades, global sea levels have risen around 3.2mm a year in total.)
However, the new analysis finds that Antarctic ice melt is now driving sea level rise of 0.6mm a year – suggesting that the rate of melting has increased three-fold in just five years.
The results show that Antarctic ice melt has become “one of the largest contributors to sea level rise”, says Prof Andrew Shepherd, co-leader of IMBIE and director of the Natural Environment Research Council (NERC) Centre for Polar Observation and Modelling based at the University of Leeds.
…click on the above link to read the rest of the article…
World can limit global warming to 1.5C by ‘improving energy efficiency’
It is possible to limit global warming to 1.5C and achieve many of the sustainable development goals without “negative emissions technologies”, a new study finds.
The research suggests that improving energy efficiency – chiefly by saving on everyday energy use – could play a major role in restricting warming to 1.5C above pre-industrial levels, which is the aspirational target of the Paris Agreement.
Emerging technologies, such as multipurpose smartphones and electric autonomous cars, could be key to improving energy efficiency both in the developed world and the global south, the lead author tells Carbon Brief.
The “landmark” study provides policymakers with tools to implement strategies to rapidly increase energy efficiency, another scientist tells Carbon Brief.
Negative emissions
Under the Paris Agreement, countries agreed that warming should be limited to “well below” 2C above pre-industrial levels, with efforts to keep it below 1.5C. Since then, researchers have developed a range of scenarios to explore how this could be achieved.
Until recently, scenarios limiting warming to 1.5C have typically relied on the rapid and widespread deployment of negative emissions technologies (NETs).
NETs are a group of methods – many still in development – that would limit global warming by removing CO2 from the air and storing it on land, underground or in the oceans.
In particular, most 1.5C scenarios assume that the world will develop large-scale bioenergy with carbon capture and storage (BECCS). Put simply, BECCS involves burning biomass – such as trees and crops – to generate energy and then capturing the resulting CO2 emissions.
The assumption that BECCS will be needed to reach 1.5C has proved controversialamong some groups. This is because BECCS has yet to be demonstrated at a commercial scale and research suggests that deployment would take up large amounts of land, which could threaten food production and wildlife.
…click on the above link to read the rest of the article…
Global warming to date could ‘obliterate’ a third of glacier ice
The warming the world has already experienced could be enough to melt more than a third of the world’s glaciers outside Antarctica and Greenland – regardless of current efforts to reduce emissions.
That is the stark conclusion of a new study, which analyses the lag between global temperature rise and the retreat of glaciers.
The relatively slow response of glaciers to global warming means it will take to the end of the century – and beyond – to see the benefits of mitigation efforts in the coming decades, the study says.
The “baked in” glacier loss from observed warming has largely been overlooked, another scientist tells Carbon Brief, meaning “we really are on course to obliterate many of these mountain landscapes”.
Ice cube
Glaciers are huge rivers of ice that ooze their way over land, powered by gravity and their own sheer weight. They accumulate ice from snowfall and lose it through melting.
As global temperatures have risen, many of the world’s glaciers have already started to shrink and retreat. Continued warming could see many iconic landscapes – from the Canadian Rockies to the Mount Everest region of the Himalayas – lose almost all their glaciers by the end of the century.
But glacier retreat does not happen overnight. So if global temperature rise stopped immediately, how much of the world’s glacier ice could be saved? And for how much is its fate already sealed?
This is what the new study, published in Nature Climate Change, aims to work out.
The study focuses on the lag between rising temperatures and how quickly glaciers adjust. An ice cube makes a suitable metaphor, as three of the authors – Prof Ben Marzeion, Dr Georg Kaser and Dr Fabien Maussion – explain to Carbon Brief over email:
“If you take an ice cube from the fridge – i.e. from one climate – to the kitchen table – i.e. a new climate – it will, finally, but not instantaneously, melt. The time it takes to fully melt the cube depends on: a) the size of the cube; and b) the temperature in your kitchen.”
…click on the above link to read the rest of the article…
Acidification could leave oceans ‘uninhabitable’ for cold-water corals
Ocean acidification, which occurs as seawater takes up CO2 from the atmosphere, could threaten around 70% of cold-water coral living below 1,500 metres in the North Atlantic Ocean by 2050, the research finds.
Acidified waters that accumulate in the North Atlantic could then be circulated to the global seas via a system of ocean currents, the lead author tells Carbon Brief, which could have consequences for reefs across the world.
The findings reiterate how many coral reefs could “dissolve” and “crumble” as the world continues to warm, another scientist tells Carbon Brief.
Cool corals
Cold-water corals are found in deep, dark parts of the world’s oceans in both the northern and southern hemisphere. They can thrive at depths of up to 2,000 metres and in water temperatures as low as 4C.
Unlike tropical corals, cold-water corals do not rely on colourful algae for their food. Instead, cold-water coral feed on floating plankton.
This means they are unaffected by coral bleaching, a process which is heightened by climate change and poses a great threat to the survival of tropical reefs, such as the Great Barrier Reef.
However, both tropical and cold-water coral species are threatened by a process known as “ocean acidification”, which occurs as seawater absorbs CO2 from the atmosphere.
The oceans have absorbed around 30% (pdf) of the CO2 released by human activity since the industrial revolution. This has caused oceans, which are alkaline, to become more acidic over time. The overall pH of seawater has fallen from around 8.2 to 8.1from pre-industrial times to the present day.
…click on the above link to read the rest of the article…
New study questions impact of ending fossil fuel subsidies
Ending the world’s fossil fuel subsidies would reduce global CO2 emissions by 0.5 to 2.2 gigatonnes (Gt) per year by 2030, a new study says.
The research, published by Nature, concludes that the removal of subsidies would lead to bigger emissions reductions in oil and gas exporting regions, such as Russia, Latin America and the Middle East, than promised by their Paris Agreement pledges.
In all other regions, removing fossil fuel subsidies would not have as large an impact as the Paris pledges, the lead author tells Carbon Brief.
However, a researcher not linked to the report tells Carbon Brief that comparing the effects of subsidy removal to the Paris pledges is “unnecessary and inappropriate”, since these economy-wide pledges are generally composed of many other policies and actions than just subsidy removal.
Global removal
Ending financial support for fossil fuels has long been cited as an important way to reduce the world’s greenhouse gas emissions. Both the G7 and the G20 have pledged to end “inefficient” fossil fuel subsidies – the G7 by 2025, and the G20 with no fixed end-date.
The new research analyses the implications for mitigation efforts in different regions of the world of removing all fossil fuel subsidies.
The researchers built a global dataset of subsidies under both high and low oil prices, and worked with five different modelling teams to look at the impact of removing these subsidies on emissions.
The study found the removal of subsidies would reduce the globe’s CO2 emissions by 0.5-2.2Gt per year compared to a business-as-usual scenario by 2030, equivalent to a 1-5% reduction.(Note though, that under a business-as-usual case overall emissions would increase substantially even with this reduction).
The graph below shows the impact of subsidy removal on emissions in each of the five models used in the study, compared to each model’s baseline, for low (left) and high (right) oil prices.
…click on the above link to read the rest of the article…
Long-term climate variability ‘could fall’ as the world warms
Long-term climate variability is the range of temperatures and weather patterns experienced by the Earth over a scale of thousands of years. New research suggests it could fall as the world warms.
A study using data taken from fossils and ice cores finds that long-term temperature variability decreased four-fold from the Last Glacial Maximum (LGM) around 21,000 years ago to the start of the Holocene around 11,500 years ago. Within this period, natural processes caused the planet to warm by around 3-8C.
If future global emissions are not curbed, human-driven global warming could cause further large declines in long-term temperature variability, the lead author tells Carbon Brief, which may have far-reaching effects on the world’s seasons and weather.
However, it is still unclear how a decline in long-term variability could affect the frequency of extreme weather events, she adds. This is because the chances of an extreme event happening could be influenced by both short- and long-term climate variability, as well as global temperature rise.
Digging up the past
The new study, published in Nature, is the first to make a global assessment of how long-term temperature variability changed from the LGM to the Holocene.
During the LGM, the world’s last major ice age, snow covered much of Asia, Europe and North America. Yet, within a few thousand years, global temperatures rose by around 3-8C, causing the ice to thaw and the world to enter its current geological period, the Holocene.
The cause of this temperature rise is still disputed by scientists, but research suggests the natural release of large stores of CO2 from the world’s oceans may have played a role.
…click on the above link to read the rest of the article…
2017: Carbon Brief’s end-of-year review
2017: Carbon Brief’s end-of-year review
49 countries
For CO2 emissions to fall, they first have to peak. And research published this year suggests that this is already happening.
The report, produced by the US-based World Resources Institute (WRI), suggests that 49 countries – which include the UK, US, Australia, Brazil and Canada – have seen their emissions peak, representing around 36% of current global emissions.
Carbon Brief created an interactive chart of WRI’s data as part of our coverage.
But how much time does the world collectively have left to reduce its emissions in order to avoid dangerous climate change?
At the beginning of the year, Carbon Brief published our traditional carbon budget update, revealing that just four years of current CO2 emissions would blow what’s left of the budget for a good chance of keeping global temperature rise to 1.5C.
However, in September, a new study published in Nature Geoscience proposed that there might be a little more breathing space to meet the 1.5C limit than previously thought.
As lead author Dr Richard Millar explained in a guest post, the study estimates the remaining 1.5C carbon budget from today onwards. This contrasts to previous methods which have been based on cumulative emissions to date. As a result, Millar’s study put the remaining 1.5C budget at around 20 years of current emissions.
The paper caused quite a stir, with parts of the media claiming that climate models – the basis for carbon budget estimates – are “wrong” and have overstated the observed warming of the planet.
Carbon Brief factchecked these claims, showing that the model-observation comparisons in the study depend greatly on the dataset and model outputs used by the authors.
…click on the above link to read the rest of the article…
Analysis: Why scientists think 100% of global warming is due to humans
The extent of the human contribution to modern global warming is a hotly debated topic in political circles, particularly in the US.
During a recent congressional hearing, Rick Perry, the US energy secretary, remarked that “to stand up and say that 100% of global warming is because of human activity, I think on its face, is just indefensible”.
However, the science on the human contribution to modern warming is quite clear. Humans emissions and activities have caused around 100% of the warming observed since 1950, according to the Intergovernmental Panel on Climate Change’s (IPCC) fifth assessment report.
Here Carbon Brief examines how each of the major factors affecting the Earth’s climate would influence temperatures in isolation – and how their combined effects almost perfectly predict long-term changes in the global temperature.
Carbon Brief’s analysis finds that:
- Since 1850, almost all the long-term warming can be explained by greenhouse gas emissions and other human activities.
- If greenhouse gas emissions alone were warming the planet, we would expect to see about a third more warming than has actually occurred. They are offset by cooling from human-produced atmospheric aerosols.
- Aerosols are projected to decline significantly by 2100, bringing total warming from all factors closer to warming from greenhouse gases alone.
- Natural variability in the Earth’s climate is unlikely to play a major role in long-term warming.
Animation by Rosamund Pearce for Carbon Brief. Images via Alamy Stock Photo.
How much warming is caused by humans?
In its 2013 fifth assessment report, the IPCC stated in its summary for policymakers that it is “extremely likely that more than half of the observed increase in global average surface temperature” from 1951 to 2010 was caused by human activity. By “extremely likely”, it meant that there was between a 95% and 100% probability that more than half of modern warming was due to humans.
…click on the above link to read the rest of the article…
Analysis: Global CO2 emissions set to rise 2% in 2017 after three-year ‘plateau’
Over the past three years, global CO2 emissions from fossil fuels have remained relatively flat. However, early estimates from the Global Carbon Project (GCP) using preliminary data suggest that this is likely to change in 2017 with global emissions set to grow by around 2%, albeit with some uncertainties.
Hopes that global emissions had peaked during the past three years were likely premature. However, GCP researchers say that global emissions are unlikely to return to the high growth rates seen during the 2000s. They argue that it is more likely that emissions over the next few years will plateau or only grow slightly, as countries implement their commitments under the Paris Agreement.
2017 emissions likely to increase
The GCP is a group of international researchers who assess both sources and sinks of carbon. It has published an annual global carbon budget report since 2006. Its newly released global carbon budget for 2017 provides estimates of emissions by country, global emissions from land-use changes, atmospheric accumulation of CO2, and absorption of carbon from the atmosphere by the land and oceans.
Video summary of the findings of the GCP’s new 2017 global carbon budget, via Future Earth and the GCP.The figure below shows global CO2 emissions from fossil fuels, divided into emissions from China (red shading), India (yellow), the US (bright blue), EU (dark blue) and the remainder of the world (grey). After a rapid increase in global emissions of around 3% per year between 2000 and 2013, emissions only grew by 0.4% per year between 2013 and 2016.
Annual CO2 emissions from fossil fuels by major country and rest of world from 1959-2017, in gigatons CO2 per year (GtCO2). Note that 2017 numbers are preliminary estimates. Data from the Global Carbon Project and available here. Chart by Carbon Brief using Highcharts.
…click on the above link to read the rest of the article…
The Carbon Brief Interview: Dr Katharine Hayhoe
Dr Katharine Hayhoe is a professor in the department of political science at Texas Tech University and director of its Climate Science Center. She was a lead author on the Climate Science Special Report, part of the fourth US National Climate Assessment, which was published in early November 2017. Hayhoe is also a science advisor on the US documentary series Years of Living Dangerouslyand was named as one of Time magazine’s 100 Most Influential People in 2014.
Together with her husband, Hayhoe wrote A Climate for Change: Global Warming Facts for Faith-Based Decisions. She also writes and produces an animated series on YouTube called “Global Weirding”.
- Hayhoe on her early research career: “I was looking around for an extra course that might be interesting and I saw a class on climate modelling over in the geography department.”
- On regional climate information: “I evaluate the downscaling methods we use to take the relatively coarse information from the big global models and downscale it to much higher spatial and sometimes even high temporal resolution at the local to regional scale.”
- On improving climate models: “The smaller the spatial grids and the smaller the time step we use in the model, the better we’re able to actually explicitly resolve the physical processes in the climate.”
- On the biggest unknowns of future climate change:“There are long-term processes in the climate system that we’re not yet incorporating in our models and when we do, the final outcome of this inadvertent experiment that we’ve been conducting with our planet is likely to be worse, not better, than we thought.”
- On Donald Trump’s presidency: “I know this sounds very strange – but I really believe that his election galvanised people into personal action in a way that never would have happened if Clinton had been elected.”
…click on the above link to read the rest of the article…
State of the climate: 2017 shaping up to be warmest ‘non-El Niño’ year
State of the climate: 2017 shaping up to be warmest ‘non-El Niño’ year
Much of the year, though the summer Arctic minimum was only the eighth lowest on record.
2017 is also almost certain to be the warmest year without an El Niño event. When the effects of El Niño and La Niña are removed from the temperature record, the first nine months of 2017 are likely the warmest ever recorded.
Near-record warm temperatures
Ten months in, 2017 is very likely going to be either the second warmest or third warmest year on record, depending on the temperature series used. While there was some speculation earlier in the year that it could challenge 2016 for first place, colder temperatures in the period from June through September have largely eliminated any chance of a new record.
Carbon Brief has examined global temperature data from eight different climate centres around the world, both for the Earth’s surface and the lower troposphere (TLT). Temperatures for the full year of 2017 were estimated using the data available to-date for each dataset, along with projection of the El Niño Index for the remainder of 2017 (see methods at the end of the article for technical details).
The results are shown in the figure below. Annual temperatures from 1979 through 2016 are shown in black for each record, while the likely (95% confidence interval) range of the 2017 annual temperature is shown by the red bar.
The last two records shown, RSS and UAH, come from satellite data and are measuring the atmosphere on average around 5 km up from the surface. While these have similarities to surface temperatures, they are not expected to always respond in the same way to El Niño or other factors.
…click on the above link to read the rest of the article…
Factcheck: Climate models have not ‘exaggerated’ global warming
Factcheck: Climate models have not ‘exaggerated’ global warming
A new study published in the Nature Geosciences journal this week by largely UK-based climate scientists has led to claims in the media that climate models are “wrong” and have significantly overestimated the observed warming of the planet.
Here Carbon Brief shows why such claims are a misrepresentation of the paper’s main results. In reality, the results obtained from the type of model-observation comparisons performed in the paper depend greatly on the dataset and model outputs used by the authors.
Much of the media coverage surrounding the paper, Millar et al, has focused on the idea that climate models are overestimating observed temperatures by around 0.3C, or nearly 33% of the observed warming since the late 1800s. For example, the Daily Mailreported:
According to these models, temperatures across the world should now be at least 1.3 degrees above the mid-19th century average, which is taken as a base level in such calculations. But the British report demonstrates that the rise is only between 0.9 and 1 degree.
Lead author Dr Richard Millar and his co-authors have pushed back against such media coverage, releasing a statement which says:
A number of media reports have asserted that our [study] indicates that global temperatures are not rising as fast as predicted by the Intergovernmental Panel on Climate Change (IPCC), and hence that action to reduce greenhouse gas emissions is no longer urgent. Both assertions are false. Our results are entirely in line with the IPCC’s 2013 prediction that temperatures in the 2020s would be 0.9-1.3 degrees above pre-industrial [levels].
[Carbon Brief’s guest post by Dr Millar earlier this week includes the paper’s key figures. Additionally, one of his co-authors, Prof Piers Forster, provides further reaction at the end of this article.]
Contrary to media claims, the study found that warming is consistent with the range of IPCC models, albeit a bit lower than the average of all the models.
…click on the above link to read the rest of the article…
Climate change doubled the chances of Louisiana heavy rains, scientists warn

Torrential rains unleashed on south Louisiana in August were made almost twice as likely by human-caused climate change, according to a quick-fire analysis released just weeks after the flood waters subsided.
The team of scientists concluded that such an event is expected to occur a minimum of 40% more often now than in 1900, but their best estimate is that the odds have now halved.
Dr Friederike Otto, a senior researcher in extreme weather and attribution in the Environmental Change Institute at Oxford University, who wasn’t involved in the research, tells Carbon Brief:
The new research is the latest in what are known as “single event attribution” studies. This one is notable for being the first collaboration between scientists at the World Weather Attribution (WWA) project and the US National Oceanic and Atmospheric Administration (NOAA).
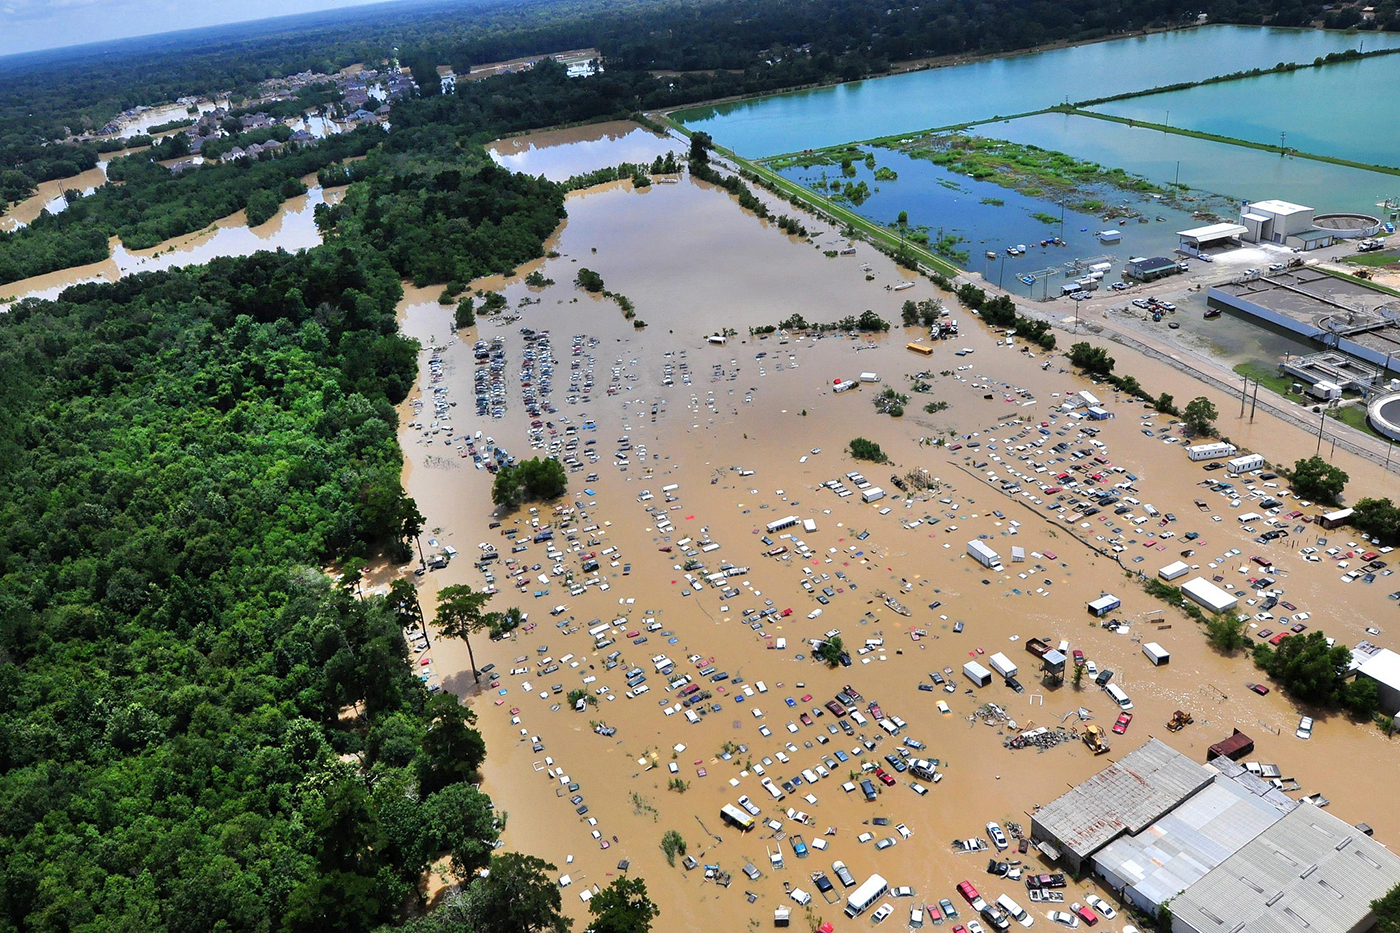
A view from an MH-65 Dolphin helicopter shows flooding and devastation in Baton Rouge, Louisiana, 15 August 2016. Credit: Melissa Leake/US Department of Agriculture.
Historic rains
On 10 Aug 2016, a low pressure system swept into south Louisiana from the Gulf of Mexico. A combination of unusually warm water providing extra “fuel” for the storm and its sluggish movement meant it dumped a huge amount of rain in one area for several days in a row.
The WWA team said in a summary accompanying their findings:
…click on the above link to read the rest of the article…
Feeding the world: Can we preserve forests, go organic and eat meat?

The only way to guarantee enough food in 2050 is if the world turns vegan, says the study published today in Nature Communications. That way, even the most pessimistic projections for technological improvements and availability of farmland wouldn’t see people going hungry.
With a global transition to veganism unlikely, the study explores the options left on the table if we continue to eat meat, as well as how climate change might narrow those options further.
The study is more of a thought experiment than a realistic set of projections. But the point it makes is simple: we, as humans, must work out how to make the most appropriate use of a finite amount of land. While there will inevitably be compromises, the paper concludes:
“Zero-deforestation”
Whether for growing crops, grazing or building on, 75% of the Earth’s ice-free surface is used in one way or another by humans, today’s study begins. Put another way, only a quarter is left in something resembling its natural state.
Land-based ecosystems house a large fraction of the world’s biodiversity, as well as providing food, fuel, energy, air and water purification, and protection against the elements for humans.
Forests, in particular, also play an important role in mitigating climate change. The paper notes:
…click on the above link to read the rest of the article…

