Home » Posts tagged 'boom and bust' (Page 2)

Tag Archives: boom and bust

Olduvai
Click on image to purchase

Olduvai III: Catacylsm
Click on image to purchase

Post categories

Post Archives by Category

Shale Euphoria: The Boom and Bust of Sub Prime Oil and Natural Gas

Shale Euphoria: The Boom and Bust of Sub Prime Oil and Natural Gas

Those whom the gods wish to destroy they first send mad

Introduction

The aim of this article is to show that the shale industry, whether extracting oil or gas, has never been financially sustainable. All around the world it has consistently disappointed profit expectations. Even though it has produced considerable quantities of oil and gas, and enough to influence oil and gas prices, the industry has mostly been unprofitable and has only been able to continue by running up more and more debt. How could this be? It seems paradoxical and defies ordinary economic logic. The answer is to be found in the way that the shale gas sector has been funded. It is part of a bubble economy inflated by monetary policy that has kept down interest rates. This has made investors “hunt for yield”. These investors believed that they had found a paying investment in shale companies – but they were really proving that they were susceptible to wishful thinking, vulnerable to hype and highly unethical practices that enabled Wall Street and other bankers to do very nicely. Those who invested in fracking are going to lose a lot of money.

A Global Picture of disappointed expectations

Around the world big expectations for fracking have not been realised. One example is Argentina where shale oil reserves were thought to rival those in the USA. It is a country where there has been local opposition while central government pushed the industry in alliance with multinational companies and its own company YPC. However profitability has been elusive. To have any hope of profitability shale development has to be done at scale to rapidly bring down costs enough to make a profit.


…click on the above link to read the rest of the article…

We Need the Pain that Comes with More Saving

We Need the Pain that Comes with More Saving We Need the Pain that Comes with More Saving

The endgame of monetary side manipulations is upon us. Since 2008, central banks have done what they thought was needed to bring the markets back from the pain they experienced during the crash. The problem, of course, is that these Keynesians and Monetarists placed the high level of stock markets as the goal of “policy” and confused booming asset levels with economic growth.

The enemy of prosperity, in the eyes of global economic policymakers, is the desire of the consumer to save and  businesses to refrain — even in the short term — from investment. As such, their “solution” was the very poison that has infected the Western world over the decades: more credit, lower costs of money, more push for “consumer demand.”

The Current Orthodoxy Is Failing

But “easy” monetary policy has merely led to debt-ridden economies and a bubble that is increasingly being exposed as a complete farce. January saw a market pullback tease that reminded investors that what was pushed up artificially can’t be sustained forever. Monetary policy, even if it goes to negative interest rate territory with a vengeance, isn’t going to be the miracle drug needed to provide a better economic foundation. Austrians have long known this. The mainstream is just starting to publicly admit it.

The Savings-Glut Myth

However, the right lessons are not being learned by either the economic policymakers or the financial pundits. In fact, the most dangerous economic fallacies still underlie their entire financial worldview. For instance, there is the ever-constant theme that there is a “glut of savings” and that low consumer demand is the chief villain that stands opposed to economic stabilization. Martin Wolf, writes in The Financial Times:

…click on the above link to read the rest of the article…

Can We See a Bubble If We’re Inside the Bubble?

Can We See a Bubble If We’re Inside the Bubble?

We want this time to be different so badly, we can almost taste it.

If you visit San Francisco, you will find it difficult to walk more than a few blocks in central S.F. without encountering a major construction project. It seems that every decrepit low-rise building in the city has been razed and is being replaced with a gleaming new residential tower.

Parking lots have been ripped up and are now sprouting condos and luxury rental flats.

The influx of mobile/software tech into the S.F. Bay Area has triggered not just a boom in tech but in all the service sectors that cater to well-paid techies. This mass of new people has created traffic jams that last virtually all day and evening, and overloaded the area’s BART transit rail system such that trains at 11 pm are as jammed as any during rush hour.

This phenomenal building boom is truly something to behold, as it has spread from S.F. to the East Bay as workers priced out of S.F. move east across the Bay, driving up rents to near-S.F. levels.

This is of course a modern analog of the Gold Rush in the 1850s, and the previous tech/building boom in the late 1990s: an enormous influx of income drives a building boom and a mass influx of treasure-seekers, entrepreneurs, dreamers and those hoping to land a good-paying job in Boomland.

The same phenomenon has been visible in the Oil Patch states every time oil/gas skyrocket in price.

We know how every boom ends–in an equally violent bust. Yet in the euphoria of the boom, it’s easy to think this one will last longer than the others.

…click on the above link to read the rest of the article…

Are We Headed for Another Bust?

Are We Headed for Another Bust? 

Are We Headed for Another Bust?

On Wednesday December 16, 2015, Federal Reserve Bank policymakers raised the federal funds rate target by 0.25 percent to 0.5 percent for the first time since December 2008. There is the possibility that the target could be lifted gradually to 1.25 percent by December next year.

Federal Funds Rate Target

Fed policymakers have justified this increase with the view that the economy is strong enough and can stand on its own feet. “The Committee judges that there has been considerable improvement in labor market conditions this year, and it is reasonably confident the inflation will rise over the medium term to its 2 percent objective,” the Fed said in its policy statement.

Unwarranted Optimism

Various key economic indicators such as industrial production don’t support this optimism. The yearly growth rate of production fell to minus 1.2 percent in November versus 4.5 percent in November last year. According to our model the yearly growth rate could fall to minus 3.4 percent by August.

Although the yearly growth rate of the CPI rose to 0.5 percent in November from 0.2 percent in October according to our model the CPI growth rate is likely to visibly weaken.

The yearly growth rate is forecast to fall to minus 0.1 percent by April before stabilizing at 0.1 percent by December next year.

So from this perspective Fed policymakers did not have much of a case to tighten their stance.

%Chng US Industrial Production YOY

%Chng US CPI (YOY)
Fed policymakers seem to be of the view that the almost zero federal funds rate and their massive monetary pumping has cured the economy, which now seems to be approaching a path of stable economic growth and price stability, so it is held.

With this way of thinking the role of monetary policy is to make sure that the economy is kept at the “correct path” over time.

Following in Greenspan’s Footsteps

…click on the above link to read the rest of the article…

It Is Different This Time——–Now Comes The Global CapEx Depression

It Is Different This Time——–Now Comes The Global CapEx Depression

Caterpillar (CAT) posted a disastrous 16% decline in worldwide retail sales this morning, meaning that its sales have now fallen for 35 straight months. As Zero Hedge noted, not only did US retail sales finally rollover and drop by 8% compared to prior year, but the rest of the world was a veritable bath of yellow blood:

…….. sales elsewhere around the globe were a complete debacle: Asia/Pacific (mostly China) was down -28%, a dramatic drop from the -17% a month ago, EAME dropping -13%, and Latin America down -36%…

Needless to say, this is something new under the sun. CAT is the leading heavy capital goods supplier to the global construction and mining industries and has a long history of boom and bust.

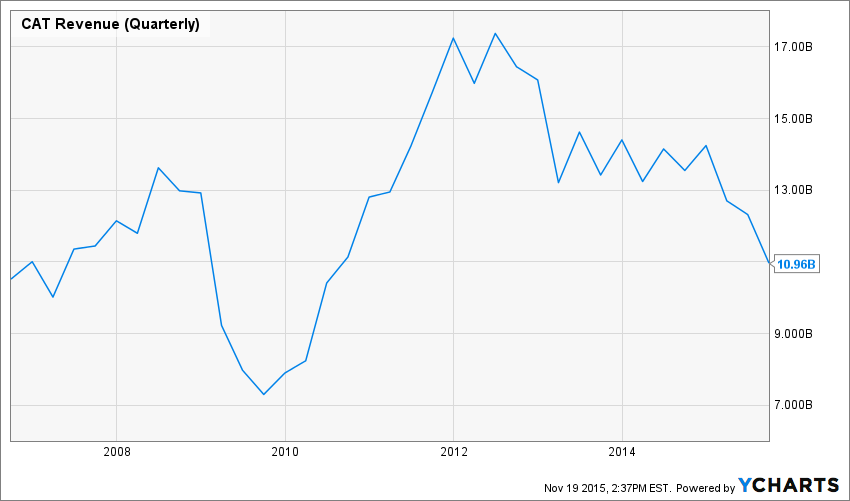
But CAT’s past contains nothing like what is conveyed in the graph below. The current 35 month plunge in its global sales is now nearly twice as long as the downturn in sales during the Great Recession, which was itself a modern record.

Indeed, CAT’s sales during the quarter ended in September had retraced all the way back to the September quarter of 2006. It is as if the massive tide of global capital spending that CAT has been riding for well more than a decade is heading back out to sea.
CAT Revenue (Quarterly) Chart

CAT Revenue (Quarterly) data by YCharts

In fact, it is. The flip-side of the massive commodities boom since the turn of the century is CapEx.

That is, the tremendous increase in demand for iron ore, copper, zinc, nickel, aluminum and hydrocarbons was mainly driven by a massive one-time build-out of industrial infrastructure for mining, manufacturing, transportation and distribution—–along with related public facilities such as roads, bridges, ports, rails and airports—- in China and the EM.

…click on the above link to read the rest of the article…

Can We Afford the Future?

Can We Afford the Future?

Broken road image via shutterstock. Reproduced at Resilience.org with permission.

As a child of the 1950s I grew up immersed in a near-universal expectation of progress. Everybody expected a shiny new future; the only thing that might have prevented us from having it was nuclear war, and thankfully that hasn’t happened (so far). But, in the intervening decades, progress has begun to lose its luster. Official agencies still project economic growth as far as the eye can see, but those forecasts of a better future now ring hollow.

Why? It’s simple. We can’t afford it.

To understand why, it’s helpful to recall how the present got to be so much grander (in terms of economic activity) than the past. Much of that story has to do with fossil fuels. Everything we do requires energy, and coal, natural gas, and oil provided energy that was cheap, abundant, concentrated, and easily stored and transported. Once we figured out how to get these fuels out of the ground and use them, we went on history’s biggest joy ride.

But fossil fuels are depleting non-renewable resources, and are therefore subject to declining resource quality. Oil is the most economically important of the fossil fuels, and depletion is already eating away at expectations of further petroleum-fed progress. During the past decade, production rates for conventional oil—the stuff that fueled the economic extravaganza of the 20th century—have stalled out and are set to drop (according to the IEA’s latest forecast). Between 2004 and 2014, the oil industry’s costs for exploration and production rose at almost 11 percent per year.  The main bright spot in the oil world has been growing production of unconventional oil—specifically tight oil in North America associated with the fracking boom. But now that boom is going bust.

…click on the above link to read the rest of the article…

The Commodity Roller Coaster

The Commodity Roller Coaster

CAMBRIDGE – The global commodity super-cycle is hardly a new phenomenon. Though the details vary, primary commodity exporters tend to act out the same story, and economic outcomes tend to follow recognizable patterns. But the element of predictability in the path of the commodity-price cycle, like that in the course of a roller coaster, does not make its twists and turns any easier to stomach.

Since the late eighteenth century, there have been seven or eight booms in non-oil commodity prices, relative to the price of manufactured goods. (The exact number depends on how peaks and troughs are defined.) The booms typically lasted 7-8 years, though the one that began in 1933 spanned almost two decades. That exception was sustained first by World War II and then by the post-war reconstruction of Europe and Japan, as well as rapid economic growth in the United States. The most recent boom, which began in 2004 and ended in 2011, better fits the norm.

Commodity-price busts – with peak-to-trough declines of more than 30% – have a similar duration, lasting about seven years, on average. The current bust is now in its fourth year, with non-oil commodity prices (relative to the export prices of manufactures) having so far fallen about 25%.

Commodity-price booms are usually associated with rising incomes, stronger fiscal positions, appreciating currencies, declining borrowing costs, and capital inflows. During downturns, these trends are reversed. Indeed, since the current slump began four years ago, economic activity for many commodity exporters has slowed markedly; their currencies have slid, after nearly a decade of relative stability; interest-rate spreads have widened; and capital inflows have dried up.

Just how painful the downturn turns out to be depends largely on how governments and individuals behave during the bonanza.

…click on the above link to read the rest of the article…
The Global Test Most Will Fail: Surviving the Bust That Inevitably Follows a Boom

The Global Test Most Will Fail: Surviving the Bust That Inevitably Follows a Boom

Now that virtually every nation is entering the bust phase, all are being tested.
Booms powered by credit, new markets and speculation are followed by busts as night follows day. This creates a very difficult test for every nation-state facing the inevitable bust: how does the leadership deal with the end of the boom?
As the world is about to learn once again, the “fix” may make the next bust even more destructive.
the “fix” may make the next bust even more destructive.
let’s start by reviewing what conditions generate booms.
1. An undeveloped nation gains access to new credit, markets and resources and go through a “boost phase” much like a rocket lifting off when suddenly abundant finance capital ignites the country’s latent growth potential. When a country with little to no public or private debt suddenly gains access to essentially unlimited capital, growth explodes.
One variant of this is the discovery of vast new resources that quickly attract capital (for example, oil) or that generate new wealth (for example, gold).
The modern example of a developing nation gaining access to new credit, markets and resources is of course China, but this model also describes America in the 1790s and early 1800s, and many other nations in various phases of their development.
2. A new sector opens up in a developed nation’s economy. A recent example is the Internet, which exploded in a boost phase from 1995 to 2000. In these cases, the new sector simply didn’t exist, and the boost phase is as spectacular as the ones in newly developing economies.
Example from American history include the railroad-fueled boom of the 1870s and 1880s and the advent of electric light and later, radio.

…click on the above link to read the rest of the article…

Here Comes the Next Global Recession

Here Comes the Next Global Recession

shutterstock_243271804

It might seem peculiar to some people to talk about the ‘next’ global recession, given that it doesn’t feel like we ever really got out of the last one. Eight years on from the global financial crash we find that the global economy is still drowning in debt, and this new era of low economic growth, high unemployment and squeezed wages/conditions has somehow become normalised.

‘Secular stagnation’ is the description de jure of the global capitalist system’s inability to return to another bout of prosperity. But while our old friend Boom departed the stage some time ago, his unruly brother Bust is waiting in the wings, preparing to make an unwelcome return.

Well that’s according to some of the world’s major financial institutions which have been forecasting that 2016 will be the year of the next big global downturn. In the last fortnight the IMF reduced its global growth forecast to 3.1%, that’s a mere 0.1% over the threshold of what constitutes recession. While last month Daiwa – Japan’s second largest brokerage house – and Citibank both released reports in which they made a global financial meltdown in 2016 their baselinescenarios! Let that sink in for a minute; they’re not saying a meltdown next year is their worst case scenario, they’re saying it’s their assumed one!

So what could trigger this predicted crash? Well to echo the words of Yogi Bear, ‘It’s tough to make predictions, especially about the future’. Nevertheless there is general agreement that debt was the trigger for the crash of 2008. Considering that today the global economy is even deeper in the debt mire, it requires no great leap of faith to believe that debt will be central to the coming crisis.

…click on the above link to read the rest of the article…

Austrian Economics, Monetary Freedom, and America’s Economic Roller Coaster

Austrian Economics, Monetary Freedom, and America’s Economic Roller Coaster

For over a decade, now, the American economy has been on an economic rollercoaster, of an economic boom between 2003 and 2008, followed by a severe economic downturn, and with a historically slow and weak recovery starting in 2009 up to the present.
Before the dramatic stock market decline of 2008-2009, many were the political and media pundits who were sure that the “good times” could continue indefinitely, including some members of the Board of Governors of the Federal Reserve, America’s central bank.
When the economic downturn began and then worsened, many were the critics who were sure that this proved the “failure” of capitalism in bringing such financial and real economic disruption to America and the world.
There were resurrected long questioned or rejected theories from the Great Depression years of the 1930s that argued that only far-sighted and wise government interventions and regulations could save the country from economic catastrophe and guarantee we never suffer from a similar calamity in the future.
The Boom-Bust Cycle Originates in Government Policy
Not only is the capitalist system not responsible for the latest economic crisis, but all attempts to severely hamstring or regulate the market economy out of existence only succeeds in undermining the greatest engine of economic progress and prosperity known to mankind.
The recession of 2008-2009 had its origin in years of monetary mismanagement by the Federal Reserve System and misguided economic policies emanating from Washington, D.C. For the five years between 2003 and 2008, the Federal Reserve flooded the financial markets with a huge amount of money, increasing it by 50 percent or more by some measures.
For most of those years, key market rates of interest, when adjusted for inflation, were either zero or even negative. The banking system was awash in money to lend to all types of borrowers. To attract people to take out loans, these banks not only lowered interest rates (and therefore the cost of borrowing), they also lowered their standards for credit worthiness.

– See more at: http://www.cobdencentre.org/2015/09/austrian-economics-monetary-freedom-and-americas-economic-roller-coaster/#sthash.9t8SoY2D.dpuf

Why The Recurring Economic Crises?

Why The Recurring Economic Crises?

Authored by Murray Rothbard via The Mises Institute,

A selection from Chapter 42 of Economic Controversies.

Why, then, does the business cycle recur? Why does the next boom-and-bust cycle always begin? To answer that, we have to understand the motivations of the banks and the government. The commercial banks live and profit by expanding credit and by creating a new money supply; so they are naturally inclined to do so, “to monetize credit,” if they can. The government also wishes to inflate, both to expand its own revenue (either by printing money or so that the banking system can finance government deficits) and to subsidize favored economic and political groups through a boom and cheap credit. So we know why the initial boom began. The government and the banks had to retreat when disaster threatened and the crisis point had arrived. But as gold flows into the country, the condition of the banks becomes sounder. And when the banks have pretty well recovered, they are then in the confident position to resume their natural tendency of inflating the supply of money and credit. And so the next boom proceeds on its way, sowing the seeds for the next inevitable bust.

Thus, the Ricardian theory also explained the continuing recurrence of the business cycle. But two things it did not explain.

First, and most important, it did not explain the massive cluster of error that businessmen are suddenly seen to have made when the crisis hits and bust follows boom. For businessmen are trained to be successful forecasters, and it is not like them to make a sudden cluster of grave error that forces them to experience widespread and severe losses.

Second, another important feature of every business cycle has been the fact that both booms and busts have been much more severe in the “capital goods industries” (the industries making machines, equipment, plant or industrial raw materials) than in consumer goods industries.And the Ricardian theory had no way of explaining this feature of the cycle.

…click on the above link to read the rest of the article…

5 signs of trouble for Saskatchewan’s economy in oil slump

5 signs of trouble for Saskatchewan’s economy in oil slump

Many said province could withstand economic blows from oil and gas, but there are troubling signs

When crude oil prices began to plummet, economists comforted Saskatchewan residents that their diversified economy would safeguard them during the oil and gas slump.

In fact, Saskatchewan’s economy isn’t that diverse.

The province relies heavily on natural resources: fuel, food and fertilizer.

fi-oil-pump-jacks-sask

The Canadian Association of Oil Drilling Contractors forecasts it will drill half as many wells in 2015 compared to 2014.

And while economists were banking on the agriculture and potash industries to offset energy losses, they’re no longer confident that will happen.

The potash industry remains strong in production, on par with its growth last year, but nitrogen prices have fallen about $60 US a tonne.

Most worrisome, it’s shaping up to be a disappointing crop year for many Saskatchewan farmers, thanks to an unwelcome mixture of spring frost, drought and poorly timed rains.

While cattle prices remain high, drought has jeopardized hay yields and could force some ranchers to sell off their herd.

The Bank of Montreal has already downgraded its growth projection for Saskatchewan this year from one per cent to half a per cent.

“It’s disappointing,” chief economist at the Bank of Montreal, Douglas Porter, said. “The likelihood of a pretty tough crop this year further dims the outlook for western Canada.”

The Royal Bank of Canada told CBC News it expects to downgrade its growth projection next month as well.

Premier Brad Wall says he’s still confident the province can overcome economic pressures, and points to his government’s four-year plan to spend $5.8 billion on infrastructure.

Still, there are already red flags for the economy. Here are five signs of trouble:

1. Housing sales

The honeymoon is over for Saskatchewan’s housing boom.

The Canadian Real Estate Association predicts house sales in Saskatchewan will decline by nearly 13 per cent this year.


…click on the above link to read the rest of the article…

URGENT WARNING: 6 Signs the Great Crash Is Upon Us!

URGENT WARNING: 6 Signs the Great Crash Is Upon Us!

The Greek default proves that all this endless quantitative easing idiocy couldn’t live up to the promises. It has proved unable to create sustainable long-term recoveries in highly indebted developed countries with poor demographic trends.

The Greek parliament caved into totally repulsive demands, as I said on Monday that it would. They did it out of stark fear of the chaos a Grexit would bring before free market forces resolved their trade and budget imbalances.

I don’t believe they did the right thing. From the looks of the discontent on the ground, many Greeks don’t either. Be that as it may, this can has been kicked just a little further down the road, yet again.

But the whole mess made investors nervous. As did the recent collapse of China’s stock market which just added to the growing concerns.

Investors are right to worry. I’ve been saying for years that the greatest trigger would be the bursting of the massive, unprecedented China bubble.

How can it not?!

Its stock market soared 159% in less than a year. It gained 30% in justtwo months!

Then its stocks took a nose dive, losing 35% in less than 30 days.

Understand that if China’s stock market had lost just 20%, it would have meant nothing. But, as I’ve always said, a drop of 30% to 40% in short order is a clear sign of a first wave down in a major bust. That’s why I’m always telling you to rather be safe than sorry. If you don’t follow a reliable, proven investment strategy – like any of our premium research services, from Boom & Bust, Cycle 9 Alert, Max Profit Alert, BioTech Intel Trader, Triple Play Strategy and Dent Digest Trader – waiting passively for that extra 1% or even 5% is like playing Russian Roulette.

…click on the above link to read the rest of the article…


Three Reasons Why US Shale Isn’t Going Anywhere

Three Reasons Why US Shale Isn’t Going Anywhere

Have you ever noticed that during extreme economic cycles, when trends are roaring on the upside, or conversely crashing back down to earth, there often appears an air of extremism in news headlines? Take America’s most recent shale oil boom, and bust, for example. On the way up, you may have seen – Why OPEC Could Be Dead in 10 Years. Conversely, now you may have read, Why It Might Be ‘Game Over For The Fracking Boom’.

In the end, the answer lies somewhere in-between. OPEC, although often plagued with internal discord, will still remain the global defacto 900-pound gorilla of crude, and US producers will continue to find ways to crack shale rock cheaper and more efficiently, immunizing themselves to nail-biting commodity roller coaster dips like what was just experienced. And in 2008 (-55%). And in 2001 (-32%). And in 1998 (-38%)….

BP, in its recently-released “Energy Outlook 2035”, predicts OPEC’s market share will return to approximately 40 percent of global demand within 15 years, up from 33 percent today, which is what all this fuss is about anyway.

Related: No Real Oil Price Relief Until Q3

Here are 3 reasons why America’s shale will continue to produce going forward:

1. Oil companies, both large and small, have seen what is possible.

In 2004, Texas oilman George Mitchell made hydraulic fracture stimulation commercially viable by unlocking the right combination of water pressure and lubricants to allow oil and gas to predictably flow from dense shale to the wellbore. A decade ago, producers believed shale held vast oil and gas resources, but to what extent they could be developed had not been determined. Until now.


…click on the above link to read the rest of the article…

Japan Is Writing History As A Prime Boom And Bust Case | Gold Silver Worlds

Japan Is Writing History As A Prime Boom And Bust Case | Gold Silver Worlds.

Recently, we wrote a paper about the dynamics behind the boom and bust cycles, based on the view of the Austrian School (the Austrian Business Cycle Theory, or ABCT). The key takeaway was that central banks don’t help in smoothing the amplitude of the cycles, but rather are the cause of cycles.

Business cycles are a direct result of excessive credit flow into the market, facilitated by an intentionally low interest rate set by the government.

The problem with ongoing monetary policies is that the excessive money supply sends the wrong signals to the market, which ultimately leads to misallocation of investments or ‘malinvestments’.

On the one hand, entrepreneurs invest more and increase the depth of the production process. On the other hand, consumers spend more as saving becomes unattractive. When the excess products created through the cheap money-induced investments reach the market, consumers are unable to buy them due to the lack of prior savings. At this point the bust occurs.

It is key to understand that by manipulating interest rates (particularly by lowering them), central banks create bubbles that end in busts.

Japan is an excellent case study depicting the scenario discussed by the Austrian Business Cycle Theory (ABCT). In this article, we will examine the course of the economic and monetary situation in Japan from the ABCT’s point of view.

…click on the above link to read the rest of the article…

Olduvai IV: Courage
Click on image to read excerpts

Olduvai II: Exodus
Click on image to purchase

Click on image to purchase @ FriesenPress