

OPEC August Production Data
Data for the OPEC charts below are from the OPEC Monthly Oil Market Report. All OPEC data are through August 2018 and in thousand barrels per day.
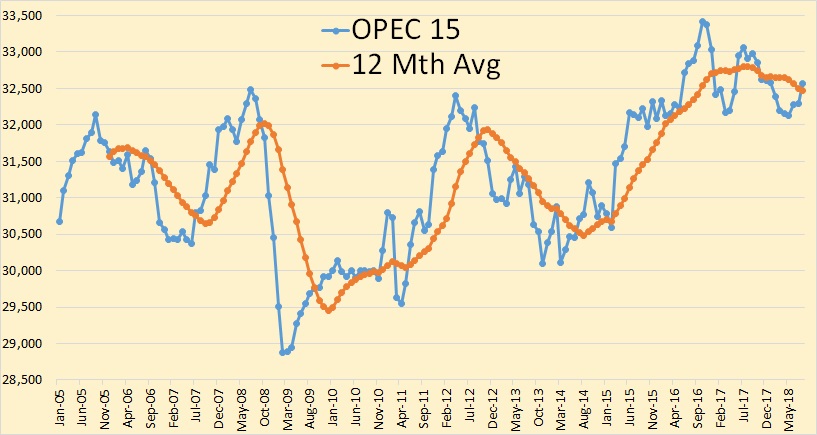
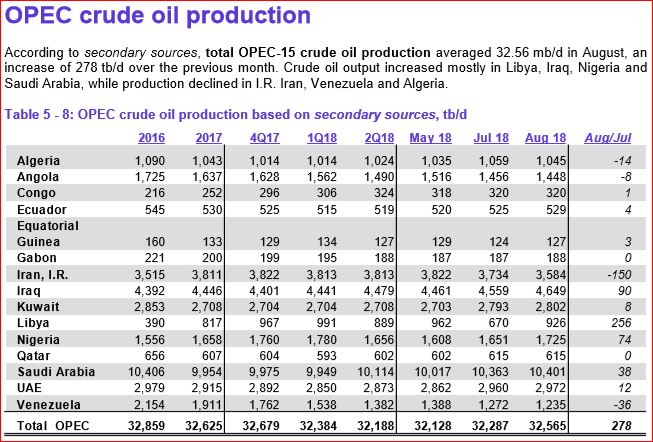
OPEC 15 crude only production was up 278,000 barrels per day in August to 32,565,000 bpd. Most of that increase was Libya, up 256,000 bpd.
July OPEC production was revised down 38,000 barrels per day.
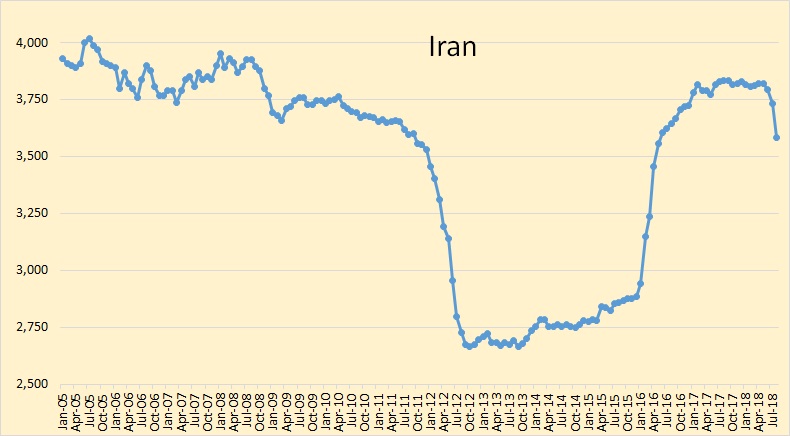
Sanctions are beginning to have an affect on Iranian production.
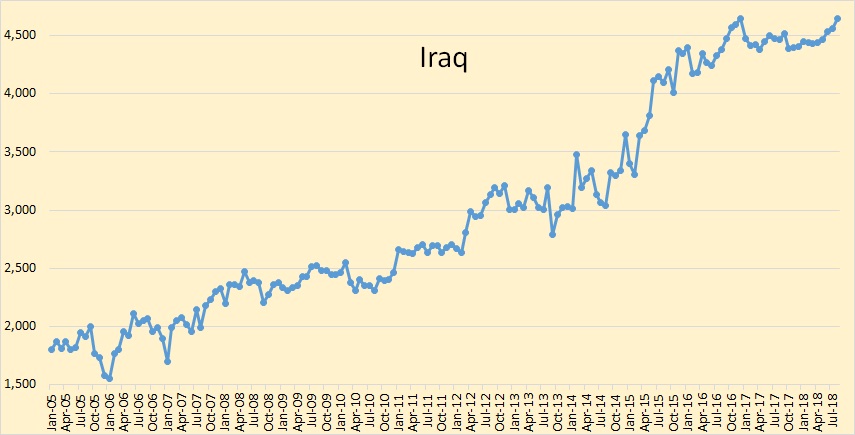
Iraq reached a new high in August, but just barely. They had 4,649,000 bpd. Their previous high was 4,642,000 bpd in December 2016.
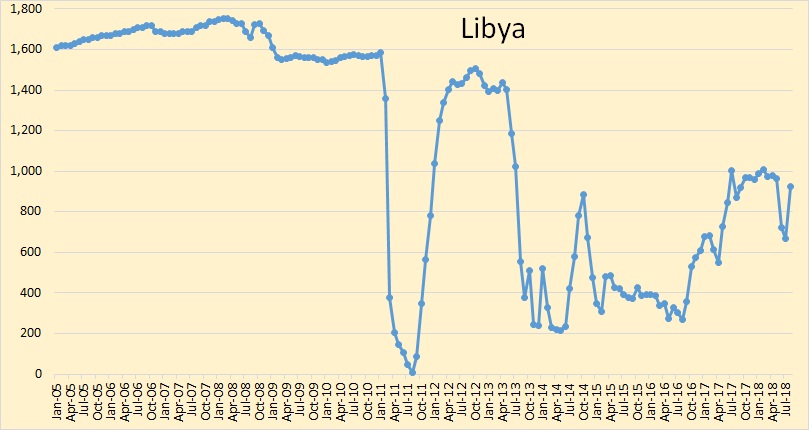
Libya was the big gainer in August, up 256,000 bpd to 926,000 bpd. They are still fighting rebels however. They will likely be down slightly in September.
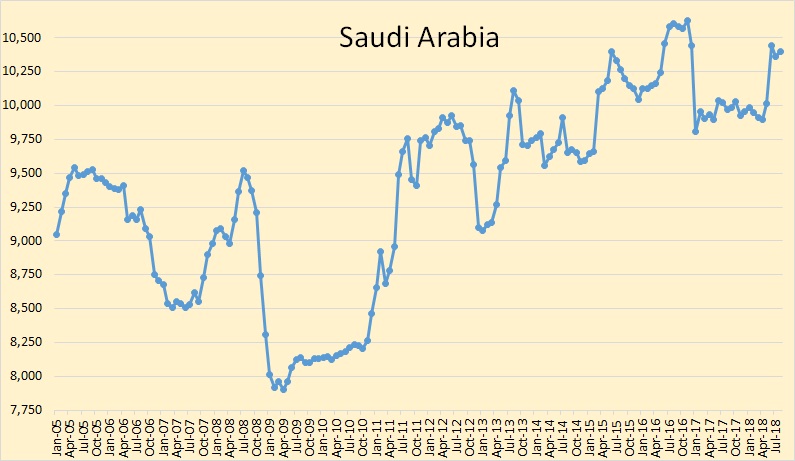
I think Saudi Arabia will hold pretty close to this level for awhile now.
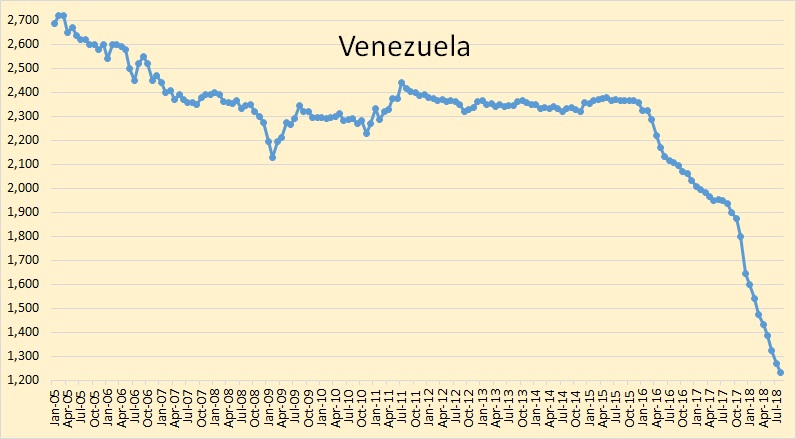
Venezuela’s decline continues. They are now over 1,100,000 barrels per day from their average in 2015.
…click on the above link to read the rest of the article…

