Home » Posts tagged 'margin debt'

Tag Archives: margin debt

Olduvai
Click on image to purchase

Olduvai III: Catacylsm
Click on image to purchase

Post categories

Post Archives by Category

Stock Market Leverage Spikes in Historic Manner: Another WTF Chart of a Zoo that Has Gone Nuts

Stock Market Leverage Spikes in Historic Manner: Another WTF Chart of a Zoo that Has Gone Nuts

In an investment environment where nothing matters anymore – until it suddenly does.

In the current craze that encompasses everything from sneakers and NFTs to stocks, where valuations don’t matter because of widespread certainty that valuations will be even greater in a few days, and where folks are chasing lottery-type returns, supported by the Fed’s interest rate repression and $3 trillion in asset purchases, and by the government’s trillions of dollars of handouts and bailouts – well, in this perfect world, there is a fly in the ointment: Vast amounts of leverage, including stock market leverage.

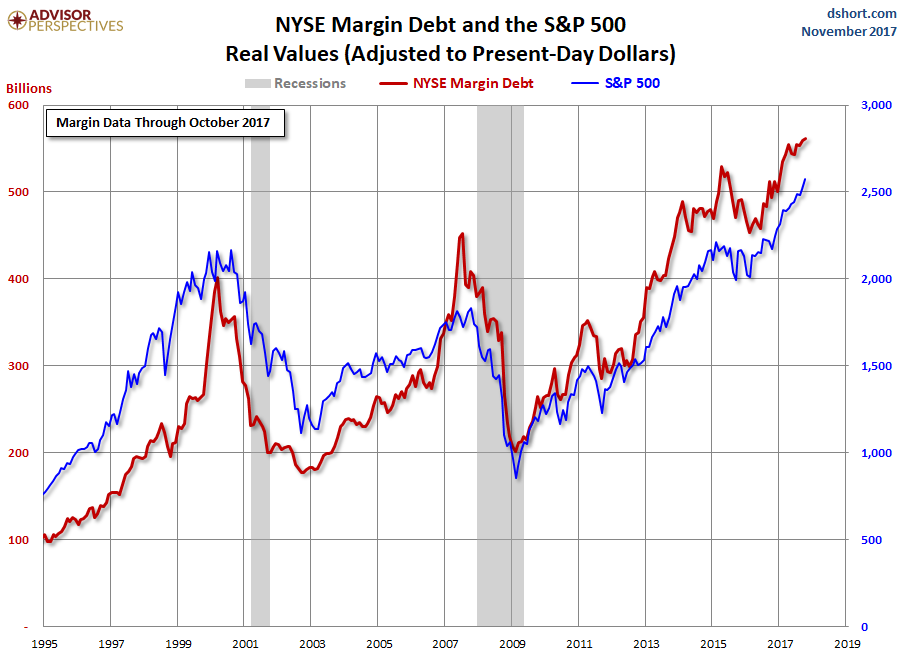
Margin debt – the amount that individuals and institutions borrow against their stock holdings as tracked by FINRA at its member brokerage firms – is just one indication of stock market leverage. But FINRA reports it monthly. Other types of stock market leverage are not reported at all, or are disclosed only piecemeal in SEC filings by brokers and banks that lend to their clients against their portfolios, such as Securities-Based Loans (SBLs). No one knows how much total stock market leverage there is. But margin debt shows the trend.

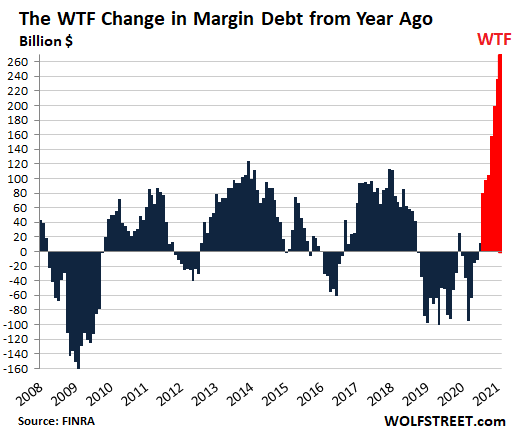
In February, margin debt jumped by another $15 billion to $813 billion, according to FINRA. Over the past four months, margin debt has soared by $154 billion, a historic surge to historic highs. Compared to February last year, margin debt has skyrocketed by $269 billion, or by nearly 50%, for another WTF sign that the zoo has gone nuts:

But margin debt is not cheap, especially smaller amounts. For example, Fidelity charges 8.325% on margin balances of less than $25,000 – in an environment where banks, money market accounts, and Treasury bills pay near 0%. Margin debt gets cheaper for larger balances, an encouragement to borrow more. For margin debt of $1 million or more, the interest rate at Fidelity drops to 4.0%

…click on the above link to read the rest of the article…


Introducing the “Everything Bubble” Sentiment-o-Meter

Introducing the “Everything Bubble” Sentiment-o-Meter

Since human wetware remains stuck in OS1.01, we can predict a remarkable reversal.

The “Everything Bubble” has been a sight to behold. With central banks providing trillions to the big players and margin debt enabling small punters to leverage up, the hot money rotation has been a real merry-go-round as one asset and sector after another is ignited by a massive flood of money seeking a quick return.

Once the hot sector has been slingshot to absurd heights, the hot money abandons it in favor of whatever hasn’t been shot into orbit.

Bat guano is the new Tesla–or maybe it’s Beanie Babies pulled out of attics, or sand. The sand index could be the next moonshot, who knows?

There’s an interesting self-referential, self reinforcing dynamic in manic bubbles. As everyone sees other “regular folks” scoring massive gains from doing nothing but buying what everyone else is buying, the temptation to join the orgy of easy money becomes irresistible.

This new money adds momentum to the hot-money rotation, accelerating the moves and the gains. In other words, the easy money just keeps getting easier.

This feeds an irresistible compulsion to leverage up–to borrow money and throw it into the 100% guaranteed-to-rise market. Once debt has been maxxed out, then punters discover options and leveraged ETFs as avenues to increase the 100% guaranteed gains.

To chart this self-reinforcing momentum in sentiment and hot money, I’ve prepared this “Everything Bubble” Bubble-o-Meter. Clearly, we’re at the very top: there’s no fear except of missing out. Buy the dip has yielded 100% guaranteed returns, with the proviso that the more you”invest” (heh), the more you make, and the more leverage you take on, the greater your gains.

…click on the above link to read the rest of the article…

No One Gets Out Of Here Alive

NO ONE GETS OUT OF HERE ALIVE

“The seasons of time offer no guarantees. For modern societies, no less than for all forms of life, transformative change is discontinuous. For what seems an eternity, history goes nowhere – and then it suddenly flings us forward across some vast chaos that defies any mortal effort to plan our way there. The Fourth Turning will try our souls – and the saecular rhythm tells us that much will depend on how we face up to that trial. The saeculum does not reveal whether the story will have a happy ending, but it does tell us how and when our choices will make a difference.”  – Strauss & Howe – The Fourth Turning

As we wander through the fog of history in the making, unsure who is lying and who is telling the truth, seemingly blind to what comes next, I look to previous Fourth Turnings for a map of what might materialize during the 2nd half of this current Fourth Turning. After a tumultuous, harrowing inception to this Crisis in 2008/2009, we have been told all is well and are in the midst of an eleven-year economic expansion, with the stock market hitting all-time highs.

History seemed to stop and we’ve been treading water for over a decade. Outwardly, the establishment has convinced the masses, through propaganda and money printing, the world has returned to normal and the future is bright. I haven’t bought into this provable falsehood. Looking back to the Great Depression, we can get some perspective on our current position historically.

The Dow is up 450% since its 2009 low, which is the metric used by the establishment to prove their money printing solutions have succeeded in lifting the country from the depths of despair and depression.

…click on the above link to read the rest of the article…

Stock-Market Margin Debt Plummets Most Since Q4 2008

Stock-Market Margin Debt Plummets Most Since Q4 2008

Wow, that was fast. Margin calls.

During the ugly stock-market December, whose ugliness bottomed out on Christmas Eve, a nasty November, and the ugliest October anyone can remember, margin debt plunged by a combined $93.8 billion, the most since Q4 2008, after Lehman Brothers filed for bankruptcy.

In December alone, margin debt plunged by $38.3 billion, to $554.3 billion, FINRA (Financial Industry Regulatory Authority) reported this morning. This was just a hair less than October’s plunge of $40.5 billion, and both had been the steepest drops since late 2008:

The only form of stock market leverage that is reported monthly is “margin debt” – the amount individual and institutional investors borrow from their brokers against their portfolios. But no one knows the amount of total stock-market leverage from all forms of leverage, but we know it’s a lot higher than margin debt by itself.

Stock market leverage takes many forms. It includes “securities-based loans” (SBLs) that brokers extend to their clients, and that some of them report annually, though they don’t have to. And occasionally, we get a tidbit about an individual fiasco such as when a $1.6 billion SBL to just one guy blows up. And there are other ways to use leverage to fund stock holdings, including loans at the institutional level, loans by companies to their executives to buy the company’s shares, etc. But reported margin debt gives us a feel for which direction overall stock-market leverage is going.

Stock market leverage is the big accelerator on the way up, when people and institutions borrow money to buy stocks. And it’s the big accelerator on the way down when margin calls and other financial pressures turn these investors into forced sellers. The money from the proceeds of those stock sales doesn’t then sit on the sidelines or go into other stock purchases…

…click on the above link to read the rest of the article…

Stock-Market Margin Debt Plunges Most Since Lehman Moment

Stock-Market Margin Debt Plunges Most Since Lehman Moment

It gets serious. Margin calls?

No one knows what the total leverage in the stock market is. But we know it’s huge and has surged in past years, based on the limited data we have, and from reports by various brokers about their “securities-based loans” (SBLs), and from individual fiascos when, for example, a $1.6 billion SBL to just one guy blows up. There are many ways to use leverage to fund stock holdings, including credit card loans, HELOCs, loans at the institutional level, loans by companies to its executives to buy the company’s shares, or the super-hot category of SBLs, where brokers lend to their clients. None of them are reported on an overall basis.

The only form of stock market leverage that is reported monthly is “margin debt” – the amount individual and institutional investors borrow from their brokers against their portfolios. Margin debt is subject to well-rehearsed margin calls. And apparently, they have kicked off.

In the ugliest stock-market October anyone can remember, margin debt plunged by $40.5 billion, FINRA (Financial Industry Regulatory Authority) reported this morning – the biggest plunge since November 2008, weeks after Lehman Brothers had filed for bankruptcy:

During the stock market boom since the Financial Crisis, this measure of margin debt has surged from high to high, reaching a peak in May 2018 of $669 billion, up 60% from the pre-Financial Crisis peak in July 2007, and up 117% since January 2012. Since the peak in May, margin debt has dropped by $62 billion (-9.2%). Note the $40.5-billion plunge in October:

In the two-decade scheme of things, the relationship between stock market surges and crashes and margin debt becomes obvious.

Back during the dot-com bubble, dot-com stocks, traded mostly on the Nasdaq, included what today are booming survivors like Amazon [AMZN], barely hangers-on like RealNetworks [RNWK], or goners like eToys.

…click on the above link to read the rest of the article…

BLINKING RED BUBBLE LIGHT: Stock Market Investor Margin Debt Reaches New High

BLINKING RED BUBBLE LIGHT: Stock Market Investor Margin Debt Reaches New High

The world is standing at the edge of the financial abyss while most investors are entirely in the dark.  However, specific indicators suggest the market is one giant RED BLINKING LIGHT.  One of these indicators is the amount of margin debt held by investors.  What is quite surprising about the level of investor margin debt is that it has hit a new record high even though the market has sold off 2,500 points from its peak in February.

It seems as if investors no longer believe in market cycles or fundamentals. Instead, the Wall Street saying that “This time is different” has become permanently ingrained in the market psychology.  For example, it doesn’t seem to matter to the market that Amazon makes no money on its massive online retail business.  The only segment of Amazon’s business that made a decent profit last quarter was from its Cloud hosting services.

So, the new Amazon way of doing business in the United States is to destroy the retail industry so it can break even.  I gather once many of the retail chains have gone out of business; Amazon might then increase its prices and shipping costs.  But for now, the mighty online retail chain is firmly entrenched in the U.S. RETAIL CANNIBALIZATION mode.

Unfortunately, if Amazon is successful in destroying a significant portion of the brick and mortar retail industry, it will spell bad news for Americans when the next financial collapse takes place.   Why?  Well, the simple answer is that we can’t go backward.  Think about this for a moment.

…click on the above link to read the rest of the article…

How the Asset Bubble Could End – Part 2

Contradictory Signals

Special antennae that help traders catch upcoming opportunities. Available from the same outfit that sells the soup-cooling spoon (Acme Inc).

There is just one more positioning indicator we want to mention: after surging by around $126 billion since March of 2016, NYSE margin debt has reached a new all time high of more than $561 billion. The important point about this is that margin debt normally peaks well before the market does. Based on this indicator, one should not expect major upheaval anytime soon. There are exceptions to the rule though – see the caption below the chart.

A new all-time high in NYSE margin debt: this is in line with the other indicators shown here, and normally margin debt tends to peak before the market does. This is generally true – but not always.  We found two major market peaks – namely the 1937 and 1973 tops – when margin debt peaked after the market had topped out. In 1937 it happened just one month after the top, in 1973 it happened 8 months after the top. Note also that at the 1937 market peak, there was no warning from the NYSE advance-decline line either – it topped almost concurrently with prices – click to enlarge.

Since we discussed bubble blow-offs earlier this year (see: Speculative Blow-Offs in Stock Markets, Part 1 and Part 2), we have pointed out several times that an unusual number of diverging signals could be observed this year. And many signals we would normally expect to have appeared on the horizon by now are simply not in sight yet.

Consider for instance this chart from Moody’s, which we showed in one of our articles on credit spreads. It depicts debt as a percentage of internal company funds compared to actual and expected default rates. It is logical that these tend to be highly correlated, and yet, they are suddenly diverging rather noticeably.

…click on the above link to read the rest of the article…

Stock Market Lazes Happily on a Powerful Time Bomb, and the Fed Begins to Worry

Stock Market Lazes Happily on a Powerful Time Bomb, and the Fed Begins to Worry

Pointing at “excesses,” “distortions,” and “imbalances.”

Margin debt in the stock market hit another record, $561 billion at the end of October, up 16% from a year ago, the New York Stock Exchange reported on Tuesday. Margin debt and the stock market move together. And even on an inflation-adjusted basis, the surge has been breath-taking.

This chart shows margin debt (red line, left scale) and the S&P 500 (blue line, right scale), both adjusted for inflation to tune out the effects of the dwindling value of the dollar over the decades (chart by Advisor Perspectives):

Stock market leverage is the big accelerator on the way up. Leverage supplies liquidity that has been freshly created by the lender. This isn’t money moving from one asset to another. This is money that is being created to be plowed into stocks. And when stocks sink, leverage becomes the big accelerator on the way down. When stocks are dumped to pay down margin debt, the money from those stock sales doesn’t go into another asset and doesn’t sit around as cash ready to be deployed and it doesn’t go into gold bars either. It just disappears.

Even the Fed is now worried about margin debt and a slew of other factors not related to consumer price inflation but to assets, asset prices, and debt.

The latest was Dallas Fed President Robert Kaplan on Monday who, in discussing financial and economic imbalances, specifically addressed the “record-high levels” of margin debt.

His premise is that “there are costs to accommodation in the form of distortions and imbalances,” and when “excesses ultimately need to be unwound, this can result in a sudden downward shift in demand for investment and consumer-related durable goods.” Kaplan:

…click on the above link to read the rest of the article…

Short Squeeze, Liquidity, Margin Debt and Deflation

Short Squeeze, Liquidity, Margin Debt and Deflation

Some things you CAN see coming, in life and certainly in finance. Quite a few things, actually. Once you understand we’re on a long term downward path, also both in life and in finance, and you’re not exclusively looking at short term gains, it all sort of falls into place. The only remaining issue then is that so many of you DO look at short term gains only. Thing is, there’s no way out of this thing but down, way down.

Yeah, stock markets went up quite a bit last week. Did that surprise you? If so, maybe you’re not in the right kind of game. You might be better off in Vegas. Better odds and all that. From where we’re sitting, amongst the entire crowd of its peers, this was a major flashing red alarm late last week, from Investment Research Dynamics:

September Liquidity Crisis Forced Fed Into Massive Reverse Repo Operation 

Something occurred in the banking system in September that required a massive reverse repo operation in order to force the largest ever Treasury collateral injection into the repo market. Ordinarily the Fed might engage in routine reverse repos as a means of managing the Fed funds rate. However, as you can see from the graph below, there have been sudden spikes up in the amount of reverse repos that tend to correspond the some kind of crisis – the obvious one being the de facto collapse of the financial system in 2008. You can also see from this graph that the size of the “spike” occurrences in reverse repo operations has significantly increased since 2014 relative to the spike up in 2008. In fact, the latest two-week spike is by far the largest reverse repo operation on record.

…click on the above link to read the rest of the article…

The Margin Debt Time-Bomb

The Margin Debt Time-Bomb

A terrible threat created by terrible decision-making

What is perhaps the greatest risk to individual investors these days?

Is it the potential for a decline in corporate earnings based on a slowing global economy?  Is it that current valuation levels in both equities and fixed income instruments are much nearer historic highs than not? Is the biggest risk a US Fed that will soon raise interest rates for the first time in close to a decade?

Although all of these are specific investment risks we face in the current cycle, my contention is that the single largest risk to investors is a risk that has been present since the beginning of what we have come to know as modern financial markets.  The single largest risk to investors is themselves.  By that, I mean the influence of human emotion and psychology in decision making.

We Are Our Own Worst Enemies

After many years of managing through market cycles, it seems pretty clear to me that humans are uniquely wired incorrectly for long-term investment success.  When asset prices double, we want those assets twice as bad. When asset prices drop in half, we want nothing to do with them. Isn’t this exactly what we saw in US residential real estate markets a decade ago?  Isn’t this what we experienced with the rise in dot-com stocks in 1999 and their demise over the three following years?  Human decision making shapes the rhythmic bull and bear market character of asset prices. We know the two most prominent emotions that drive markets higher and lower are those of fear and greed.


If we turn the clock back far enough in early human history, we know that humans ran in packs.  Strength and protection was found in a pack or herd.  It was when humans ventured away from the protection of the herd (consensus thinking) that they were physically vulnerable.  The fight or flight mechanism has been an integral part of human development over time.

…click on the above link to read the rest of the article…

How Much More Extreme Can Markets Get?

How Much More Extreme Can Markets Get?

These charts help us understand that a top is not just price, but a reversal in extremes of margin debt, valuation and sentiment.

In blow-off tops, extremes of valuation, complacency and margin debt can always shoot beyond previous extremes to new extremes. This is why guessing when the blow-off top implodes is so hazardous: extreme can always get more extreme.

Nonetheless, extremes eventually reverse, and generally in rough symmetry with their explosive rise. Exhibit 1 is margin debt: NYSE Margin Debt Hits a New Record High (Doug Short)

Note the explosive rise in margin debt in the past few months:

At tops, soaring margin debt no longer pushes stocks higher. I’ve marked up an excellent chart by Doug Short to highlight the diminishing returns of more margin debt at tops.

It’s clear this same dynamic of diminishing returns is in play now, as margin debt has skyrocketed while the S&P 500 has remained range-bound, with each new high being increasingly marginal.

Exhibit 2 is China’s Shenzhen stock exchange. The price-earnings ratio (PE) is a useful gauge of sentiment: when sentiment reaches extremes of euphoria, PEs go through the roof:


…click on the above link to read the rest of the article…

DANGER WILL ROBINSON

DANGER WILL ROBINSON

It’s funny how the truth sometimes leaks out from the government. I’m guessing that Mr. Ted Berg will not be working for the Office of Financial Research much longer. This new agency was created by the Dodd Frank Law and is supposed to protect consumers from the evil Wall Street banks. But we all know the evil Wall Street banks wrote the bill, have gutted the major provisions, have captured all the regulatory agencies, own the Federal Reserve, and control all the politicians in Washington D.C. So, when an honest government analyst writes an honest truthful report that unequivocally proves the stock market is grossly overvalued and headed for a crash, the Wall Street banking cabal will surely call the top government apparatchiks to voice their displeasure. Truth is treason in an empire of lies.

The soon to be fired Mr. Berg’s verbiage is subtle, but pretty clear.

Option-implied volatility is quite low today, but markets can change rapidly and unpredictably, a phenomenon described here as “quicksilver markets.” The volatility spikes in late 2014 and early 2015 may foreshadow more turbulent times ahead. Although no one can predict the timing of market shocks, we can identify periods when asset prices appear abnormally high, and we can address the potential implications for financial stability.

Markets can change rapidly and unpredictably. When these changes occur they are sharpest and most damaging when asset valuations are at extreme highs. High valuations have important implications for expected investment returns and, potentially, for financial stability.

However, quicksilver markets can turn from tranquil to turbulent in short order. It is worth noting that in 2006 volatility was low and companies were generating record profit margins, until the business cycle came to an abrupt halt due to events that many people had not anticipated.

…click on the above link to read the rest of the article…


Olduvai IV: Courage
Click on image to read excerpts

Olduvai II: Exodus
Click on image to purchase

Click on image to purchase @ FriesenPress