Home » Posts tagged 'weather' (Page 3)

Tag Archives: weather

Olduvai
Click on image to purchase

Olduvai III: Catacylsm
Click on image to purchase

Post categories

Post Archives by Category

Napoleon – War – Sunspots & Human Excitability

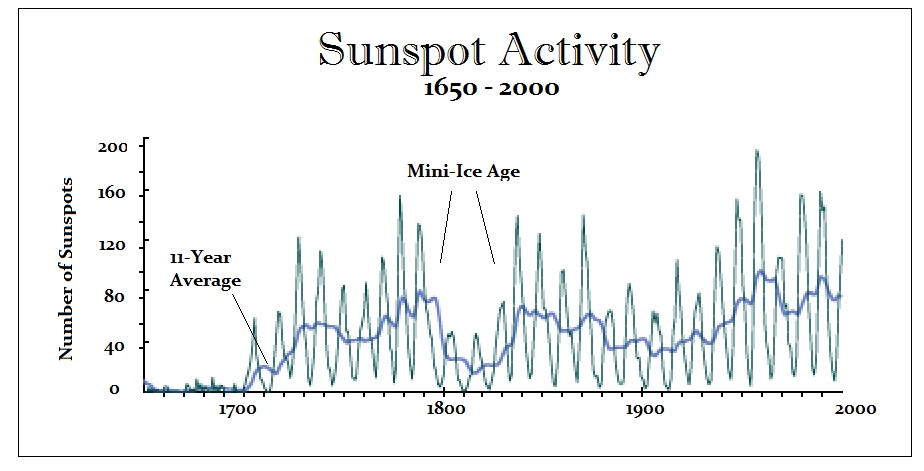
COMMENT: I love when you educate us about the weather, especially the cycles. the NAPOLEON story killed me !!! I’m a french and believe me, nobody talked in school about the weather cycles when he tried to fight Russia and lost everything. I read 3 times your chart which plots the temperatures and the cycle initiated by the volcano a few years ago. you are enough smart to guess that French teachers NEVER talk this story under this angle of cooling temperatures…

REPLY: When you correlate everything you see the patterns. Sure, at Waterloo, the French used CANNONS while the British used CANISTERS. On the day of the battle, it rained a lot. The ground was very muddy, soft and wet mud. In that weather and ground conditions, cannons were not as effective.  It was more than just the weapons. In those weather conditions, Napoleon delayed and that cost him the battle. But had the weather been dry, things may have been different. The cold clearly beat Napoleon on his attempted invasion of Russia.

There is also the Human Excitability Study where war was correlated to sunspot activity. The sunspot cycle is roughly every eleven years. However, this time it’s different. The sun is headed for a very rare, super-cooling period that threatens to topple civilization itself as it has throughout history roughly following a 300-year cycle.

For most of its history, science believed the sun’s output was constant. They finally realized that a thermal dynamic cycle beats like your heart so the sun could not exist if it was a steady outflow of energy. One degree less and it would blow itself out. Hence, it is cyclical rising and falling in intensity.

…click on the above link to read the rest of the article…

The Lasting Condition: Drought in Australia

The Lasting Condition: Drought in Australia

Humans are a funny species.  They create settlements along fault lines that, on moving, can create catastrophe, killing thousands.  They construct homes facing rivers that will, at some point, break their banks, carrying of their precious property.  Importantly, they return in the aftermath.  Existence continues.

The same follows certain settlements of parts of the planet where hostile, environmental conditions discourage rather than endorse a certain form of living.  Changes in weather have been vicious catalysts for the collapse of civilisations; extreme climactic variations prevent and retard stable and sustainable agriculture.

“The flourishing of human civilisation from about 10,000 years ago, and in particular from 7,000 years ago,” notes earth and paleo-climate scientist Andrew Glikson, “critically depended on stabilisation of climate conditions”.  This had its due results: planting and harvesting of seed; cultivation of crops; the growth of villages and towns.

Australia, the second driest continent on the planet, has never been exempt from such patterns of disruption, and those stubborn, pluckily foolish farmers who persist in the notion that they can make a living in parts of it risk going the same way.

Australia’s agrarian purveyors have certainly been persistent, hopeful as pilgrims in search of holy land.  Disasters have not discouraged.  A sense of a certain attendant fatalism can be found in the scribbles of Nancy Fotheringham Cato’s “Mallee Farmer”:

You cleared the mallee and the sand blew over
Fence and road to the slow green river;
You prayed for rain but the sky breathed dust
Of long dead farmers and soil’s red rust.
You ploughed up the paddocks with a stump jump plough
But the gates were open and the drought walked through.

The Settlement Drought (1790-1793) threatened but did not overwhelm early European settlers. The Goyder Line Drought (1861-5) savaged but did not kill farming in parts of South Australia.

…click on the above link to read the rest of the article…

Wicked Weather: Midwest Jumps From Coldest April To Hottest May On Record

“After an incredibly chilly April, May rebounded significantly, featuring record heat late in the month across the Midwest and while not official yet, May could go down as the warmest May on record nationally thanks to this late-month heat surge.

A plethora or heat records were broken this past weekend, including Minneapolis, MN soaring to 100°F. This broke the record daily record for May 28 and reaching 100°F for only the second time in recorded history. This intense heat has since abated, but more above normal temperatures are expected into early June across a majority of the Plains and Midwest,” explained Ed Vallee, head meteorologist at Vallee Weather Consulting.

“April featured record-breaking cold, particularly across the Upper Midwest, compared to normal. May has rebounded significantly with record heat this past weekend in the Midwest, and above normal temperatures across a majority of the country,” Vallee added.

According to the weather desk of Radiant Solutions, “Memorial Day weekend felt more like the peak of summer for many in the Central US.” Here are some peak highs from earlier this week:

  • Chicago set record highs of 97 and 95 degrees Sunday and Monday, only the second time it has endured back-to-back 95 degree days in May on record.
  • Milwaukee and Toledo established record highs for May of 95 degrees (Sunday) and 98 degrees (Monday), respectively.
  • Omaha and Green Bay, Wis., set record highs on four straight days Friday to Monday.
  • Des Moines set record highs on three straight days Saturday to Monday, including its earliest 99-degree reading on record Sunday.
  • Muskegon, Mich., hit 96 degrees Tuesday, a monthly record.

…click on the above link to read the rest of the article…

Weather Impacted Wars & Migrations in Pre-Recorded History

Archaeologists working in the wetlands of Denmark have uncovered 2,000-year-old human remains are revealing that the Germanic “barbarians” were engaging in warfare in northern Europe against other barbarian tribes which had nothing to do with Rome. The research, which was published in the journal Proceedings of the National Academy of Sciences, provides a unique look at how Germanic tribes memorialized their battles. The sheer magnitude of the number of remains demonstrates that the Germanic armies were clearly organized with leadership. There is no recorded history of this people so all we have to go on are the things left behind.

One thing to emerge is that the climate in Northern Europe was turning very cold. Even by 170AD, when the Roman Emperor Marcus Aurelius was battling the Germanic attempts to invade the south most likely due to climate change. He wrote his Mediataions to keep his mind distracted from the cold at night. He sent his children home to Rome to live with their great-great-aunt Matidia because Marcus thought the evening air of the country was far too cold for them. He even asked his friend for “some particularly eloquent reading matter, something of “your own, or Cato, or Cicero, or Sallust or Gracchus—or some poet, for I need distraction, especially in this kind of way, by reading something that will uplift and diffuse my pressing anxieties.” id/ Ad Antoninum Imperator 4.1 (= Haines 1.300ff), qtd. and tr. Birley, Marcus Aurelius, 120.

It appears from this new evidence that as the weather grew colder and colder, barbarians first fought against each other for resources. It appears that after such inter-tribal warfare proved fruitless, this is when the Germanic invasions of Rome begin. The Germanic invasions of Rome began during 113 BC and lasted until they finally conquered Rome by 596 AD.

…click on the above link to read the rest of the article…

The Bullish And Bearish Case For Oil

The Bullish And Bearish Case For Oil

Oil tanker

Oil prices could rise due to the “perfect storm of stagnant supply, geopolitical risk, and a harsh winter,” according to an April 12 note from Barclays.

Geopolitical events specifically could help keep Brent above $70 through April and May, which comes on the back of a substantial decline in oil inventories.

The investment bank significantly tightened its forecast for Venezuelan production, lowering it to 1.1-1.2 million barrels per day (mb/d), down sharply from its previous forecast of 1.4 mb/d. That helped guide the bank’s upward revision for its price forecast for both WTI and Brent in 2018 and 2019, a boost of $3 per barrel.

The flip side is that the explosive growth of U.S. shale keeps the market well supplied, and ultimately forces a downward price correction in the second half of the year, Barclays says. In fact, the investment bank said there are several factors that could conspire to kill off the recent rally. One of the looming supply risks is the potential confrontation between the U.S. and Iran. The re-implementation of sanctions threatens to cut off some 400,000 to 500,000 bpd of Iranian supply.

But Barclays says these concerns are “misguided,” with the risk overblown. “Yes, it should kill the prospects for medium-term oil investment, and yes it could destabilize the region further, but we struggle to accept a narrative that the market had been expecting big gains in Iranian output over the next several years anyway.” Moreover, the ongoing losses from Venezuela are also broadly accepted by most analysts. “Therefore, it is worth suggesting that in both of these countries, a dire scenario may already be priced in,” Barclays wrote.

…click on the above link to read the rest of the article…

“Sudden Stratospheric Warming Event” Fractures The Polar Vortex In Two

This split of the polar vortex will shift the upper atmospheric pattern such that the coldest airmass is located in western North America as well as over parts of Europe. This will allow for a ridge of high pressure to amplify in the eastern US, bringing unseasonably warm conditions next week,” said Ed Vallee, Long-Range Meteorologist and President of Vallee Wx Consulting.

The Weather Channel describes the atmosphetic impact for the Northern Hemisphere, as this unique weather event splits the polar vortex into two smaller vortices: one over western Canada and another over Europe.

  •  A split of the polar vortex occurred this week due to warming in the stratosphere
  • This is likely to result in cold temperatures in Europe
  • Although a disruption of the polar vortex is sometimes associated with cold weather in the eastern U.S., that is not always guaranteed

Further, from the Weather Channel:

“Across the Arctic, where the polar vortex typically stays locked, the stratosphere has warmed. This typically kicks into motion a polar vortex disruption like we are seeing. The stratosphere is a layer of the upper atmosphere above which most of our weather occurs – known as the troposphere – and where most of the polar vortex resides.” (Shown Below: The polar vortex has split into smaller vortices, one over Europe, and the other over northwestern North America.)

The one vortex over Western Europe and much of Eurasia will send the region into a dangerous deep freeze for the second half of February into early March. A disruption of the polar vortex has sent March 18 U.K. natural gas contracts soaring on the session, advancing +3.6% to 51.540.

…click on the above link to read the rest of the article…

The Death of Sunspot Cycle 24, Huge Snow and Record Cold

The Death of Sunspot Cycle 24, Huge Snow and Record Cold

My friend Alex is in Chamonix in the shadow of Mont Blanc in the French Alps. He sent some very snowy pics and mentioned that it was fair dinging down. The most snow since 2010. Knowing that sunspot cycle 24 was well-advanced I did some checking and came across a web site called Weather to Ski that had some amazing pics of big snow. One picture in particular caught my attention. See inset and below the fold.

Figure 1 Huge snow depth in the Alps. It is possible that the snow depth here is influenced by the road, snow blowers piling snow up along the route, and also drifting snow getting trapped in the ravine. But still, 8m is a lot. A cross country skier would be confronted with enormous difficulty crossing this road.

It looks like the snow in this drift is ~ 8m deep. And this is in the valley, not in the high basins where the snow fields that feed the glaciers lie. Now it’s obviously far too early to begin to draw any conclusions. But IF we get a run of 3 or 4 winters that dump this much snow, it is not inconceivable for me to imagine Alpine glaciers once again beginning to advance. I’m totally unsure how long it takes for pressure in the glacier source to feed through to advance of the snout.

So what is going on? We’ve been told by climate scientists that snow would become a thing of the past. We’ve also been told that global warming might lead to more snow and less snow. And we’ve been told that warming might even lead to cooling.

…click on the above link to read the rest of the article…

Weather Terrorism, W.T.F.? 

Weather Terrorism, W.T.F.? 

Photo by The National Guard | CC BY 2.0

As the predicted storm pounded the narrow canyons in the hills above Montecito early in January, a rumble began to overtake the percussion of hard rain on scorched earth. It built, once the torrent of water had dislodged first soil, pebbles, small rocks, then boulders, into a mighty thunder as the mud gathered speed over the resin-slicked surface of the newly burned wild lands.

From out of the Wildland-Urban-Interface, the mudslide drove down into the leafy suburbs of Montecito and tangled with the fragile infrastructure that supports the life-styles of the rich and famous, the merely rich, and all those others who call this Santa Barbara suburb home.  It smashed through homes, businesses and, most critically, fractured the system of pipes, suspended across the naturally occurring drainages, that link a chain of reservoirs that serve as the community’s water source.

The broken pipes unleashed a sea of nearly ten million gallons of fresh water released from the reservoirs because their electrically operated control valves were inoperative in the storm related blackout. Much of the mud and water found its way to U.S. Route 101 which runs from Los Angeles to the Oregon border. The section that runs through Montecito, a few hundred yards east of the beach, was transformed into a rock and tree strewn delta where water ran twelve feet deep in places and over 100,000 tons of debris were spread along its length. The highway was reopened recently after a two-week closure. Restoration of the area’s water supply will take longer. Both were the collateral damage of extreme weather events.

We are a species in retreat. Pusillanimous descriptions of our geo-historical circumstances such as ‘climate change’ are daily challenged by the occurrence of extreme weather events that disrupt society, destroy infrastructure, and obliterate human life.

…click on the above link to read the rest of the article…

Is A Major Winter Blast Coming To The East Coast This Christmas?

Is A Major Winter Blast Coming To The East Coast This Christmas?

According to Michael Clark, a private weather forecaster, his latest report indicates a major winter storm is headed for the East Coast between Dec 20, 2017 through Jan 04, 2018

As BAMWX.com notes, the pattern is about to change in a huge way and it may begin on #Christmas eve! Accumulating snow is on the table between Dec 24th-Jan 5th in a big way.

Of course, if a storm erupts, it is the perfect excuse for lagging spending… despite the tax cut windfalls…

State of the climate: 2017 shaping up to be warmest ‘non-El Niño’ year

State of the climate: 2017 shaping up to be warmest ‘non-El Niño’ year

Much of the year, though the summer Arctic minimum was only the eighth lowest on record.

2017 is also almost certain to be the warmest year without an El Niño event. When the effects of El Niño and La Niña are removed from the temperature record, the first nine months of 2017 are likely the warmest ever recorded.

Near-record warm temperatures

Ten months in, 2017 is very likely going to be either the second warmest or third warmest year on record, depending on the temperature series used. While there was some speculation earlier in the year that it could challenge 2016 for first place, colder temperatures in the period from June through September have largely eliminated any chance of a new record.

Carbon Brief has examined global temperature data from eight different climate centres around the world, both for the Earth’s surface and the lower troposphere (TLT). Temperatures for the full year of 2017 were estimated using the data available to-date for each dataset, along with projection of the El Niño Index for the remainder of 2017 (see methods at the end of the article for technical details).

The results are shown in the figure below. Annual temperatures from 1979 through 2016 are shown in black for each record, while the likely (95% confidence interval) range of the 2017 annual temperature is shown by the red bar.

The last two records shown, RSS and UAH, come from satellite data and are measuring the atmosphere on average around 5 km up from the surface. While these have similarities to surface temperatures, they are not expected to always respond in the same way to El Niño or other factors.

…click on the above link to read the rest of the article…

Northeast Facing Record-Low Temperatures As Polar Vortex Returns

Northeast Facing Record-Low Temperatures As Polar Vortex Returns

The return of the dreaded polar vortex is battering much of the eastern US this week, sending temperatures well into freezing territory and close to record lows – a phenomenon that could persist for much of the week leading up to Thanksgiving.

According to the New York Post, record-low temperatures are forecast for Friday and Saturday, with nighttime and early-morning mercury dipping into the 20s.

The temperature dropped into the 20s in some places in the northeast last night, and could sink as low as 21 degrees fahrenheit on Saturday, according to AccuWeather forecasts.

The record low for November 10 was 27 degrees in 1914. The high Saturday will be 37 to 43 degrees – up from the predawn low of about 24 degrees. The record low for November 11 was 29 degrees, set in 1933.

The forecast calls for 50 degrees on Monday, setting off eight straight days with high temps of at least 50, AccuWeather said.

The forecasting service added that signs are pointing toward a shift of the polar vortex that may cause snow, rain and other hazardous weather conditions like icy roads in some parts of the Northeast.

Right now, a cold snap is bringing an abrupt November reality check to most of the eastern US that will persist for the rest of the Veterans’ Day weekend. As Accuweather explains, the weather pattern will become even more interesting later in the week because it will feature a meteorological phenomenon called “the Greenland block”.

This pattern consists of relatively high pressure wind pattern near greenland that forces the polar jet stream to move sharply south toward the eastern US.

…click on the above link to read the rest of the article…

How to Run the Economy on the Weather

How to Run the Economy on the Weather

Stoneferry detail

Before the Industrial Revolution, people adjusted their energy demand to a variable energy supply. Our global trade and transport system — which relied on sail boats — operated only when the wind blew, as did the mills that supplied our food and powered many manufacturing processes.

The same approach could be very useful today, especially when improved by modern technology. In particular, factories and cargo transportation — such as ships and even trains — could be operated only when renewable energy is available. Adjusting energy demand to supply would make switching to renewable energy much more realistic than it is today.

Renewable Energy in Pre-Industrial Times

Before the Industrial Revolution, both industry and transportation were largely dependent on intermittent renewable energy sources. Water mills, windmills and sailing boats have been in use since Antiquity, but the Europeans brought these technologies to full development from the 1400s onwards.

At their peak, right before the Industrial Revolution took off, there were an estimated 200,000 wind powered mills and 500,000 water powered mills in Europe. Initially, water mills and windmills were mainly used for grinding grain, a laborious task that had been done by hand for many centuries, first with the aid of stones and later with a rotary hand mill.

785px-Jan_van_Os_-_Een_zomers_landschap

“Een zomers landschap” (“A summer landscape”), a painting by Jan van Os.

However, soon water and wind powered mills were adapted to industrial processes like sawing wood, polishing glass, making paper, boring pipes, cutting marble, slitting metal, sharpening knives, crushing chalk, grinding mortar, making gunpowder, minting coins, and so on. [1-3] Wind- and water mills also processed a host of agricultural products. They were pressing olives, hulling barley and rice, grinding spices and tobacco, and crushing linseed, rapeseed and hempseed for cooking and lighting.

…click on the above link to read the rest of the article…

Scientist Confirms: Harvey Caused A “1-In-1,000-Year Flood”

Scientist Confirms: Harvey Caused A “1-In-1,000-Year Flood”

Scientists have confirmed what one renowned weather forecaster has suspected for days: Hurricane Harvey was a “1-in-1,000-year flood.”

That’s according to researchers at the University of Wisconsin’s Space Science and Engineering Center, who claim there is nothing in the historical record that rivals the devastation resulting from the flooding in southwest Texas, which has forced more than 30,000 Texans into temporary shelters.

“There is nothing in the historical record that rivals this, according to Shane Hubbard, the Wisconsin researcher who made and mapped this calculation. “In looking at many of these events [in the United States], I’ve never seen anything of this magnitude or size,” he said. “This is something that hasn’t happened in our modern era of observations.”

Of course, one reason for this might be that the modern urban environment is covered in concrete and asphalt, which makes it impossible for floodwater to absorb into the ground, exacerbating the disaster.

Hubbard’s calculations, which he shared with the Washington Post, only accentuate the massive scale of the flooding.

To that, we’d like to add the nearly 52 inches of rain recorded by the National Weather Service in Cedar Bayou, Texas, which broke the continental U.S. record.

Making matters worse, the National Hurricane Center (NHC) has just updated its forecast for what it is now referring to as a “rapidly intensifying” Category 2 hurricane in the Eastern Atlantic Ocean. Some models see the storm making landfall in Florida, while others see it landing somewhere in the Gulf of Mexico, meaning that another powerful storm could ravage Texas just two weeks after Hurricane Harvey, leaving locals little time to recover.

West Coast sizzles; Mangaluru records all time high temperature for February month

West Coast sizzles; Mangaluru records all time high temperature for February month

It’s not only Mangaluru, but also Honnavar and Karwar, where the weather observatories have recorded abnormally high temperatures.(Picture only for representation)
It’s not only Mangaluru, but also Honnavar and Karwar, where the weather observatories have recorded abnormall… Read More

MANGALURU: The west coasthas been witnessing an abnormal increase in day temperature since past few days. On Wednesday, the evening temperature was 38.7 degree C for Mangaluru city, recorded at Panambur Weather Observatory, which is a seven degree C rise in the normal maximum. This, incidentally, is an all-time high record for the February month since Indian Meteorological Department (IMD) started recording temperatures for this region.

The previous high of 38.4 degree C was recorded on February 19 last year. The mean max for the month of February is 33.3 deg C. The day time temperatures have been on a high since February 12.

It’s not only Mangaluru, but also Honnavar and Karwar, where the weather observatories have recorded abnormally high temperatures. Karwar on Wednesday recorded 38.4 deg C, which is 6 deg C departure from the mean maximum for the February month. The all-time high for Karwar is 39.1 deg C recorded on February 21, 2009. Wednesday’s high was also once recorded on February 23, 2007, in Karwar.

Honnavar’s Wednesday’s temperature was 5 deg C higher than the mean maximum at 37.2 deg C. Honnavar’s all-time high is 38.6 deg C recorded on February 23, 1999. Another high of 38.5 deg C was recorded on February 21, 2009.

While there has been not much departure from minimum temperature in Mangaluru at 23 deg C, Karwar on Thursday saw a rise of 2 deg C from the mean minimum at 22.6 deg C and Honnavar about 5 deg C departure at 24.9 deg C.

Sundar M Metri, director, Meteorological Department, Bengaluru, confirmed that Wednesday’s temperature for Panambur observatory was an all-time record. This was due to the dry northerly winds and clear skies. He said temperatures will be high till these conditions exist. He said even Shirali and Bajpe (airport) had recorded high temperatures of 36.4 and 37.4 deg C respectively, on Wednesday….click on the above link to read the rest of the article…

Yes, the Arctic’s Freakishly Warm Winter is Due to Humans’ Climate Influence

Yes, the Arctic’s Freakishly Warm Winter is Due to Humans’ Climate Influence

The Arctic’s seasonal cycle means that the lowest sea ice concentrations occur in September each year. But while September 2012 had less ice than September 2016, this year the ice coverage has not increased as expected as we moved into the northern winter. As a result, since late October, Arctic sea ice extent has been at record low levels for the time of year.

Late 2016 has produced new record lows for Arctic ice. NSIDCAuthor provided

These record low sea ice levels have been associated with exceptionally high temperatures for the Arctic region. November and December (so far) have seen record warm temperatures. At the same time Siberia, and very recently North America, have experienced conditions that are slightly cooler than normal.

Temperatures have been far above normal over vast areas of the Arctic this November and December. Geert Jan van Oldenborgh/KNMI/ERA-InterimAuthor provided

Extreme Arctic warmth and low ice coverage affect the migration patterns of marine mammals and have been linked with mass starvation and deaths among reindeer, as well as affecting polar bear habitats.

Given these severe ecological impacts and the potential influence of the Arctic on the climates of North America and Europe, it is important that we try to understand whether and how human-induced climate change has played a role in this event.

Arctic attribution

Our World Weather Attribution group, led by Climate Central and including researchers at the University of Melbourne, the University of Oxford and the Dutch Meteorological Service (KNMI), used three different methods to assess the role of the human climate influence on record Arctic warmth over November and December.

…click on the above link to read the rest of the article…

Olduvai IV: Courage
Click on image to read excerpts

Olduvai II: Exodus
Click on image to purchase

Click on image to purchase @ FriesenPress