Home » Posts tagged 'wolfstreet' (Page 2)

Tag Archives: wolfstreet

Olduvai
Click on image to purchase

Olduvai III: Catacylsm
Click on image to purchase

Post categories

Post Archives by Category

Hit by Shortages, Vehicle & Parts Production Plunged to Lowest since Lockdown. Oil & Gas Has New Script

Hit by Shortages, Vehicle & Parts Production Plunged to Lowest since Lockdown. Oil & Gas Has New Script

Industrial production over the long term is a sad sight, powered by offshoring.

Industrial production – manufacturing output, oil-and-gas extraction, mining, and gas and electric utilities – fell 1.3% in September from August, pushed down by production of motor vehicles and parts, which plunged 7.2% for the month, and by oil and gas extraction, which fell 3.8%.

Manufacturing of motor vehicles and parts has been hobbled all year by supply semiconductor shortages that have led to rotating shutdowns of parts manufacturing operations and assembly plants. The shortages continued to get worse – despite assurances earlier this year that they would be over with by Q4.

The manufacturing production index for motor vehicles and parts, adjusted for inflation, dropped to a value of 85.4. Beyond the collapse of production during the lockdown, it was the lowest output value since 2013 and was back where it had been in 2006:

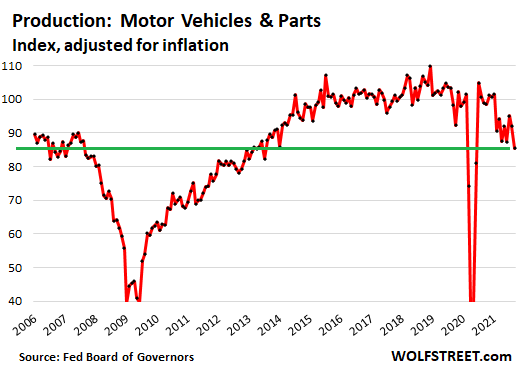
Motor vehicle and parts manufacturing started hitting new highs in 2014 on an annual basis and continued to grow and peaked in 2018, before dipping in 2019 and plunging in 2020. This year promises to be rough too.

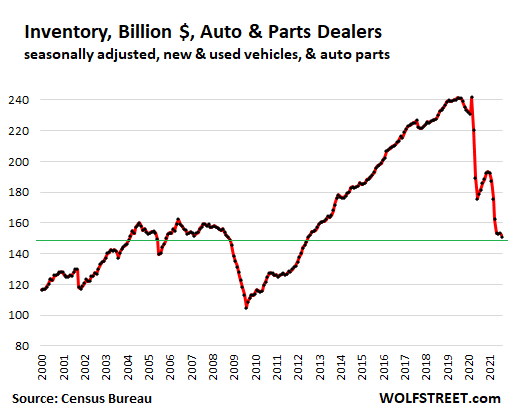
Unlike the Great Recession collapse of production of motor vehicles and parts – which was driven by a collapse in demand that caused GM and Chrysler and many component makers to file for bankruptcy – the drop in production this year was driven by supply shortages. The drop in production, amid strong demand, has caused inventories at auto dealers to be essentially depleted.

In an effort to keep their plants running, automakers have built large numbers of nearly finished vehicles that are missing a part of two and were put on storage lots until those parts arrive. Then the finished vehicles are shipped to dealers. In Q3, GM shipped over 68,000 of those vehicles to dealers.

…click on the above link to read the rest of the article…

Not Getting Better: Relentless Retail Inventory Squeeze amid Shortages & Supply Chain Chaos

Not Getting Better: Relentless Retail Inventory Squeeze amid Shortages & Supply Chain Chaos

Holiday selling season is going to be a mess: Look not for what you want but for what the store has.

The holiday selling season is approaching, and a whole litany of weird shortages is ricocheting through the economy. Stuff suddenly gets hung up somewhere, on a ship, or in a port, and then ends up somewhere else, or it’s on backorder for months, as manufacturers are struggling with material shortages and in in Asia with Covid outbreaks that shut down factories for weeks at a time.

And stimulus-fueled demand in the US has been huge and relentless, while retailers are struggling with inventories, some more than others.

Catastrophic shortages at auto dealers got even worse.

Auto dealers, particularly new-vehicle dealers, are experiencing catastrophic shortages of popular models, as automakers have been getting blasted by semiconductor shortages that simply refuse to abate, leading to rotating shutdowns of assembly plants globally.

Auto dealers are the largest retailer segment, with their sales normally accounting for over 20% of total retail sales, and with their inventories normally accounting for 33% of total retail inventories.

Inventories at auto dealers, measured in dollars, declined to a new multi-year low of $151 billion in August, according to data released by the Commerce Department on Friday.

The long-term dollar-increase in inventory levels that you can see in the chart above is a reflection of higher costs per vehicle in inventory. But the number of vehicles in inventory has been in the same range for two decades, as unit sales have mostly been below the peak achieved in the year 2000.

It’s even worse during the current shortages: Inventory in dollars – though it collapsed – is being inflated by the shift to high-end models as automakers are prioritizing the biggest money makers.

…click on the above link to read the rest of the article…

Banks Disclose Tidbits of Hidden Stock Market Leverage of “Securities-Based Lending,” as Known Stock Market Leverage Surges

Banks Disclose Tidbits of Hidden Stock Market Leverage of “Securities-Based Lending,” as Known Stock Market Leverage Surges

No one knows total stock market leverage, but it’s huge and ballooning, as we see from the tidbits we’re allowed to see.

No one knows how much total leverage there is in the stock market. Only fragments are reported. Margin loans are reported monthly, and they provide a general idea of the trend in stock market leverage. Some types of leverage are not disclosed at all until something implodes spectacularly, such as Archegos. Other types of leverage are reported in bits and pieces, if at all, by a few banks and broker-dealers in their quarterly financial statements, if they so choose. This includes “securities-based lending.”

Some banks & brokers report securities-based lending, others don’t.

On Thursday and today, some Wall Street banks and broker filed their Q3 earnings reports and supplemental information with the SEC, and a few of them included in their supplemental filings some tidbits about their securities-based lending (SBL).

Securities-based lending is hot; people who want to cash out some of the gains in their portfolios – thank you halleluiah, Fed – but didn’t want to sell, can use their portfolios as collateral for loans by the broker, the proceeds of which can be used for anything – buy more securities, buy a house or a new vehicle, or pay for a divorce settlement.

When asset prices fall enough, the borrowers get a margin call and either have to either come up with some cash and put it into the account, or they have to sell securities and pay down their SBL balances, thereby turning into forced sellers.

Goldman Sachs didn’t disclose anything about its SBL; they’re lumped into a larger loan category.

…click on the above link to read the rest of the article…

My “Wealth Effect Monitor” for the Money-Printer Economy: Holy Moly, October Update

My “Wealth Effect Monitor” for the Money-Printer Economy: Holy Moly, October Update

The bottom 50% need not apply. They just get to eat the soaring costs of housing. How the Fed totally blew out the already gigantic wealth disparity during the pandemic.

 On Friday, the Fed released the detailed data about the wealth of households by wealth category for the 1%, the 2% to 9%, the “next 40%” (the top 10% to 50%) and the “bottom 50%” for the second quarter, after having released less detailed figures on September 23. You read the stories at the time about how the Fed’s money-printing and interest-rate-repression has enriched American households.

But the detailed data, just now released, show whose wealth jumped the most, and who got left endlessly further behind. It wasn’t households in general that benefited, but only the richest households with the most assets. The more assets they had, the more they benefited.

My Wealth Effect Monitor divides the wealth (assets minus liabilities) for each wealth category by the number of households in that category, which produces average per-household wealth within each category. The wealth of the bottom 50% is reflected by the jagged green line on the bottom, essentially on top of the horizontal axis:

Not shown separately are the truly rich – the 0.01% – and the Billionaire Class.  The Fed wisely doesn’t provide any information on them separately, but includes them in the Top 1%.

But according to the Bloomberg Billionaires Index, the top 30 US billionaires are worth on average $69 billion per household currently, having gained on average $2.2 billion in wealth each over the quarter.

The bottom 50% of US households (green line above) – 63.2 million households – are worth on average $47,900 per household. But this includes $25,970 in “durable goods” (cars, phones, furniture, etc.), which for consumers are normally considered consumables, not assets, because their values are declining, and they don’t produce incomes.

…click on the above link to read the rest of the article…

“Transitory” is the New Spandex: Powell Admits it, Still Denies its Cause. Why this Inflation Won’t Go Away on its Own

“Transitory” is the New Spandex: Powell Admits it, Still Denies its Cause. Why this Inflation Won’t Go Away on its Own

Blames tangled-up supply chains but not what’s causing supply chains to get tangled up in the first place: The most grotesquely overstimulated economy ever.

Fed Chair Jerome Powell, during a panel discussion hosted by the ECB today, admitted again that inflation pressures would run into 2022 and blamed “bottlenecks and supply chain problems not getting better” and admitted they are “in fact at the margins apparently getting a little bit worse.”

“The current inflation spike is really a consequence of supply constraints meeting very strong demand, and that is all associated with the reopening of the economy, which is a process that will have a beginning, a middle and an end,” he said.

OK, good, he almost gets it: “very strong demand” is causing this. But where the heck does this “very strong demand” come from?

Here’s where: The most grotesquely overstimulated economy ever.

The Fed has handed out $4.5 trillion to investors in 18 months, and repressed short-term interest rates to near 0%, and long-term interest rates (via the $120 billion a month in bond purchases) to ridiculously low levels, and this has inflated asset prices, including home prices, and beneficiaries are feeling rich and flush, and they’re going out and borrowing against their assets and buying $70,000 pickup trucks, electronic devices, yachts, second and third homes, and a million other things. That’s where much of the demand comes from.

The other part of the demand comes from the government, which spread $5 trillion in borrowed money around over the past 18 months – stimulus checks, forgivable PPP loans (over $800 billion), extra unemployment benefits, funds sent to states to spend how they see fit, to airlines and other big companies to bail them out, which then used this money to buy out their employees that then spent this money.

…click on the above link to read the rest of the article…

China’s Crackdown on Debt, Tech & Evergrande Sends Frazzled Wall Street Titans to China

China’s Crackdown on Debt, Tech & Evergrande Sends Frazzled Wall Street Titans to China

The property sector and its debts are possibly the biggest financial mess in China’s history.

The crackdowns by Chinese authorities on some of the biggest hype-and-hoopla industries have sent investors heading for the exits. There is a crackdown on debt to keep the financial system from imploding. There’s a crackdown on property speculation to tamp down on housing prices and on debt. There’s a crackdown on big tech – mostly internet, social media, and online gaming companies – for their monopolistic size and practices and a slew of other issues.

There’s a crackdown on education tech companies that sell off-campus educational courses that have driven the costs of education into the sky, discouraging Chinese couples from having more than one child. There’s a crackdown on all kinds of other activities that include reporting financial news and analysis in a way that the government doesn’t approve.

There are all kinds of reasons for these crackdowns, including the push by President Xi to create “common prosperity,” which has become a mantra to fight the ballooning wealth disparity linked to the surge in asset prices, including home prices that are now making homes unaffordable for the masses.

The crackdowns already resulted in some spectacular effects.

Wall Street is heavily involved in the stocks and bonds of these companies, both in the US and in China, many of which have dropped sharply, and some have collapsed.

Many Chinese companies have issued American Depositary Receipts, or ADRs, such as Alibaba. These ADRs aren’t actual stocks but were issued by an offshore mailbox entity in the Cayman Islands or wherever, that has a contract with the actual company in China.

…click on the above link to read the rest of the article…

What Comes After Mind-Blowing Free-Money Blow-Off Spike in Retail Sales? A Spike Doesn’t Spike Forever

What Comes After Mind-Blowing Free-Money Blow-Off Spike in Retail Sales? A Spike Doesn’t Spike Forever

Powered by price increases.

Total retail sales – not adjusted for inflation, now a big factor – inched up 0.7% in August from July, to $619 billion (seasonally adjusted), up a stunning 18% from two years ago and 15.1% from a year ago. The insert in the chart shows that this wasn’t a proper “rebound,” as it has been widely called in the media today, but an uptick in a four-month down-trend from the mind-blowing superlative historic free-money blow-off spike in April. August retail sales were down 1.6% from that April stimmie-craziness:

A spike doesn’t spike forever. But Americans are still making a heroic effort to spend the pile of free money they got … the last two stimmies totaling $2,000 per person, the $800 billion in forgivable PPP loans that just about everyone with a little or big business got, extra unemployment benefits, massive gains on asset prices, all of it fueled by the Fed’s $4-trillion money-printing binge and the government’s $5-trillion deficit-spending binge in 18 months, which created the most monstrously overstimulated economy and markets ever.

New & used auto dealers and parts stores: Sales dropped another 3.6% in August from July, to $121 billion (seasonally adjusted), fourth month in a row of large declines off the free-money spike in March and April.

There is plenty of demand, and prices have surged amid inventory shortages of used vehicles and historic inventory shortages of new vehicles. Customers face dealer lots that are nearly empty and out of popular models amid rotating shutdowns of assembly plants globally due to the semiconductor shortages.

But these $121 billion in sales in August were still up 10.7% from a year ago and 22.2% from two years ago, in dollar terms, thanks to massive price increases – 32% year-over-year for used vehicles and 7.6% for new vehicles, according to the Consumer Price Index.

…click on the above link to read the rest of the article…

Too Much Money Chasing Too Few Goods and Services

Too Much Money Chasing Too Few Goods and Services

Inflation can be considered a tax, an especially regressive one, falling harder on those with lower income and/or assets.

As we’ve noted previously, the Federal Reserve’s “M2” monetary aggregate began growing significantly faster than the “GDP” measure of economic output in the United States beginning around 2008, amidst the 2007-2009 financial and economic crisis.

With the federal government’s massive fiscal and economic “stimulus” policies arriving together with a pandemic and government lockdowns, M2 growth has recently risen dramatically higher than GDP growth.

Earlier this week, the Bureau of Labor Statistics (within the U.S. Department of Labor) reported that the Consumer Price Index (CPI) rose in June at one of its fastest growing rates in more than a decade. Some people have been pointing to the fact that year-over-year changes in the CPI may be high recently in part because the comparisons to last year’s levels were amidst the onset of the pandemic. But in the second quarter of 2021, compared to the first quarter of 2021 and on a seasonally adjusted basis, the CPI rose at an annualized rate of more than 8 percent, which is the highest quarterly growth rate since the third quarter of 1981.

It’s always worthwhile to keep an eye on alternative inflation measures, given the estimation issues associated with government statistics, and considering the source of those statistics.

Along those lines, a recent survey of small businesses by the National Federation of Independent Business (NFIB) returned a result for prices that hasn’t been reached since 1981.

And the prices component of the monthly Institute for Supply Management survey of business purchasing managers rose in June 2021 to its highest reading since July 1979.

Inflation can be considered as a tax, and an especially regressive one, falling harder on those with lower income and/or assets. Inflation can be considered one cost of government.

…click on the above link to read the rest of the article…

Plunge of Retail Inventories, Collapse of New & Used Vehicle Inventories: The Shortages Depicted in Charts

Plunge of Retail Inventories, Collapse of New & Used Vehicle Inventories: The Shortages Depicted in Charts

Inventories at retailers document this mess. 

Turns out, when the US government spends $5 trillion in borrowed fiscal stimulus over 16 months, and the Fed hands out $4 trillion in monetary stimulus over the same period, causing asset prices to boom, demand for goods is going to wash over the land in tsunami-like waves, and supply chains that snake all over the world, amid finely honed just-in-time-inventory strategies, get tangled up. And as retail sales spiked in a historic manner, shortages of all kinds have been cropping up, including the semiconductor shortage that has slammed the auto industry with a vengeance.

Inventories at retailers document this mess. Inventories are tight all around, but they’re in catastrophic condition at auto dealers, which before the pandemic accounted for over one-third of total retail inventories.

Inventories at new vehicle dealers, used vehicle dealers, and parts dealers fell to $153 billion in May, down 36% from May 2019, according to data released by the Census Bureau on Friday. And the inventory-sales ratio – with inventories and sales both in dollars, the impact of inflation gets canceled out – dropped to 1.14, the lowest level in the data going back to 1992:

The inventory-sales ratio (inventories divided by sales) is a standard metric in the retail industry. A ratio of 1 means that the retailer has enough goods in inventory for one month of sales at the current rate of sales. This would be 30 days’ supply. A ratio of 2 – meaning 60 days’ supply – is considered healthy in the auto industry.

In dollar terms: The ever-more expensive vehicles in inventory over the years explain all of the long-term rise of inventories in the chart below. Unit retail sales – and unit inventories with them…

…click on the above link to read the rest of the article…

While Fed Is in Denial, Hawkish Bank of Russia Sees Inflation as “Not Transitory,” Warns of Possible Shock-and-Awe Rate Hike

While Fed Is in Denial, Hawkish Bank of Russia Sees Inflation as “Not Transitory,” Warns of Possible Shock-and-Awe Rate Hike

US Inflation is almost as hot as in Russia, but the Fed is still blowing it off.

Consumer price inflation in Russia is red-hot, having jumped 6.0% in May compared to a year ago, 2 percentage points above the Bank of Russia’s target of 4.0%. Polls in Russia show that food inflation is a top concern, currently running at 7.4%.

But inflation in the US isn’t lagging far behind: The Consumer Price Index (CPI) jumped 5.0% in May. Yet the central banks are on opposite tracks in their approach to inflation.

Federal Reserve governors keep jabbering about this red-hot inflation being “temporary” or “transitory,” and likely to disappear on its own despite huge government stimulus and the Fed’s huge and ongoing monetary stimulus, though some doubts are creeping in among a couple of them. So they’ll keep interest rates at near-zero until at least next year, and they’re still buying $120 billion a month in securities to push down long-term interest rates.

Russia has been on the opposite trajectory, “surprising” economists at every step along the way. This trajectory started on March 19 with a 25 basis point rate hike, to 4.5%, against the expectations of 27 of the 28 economists polled by Reuters, who didn’t expect a rate hike. On April 23, the Bank of Russia hiked its policy rate by 50 basis points, to 5.0%. On June 11, it hiked by another 50 basis points to 5.5%. The next policy meeting is scheduled for July 23.

Is a shock-and-awe rate hike next? Bank of Russia Governor Elvira Nabiullina is preparing the markets for this possibility – so it won’t be a shock, but just awe.

At the July meeting, the central bank “will consider” an increase in the range from “25 basis points to 1 percentage point,” she told Bloomberg TV in an interview.

…click on the above link to read the rest of the article…

Pay More, Get Less: Consumer Income & Spending Chewed Up by Red-Hot Inflation

Pay More, Get Less: Consumer Income & Spending Chewed Up by Red-Hot Inflation

Inflation ate my homework?

You saw this coming after today’s release of the Personal Consumption Expenditure inflation index. “Core PCE” inflation, which excludes food and energy – the lowest lowball inflation index the US offers and which the Fed uses to track its inflation target – spiked by 6.4% annualized for the past three months. In May alone it rose by 0.5% from April.

Consumers got some remaining stimmies and extra unemployment checks and other stimulus funds from the government in May, which still puffed up their income, but less than in prior months. Consumers then spent this income in a heroic manner. But inflation ate a chunk out of their spending in May, and adjusted for inflation, it fell.

Adjusted for inflation, “real” consumer income from all sources fell 2.4% in May from April, and was down 1.1% from May last year, according to the Bureau of Economic Analysis today. Not adjusted for inflation, consumer income fell 2.0%. Each of the three waves of stimmies triggered a glorious WTF spike in income. Those stimmies are now petering out, but consumers are still receiving other payments from the federal government, including special unemployment benefits:

How this bout of inflation, the highest since the early 1980s, is starting to add up month by month, inexorably, and cumulatively, is depicted in the chart below. It tracks personal income from all sources, adjusted for inflation (red line) and not adjusted for inflation (green line), both expressed as an index set at 100 for January 2019. Note the sharply widening gap between the two lines. That’s the effect of inflation. I’m going track it that way going forward:

Inflation ate my homework?

American consumers are still trying to spend heroic amounts of money as fast as they can – they just didn’t keep up with inflation.

…click on the above link to read the rest of the article…

It Gets Ugly: Dollar’s Purchasing Power Plunged at Fastest Pace since 1982. It’s “Permanent” not “Temporary,” Won’t Bounce Back

It Gets Ugly: Dollar’s Purchasing Power Plunged at Fastest Pace since 1982. It’s “Permanent” not “Temporary,” Won’t Bounce Back

The Consumer Price Index jumped 0.6% in May, after having jumped 0.8% in April, and 0.6% in March – all three the steepest month-to-month jumps since 2009, according to the Bureau of Labor Statistics today. For the three months combined, CPI has jumped by 2.0%, or by an “annualized” pace of 8.1%. This current three-month pace of inflation as measured by CPI has nothing to do with the now infamous “Base Effect,” which I discussed in early April in preparation for these crazy times; the Base Effect applies only to year-over-year comparisons.

On a year-over-year basis, including the Base Effect, but also including the low readings last fall which reduce the 12-month rate, CPI rose 5.0%, the largest year-over year increase since 2008.

In terms of the politically incorrect way of calling consumer price inflation: The purchasing power of the consumer dollar – everything denominated in dollars for consumers, including their labor – has dropped by 0.8% in May, according to the BLS, and by 2.4% over the past three months, the biggest three-month plunge in purchasing power since 1982:

On an annualized basis, the three-month drop in purchasing power amounted to a drop of 9.5%, and this eliminates the Base Effect which only applies to year-over-year comparisons.

That plunge in purchasing power is “permanent” not “temporary.”

Yup, the current plunge in purchasing power is permanent. And the plunge in purchasing power in the future is also permanent.

The only thing that might make a small portion of it “temporary” is if there is a period of consumer price deflation, which has happened for only a few quarters in my entire life, for example in the last few months of 2008, which is indicated in the chart above. So I’m not getting my hopes up.

…click on the above link to read the rest of the article…

Fed’s Favorite Lowball Inflation Gauge is Red-Hot, Not Seen in Decades, Even Without the “Base Effect”

Fed’s Favorite Lowball Inflation Gauge is Red-Hot, Not Seen in Decades, Even Without the “Base Effect”

The majestic inflation overshoot has arrived.

The Fed’s favorite inflation measure, generally the lowest inflation measure the US government provides — tracking a lot lower than even the Consumer Price Index which already understates actual inflation — and therefore our lowest lowball inflation measure, and therefore the Fed’s favorite inflation measure, was released this morning, and it was a doozie, despite being the most understated inflation measure the US has so far come up with.

The Personal Consumption Expenditures Price index without food and energy, the “core PCE” index, jumped by 0.7% in April from March, after having jumped by 0.4% in March from February, according to the Bureau of Economic Analysis today. Those two months combine into an annualized core PCE inflation rate of 6.4%, meaning that if price-increases continue for 12 months at the pace of the past two months, then the annual inflation would be 6.4% as measured by the lowest lowball measure the US has.

This was the highest two-months annualized rate since 1985. And it shows to what extent inflation has suddenly heated up in March and April.

Over the past three months – so April, March, and February – the annualized increase of core PCE inflation was 4.9%, the highest since 1990.

The annualized PCE index eliminates the legitimate issue of the “Base Effect” that is now getting trotted out to brush off the inflation data (I discussed the Base Effect in early April to prepare for what would be coming).

The Base Effect applies only to year-over-year comparisons. In March last year, the core PCE price index dipped by 0.1% from February, and in April it dipped by 0.4% from March. So comparing today’s PCE index to that dip in April (the lower “base”) would include the Base Effect.

…click on the above link to read the rest of the article…


Fed Drains $485 Billion in Liquidity from Market via Reverse Repos, Undoing 4 Months of QE, Even as QE Continues, Total Assets Near $8 Trillion

Fed Drains $485 Billion in Liquidity from Market via Reverse Repos, Undoing 4 Months of QE, Even as QE Continues, Total Assets Near $8 Trillion

It’s a crazy situation the Fed backed into as tsunami of liquidity goes haywire, banking system strains under $4 trillion in reserves, and General Treasury Account gets drawn down.

This morning, the Fed sold a record $485 billion in Treasury securities via overnight “reverse repos” to 50 counterparties, beating the prior record set on December 31, 2015. These overnight reverse repos will mature and unwind tomorrow morning. Today, yesterday’s $450 billion in overnight reverse repos matured and unwound, and were more than replaced with this new batch of $485 billion in overnight reverse repos.

Reverse repos are liabilities on the Fed’s balance sheet. They’re the opposite of repos, which are assets. With these reverse repos, the Fed is selling Treasury securities to counterparties and is taking their cash, thereby massively draining liquidity from the market – the opposite effect of QE.

In past years of large reserves following QE, banks shed reserves via reverse repos, reducing reserves on the balance sheet and increasing their Treasury holdings, to dress up their balance sheet at the end of the quarter, and particularly at the end of the year. Reverse repos declined after the Fed started reducing its assets during Quantitative Tightening in 2018 and 2019. But the current record spike is taking place in the middle of the quarter, a sign that the enormous amount of liquidity is going haywire:

This is a crazy situation that the Fed backed into.

Even as liquidity is going haywire, and as the Fed trying to deal with it via reverse repos, the Fed is still buying about $120 billion per month in Treasury securities and mortgage-backed securities, thereby adding liquidity.

…click on the above link to read the rest of the article…

Fed Drains $351 Billion in Liquidity from Market via Reverse Repos, as Banking System Creaks under Mountain of Reserves

Fed Drains $351 Billion in Liquidity from Market via Reverse Repos, as Banking System Creaks under Mountain of Reserves

This is the first time I’ve seen Wall Street banks clamor for the Fed to back off QE. The Fed is struggling to keep the liquidity it created from going haywire.

In the fall of 2019, when the repo market blew out, the Fed stepped in and bought Treasury securities and MBS and handed out cash via repurchase agreements. When these repos matured, the Fed got its money back, and the counterparties got their securities back. The Fed also did this during the market rout in March 2020. But by July 2020, the last repos matured and were unwound.

Now the Fed is doing the opposite, with “reverse repos.” Repos are assets on the Fed’s balance sheet. Reverse repos are liabilities. With these reverse repos, the Fed is now massively selling Treasury securities to counterparties and taking their cash, thereby draining liquidity from the market – the opposite effect of QE.

This morning, the Fed sold $351 billion in Treasury securities via overnight reverse repos to 48 counter parties, thereby blowing past the brief spike at the end of March 2020, and more than replacing yesterday’s $294 billion in Treasury securities that it has sold via reverse repos to 43 counterparties and that matured and unwound this morning.

These reverse repos are a sign that the banking system is struggling to deal with the liquidity that the Fed has been injecting via its QE. And that’s in part why there is now some clamoring on Wall Street for the Fed to taper its QE purchases because the banking system is now drowning in liquidity that banks have as reserves on their balance sheet. By buying Treasuries in the repo market, the banks lower their reserves and increase their Treasury holdings.

…click on the above link to read the rest of the article…

Olduvai IV: Courage
Click on image to read excerpts

Olduvai II: Exodus
Click on image to purchase

Click on image to purchase @ FriesenPress