Home » Posts tagged 'rig count' (Page 2)
Tag Archives: rig count


Essential Oil Production Statistics – February 2015
Essential Oil Production Statistics – February 2015
This is the second in a monthly series of posts chronicling the action in the global oil market in 12 key charts. The January 2015 post is here. EIA oil price and Baker Hughes rig count charts are updated to end January 2015, the remaining oil production charts are updated to December 2014 using the IEA OMR data. The main oil production changes from November to December are:
- World total liquids up 150,000 bpd
- OPEC up 80,000 bpd
- N America up 80,000 bpd
- Russia and FSU up 180,000 bpd
- Europe down 70,000 bpd (compared with December 2013)
- Asia down 60,000 bpd
1. The continued growth in production into December shows that global production growth had significant momentum that has not yet been curtailed by the price rout.
2. The fall in the oil price continued throughout January, WTI hitting a low of $44.80 on January 26th and Brent hitting a low of $45.13 on January 13th.
3. The main dynamic statistic has been the plunge in US oil rig count down to 1223 rigs on January 30th from a recent high of 1609 rigs on October 10th 2014.
4. The rig count news led to a strong rally in oil price on 30th January.
5. I anticipate that the price rout is not yet over and it will require significant falls in production to take root before a real price recovery gets underway.
…click on the above link to read the rest of the article…
What The Rig Plunge Really Means For The Price Of Oil
What The Rig Plunge Really Means For The Price Of Oil
Arguably the biggest catalyst for the surge in crude, in addition to the technical move which started off with a vicious short squeeze into the NYMEX close last Friday, was last week’s record drop in the Baker Hughes rig count to 1,223, down from 1,609 just three months earlier. That, coupled with the ever louder reports of majors and all other energy companies cutting CapEx, has led some to believe that the supply imbalance is finally starting to normalize, and that production in the coming months will sharply drop off. However, as Morgan Stanley’s Adam Longson explains, that is not nearly the case.

Here are his big picture thoughts on what the recent rig count drop relaly means:
…click on the above link to read the rest of the article…
Worldwide Drilling Productivity Report
Worldwide Drilling Productivity Report
The EIA publishes what they call a Drilling Productivity Report in which they claim that each rig is getting more productive, that is each rig produces just a little more oil each month than it did the previous month. But over the long haul, I find that the exact opposite is true. In every place in the world, each rig produces a little less oil every year.
Baker Hughes publishes monthly their International Rig Count where we can find the world rig count back to 1975. However I only looked at the last 15 years and found some surprising results.
The last “Rig Count” data point on all charts below is December 2014. Also, very important, the rig count includes rigs drilling for gas as well as oil since Baker Hughes does not break down international rigs down to either gas or oil. They just give us the total rig count.
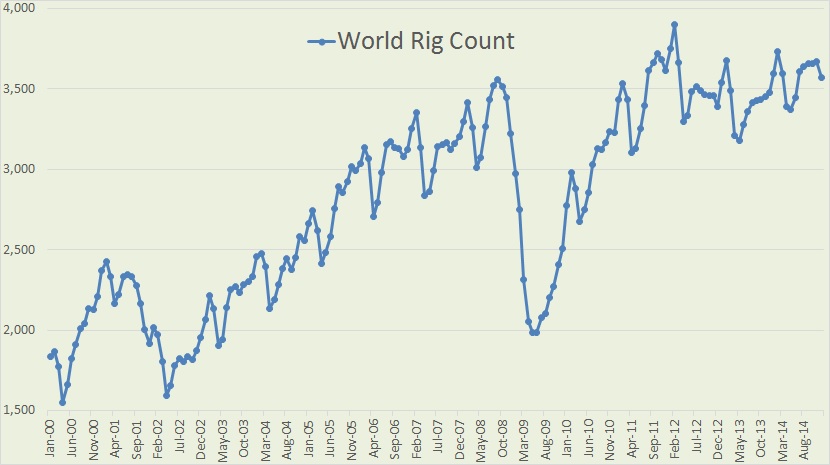
The last price collapse we had, in late 2008, the rig count dropped by over 1,570 between September 2008 and May 2009.
…click on the above link to read the rest of the article…
Oil Price Collapse Hurting Some More Than Others
Oil Price Collapse Hurting Some More Than Others
U.S. oil and gas rig counts dropped to their lowest level in over four years, falling by an additional 74 units for the week ending on January 16. The lower count provides fresh evidence that low oil prices are forcing drillers to pare back operations and slash spending.
While that may soon begin to cut into actual production figures, a new Wood Mackenzie report finds a lot of nuance in the oil patch, painting a complex picture of what to expect in 2015. The report identifies several trends beyond the simple narrative that low prices will force a cutback in drilling.
First, Wood Mackenzie estimates that at $40 per barrel, many producing wellscould be shut in. In fact, about 1.5 million barrels per day of production would be “cash negative” – meaning it wouldn’t even make sense to continue pumping at the most marginal wells, which tend to have extremely low-output. These “stripper wells,” which only produce 15 barrels of oil per day or less, have high costs given their level of production.
Related: Oil Industry Withdraws From High Cost Areas
Wells producing such a tiny flow of oil may seem like a nonissue, but withhundreds of thousands of them dotting the country, they collectively account for about one-tenth of the nation’s production. As these wells become unprofitable, production should start declining.
…click on the above link to read the rest of the article…
Guest Post: Calculating The Breakeven Price For The Median Bakken Shale Well | Zero Hedge
Guest Post: Calculating The Breakeven Price For The Median Bakken Shale Well | Zero Hedge.
A lot of data has been thrown around recently concerning the Bakken shale wells of North Dakota in an attempt to figure out the necessary oil price required to break even on the investment. In order to get a clearer picture of the financial situation in Bakken, it is necessary to develop a financial model of the median Bakken well (attached).
The median Bakken well has the following attributes:

With a discount rate of 15%, the median well has a profitability index of 1.02 (after federal income tax) if $66 per barrel is used. (A profitability index of 1.0 indicates a break even situation at the discount rate that was used in the model). This means that at $66 per barrel, half the wells are uneconomic. If oil prices settle out at this price it can be expected that the number of wells drilled should be reduced by about half.
US Oil Rig Count Tumbles Most In Over 5 Years,”Demand From Oilfield Customers Dropping Rapidly” | Zero Hedge
“Unequivocally” not good. Following last week’s surge in initial jobless claims for ‘Shale’ states, Baker Hughes confirms rig counts continue to tumble. The last two weeks have seen the total US rig count fall the most since 2009 (and Canada down 9.3% this week alone). Seemingly confirming this weakness, The Kansas City Fed notes respondents see non-durable (petroleum) demand “sluggish”, and rather awkwardly against the “everything’s great meme,” one respondent exclaims, “demand from oilfield customers is dropping rapidly.” The current US rig count is now the lowest in 5 months.
US Rig Counts are sliding fast…

But just as in 2008, there is a lag… this has only just begun…
US Oil Rig Count Tumbles Most In 2 Years | Zero Hedge
US Oil Rig Count Tumbles Most In 2 Years | Zero Hedge.
We warned just a week ago that the lag between initial price declines in oil and the closure of rigs was between 4 and 6 months and just as we warned of the deja-vu all over again, Banker Hughes reports that the Rig Count this week dropped the most since March 2013 (oil rigs dropped 29 to 1546 – biggest weekly drop in 2 years). The biggest drop was seen in the Permian Basin (down 20 to 548). Of course, it’s being ignored for now, just as it was in 2008…
Worst weekly drop in rig count since March 2013…

With Oil Rigs down 3rd most in 5 years…

And as a reminder, what happened last time…
…click on the above link to read the rest of the article…
Global Drilling Slowdown On The Way
Global Drilling Slowdown On The Way.
- Baker Hughes rig count statistics show how drilling reacted to earlier falls in the oil price. There is always a time lag of months between an oil price event and a change in drilling. There are faint signs of US drilling starting to turn down and quite clear signs that Middle East OPEC drilling has turned down.
- Drilling in Iraq is down significantly from 94 oil rigs in July to 56 rigs in October, but there are likely other reasons for that.
- The oil industry in the USA and the Middle East has changed markedly in the last decade and I believe the production response to reduced drilling will be much more pronounced in both areas than before. History doesn’t repeat itself, but it does rhyme (Joseph Anthony Wittreich).

Figure 1 Baker Hughes rig count for the USA and oil price described in the text. Note how peaks and troughs in drilling lag the oil price. Also some uncertainty in drilling strategy the last three years as oil price fluctuated within narrow bounds. But the oil price has now broken down and I believe it is inevitable that drilling follows. Never before has US oil production been so heavily linked to drilling activity.
…click on the above link to read the rest of the article…

