Home » Posts tagged 'qt' (Page 2)

Tag Archives: qt

Olduvai
Click on image to purchase

Olduvai III: Catacylsm
Click on image to purchase

Post categories

Post Archives by Category

Drain, drain, drain…

Drain, drain, drain…

Money from thin air going back whence it came from – circling the drain of a ‘no reinvestment’ black hole strategically placed in its way by the dollar-sucking vampire bat Ptenochirus Iagori Powelli.

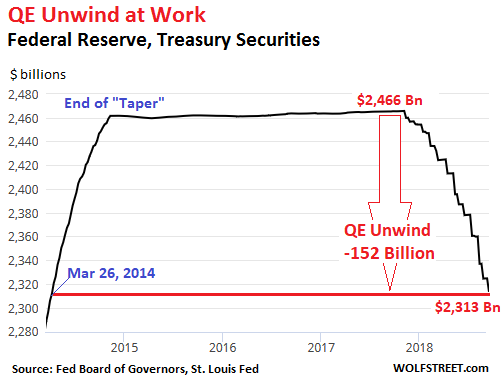
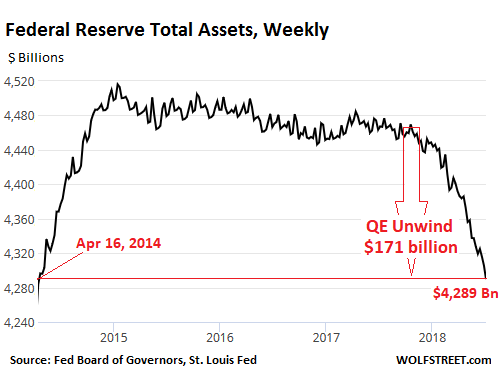
Our friend Michael Pollaro recently provided us with an update of outstanding Fed credit as of 26 December 2018. Overall, the numbers appear not yet all that dramatic, but the devil is in the details, or rather in the time frames one considers.

The pace of the year-on-year decrease in net Fed credit has eased a bit from the previous month, as the December 2017 figures made for an easier comparison – but that is bound to change again with the January data. If one looks at the q/q rate of change, it has accelerated rather significantly since turning negative for good in April of last year.

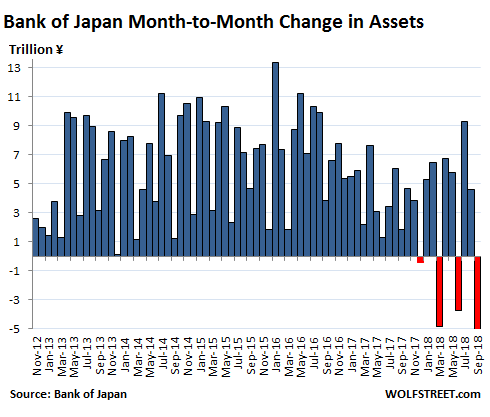
Below are the most recent money supply and bank lending data as a reminder that   “QT” indeed weighs on money supply growth rates. It was unavoidable that the slowdown in money supply growth would have an impact on asset prices and eventually on economic activity.

Note that in the short to medium term, the effects exerted by money supply growth rates are far more important than any of the president’s policy initiatives, whether they are positive (lower taxes, fewer regulations) or negative (erection of protectionist trade barriers). The effects of changes in money supply growth are also subject to a lag, but in this case the lag appears to be over.

Any effects seemingly triggered by “news flow” are usually only of the very short term knee-jerk variety, and they are often anyway the opposite of what one would normally expect – particularly in phases when news flow actually lags market action (see the recent case of disappointingly weak PMI and ISM data). The primary trend cannot be altered by these short term gyrations.

…click on the above link to read the rest of the article…


The Fed Is Tightening More Than It Realizes

The Fed Is Tightening More Than It Realizes

effects of fed balance sheet reduction

Before the 2008 collapse of Lehman Brothers, the Fed’s balance sheet stood at $925 billion—mostly U.S. Treasury securities. After 59 months of asset purchases to push down longer-term interest rates, it had ballooned to a peak of $4.5 trillion, including nearly $1.8 trillion in mortgage securities, in 2014.

In October of 2017, the Fed at last began a slow slimming-down of its balance sheet, allowing a growing amount of maturing securities to roll off monthly without reinvesting the proceeds. In former Fed chair Janet Yellen’s words, the central bank did “not have any experience in calibrating the pace and composition of asset redemptions and sales to actual prospective economic conditions.” She therefore stressed that the Fed saw its balance-sheet reduction primarily as a technical exercise separate from the pursuit of its monetary policy goals—in particular, pushing inflation back up to 2%. The Fed’s main tool for tightening monetary policy in a recovering economy would, therefore, she explained, be raising short-term market interest rates by paying banks greater interest on reserves (IOR). Since December 2015, the Fed has raised the rate on IOR by 195 basis points (1.95%), which has pushed up its short-term benchmark rate—the effective federal funds rate—in tandem.

By historical standards, the Fed’s rate hikes have been cautious. Even with inflation on target and unemployment at historic lows, the Fed has been raising short rates more gradually than in any tightening period going back to the 1950s.

We believe, however, that rate hikes understate the degree of tightening the Fed has imposed over the past year. The reason is that the Fed appears to be underestimating the impact of its balance-sheet reduction. Here is why.

…click on the above link to read the rest of the article…

The Fed Will Continue Tightening Until Everything Breaks

The Fed Will Continue Tightening Until Everything Breaks

fed's affect on the economy

Around three years ago, in September 2015, I wrote an article titled ‘The Real Reasons Why The Fed Will Hike Interest Rates‘ in which I predicted that the Federal Reserve, in the face of criticism, would soon pursue a program of interest rate hikes into economic weakness. I argued that this plan would be somewhat similar to what the Fed did in the early 1930’s; an action that prolonged the Great Depression for many more years. So far, my prediction has proven to be correct.

Despite the fact that the Fed keeps raising rates as it tightens the noose around the supposed economic “recovery”, there are still many people out there who refuse to accept that the central bank would deliberately implode the fiscal bubble that it has spent the last ten years inflating. Even today, I still see arguments proclaiming that the Fed will be forced to pull back if stocks fall beyond 15% to 20%. I also see claims that Fed officials like Jerome Powell had better start looking for another job because Donald Trump won’t be happy with Fed policies that could cause a crash. This is pure delusion from people who do not understand how the Fed operates.

First and foremost, let’s be clear, the Federal Reserve is an autonomous entity that does not answer to government oversight. It never has and it never will. This reality is supported by admission by former Fed officials like Alan Greenspan, who publicly noted that the Fed answers to no one.

The central bank functions in quite the opposite capacity from what many people assume. As Carroll Quigley, prominent American historian, noted in his book Tragedy And Hope:

…click on the above link to read the rest of the article…

Fed’s Balance Sheet Shrinks The Most Since Start Of QT; QE Unwind Hits $321 Billion

On Monday, when discussing the two key, opposing forces facing stocks this week, we said that while on one hand stock buybacks will make a triumphant return, as companies with $50bn of quarterly buybacks exited their blackout periods, and the total number of permitted stock repurchases jumps to $110bn by the end of next week and to $145bn the following…

… the offset of the favorable flows from corporate buybacks would be the Fed itself, as the largest Fed balance-sheet reduction-to-date ($-33.3B) would take place on Halloween.

And sure enough, one month after the Fed quantitative tightening entered its peak monthly unwind phase, during which the Fed’s balance sheet is scheduled to shrink by “up to” $30 billion in Treasuries and “up to” $20 billion in MBS a month, for a total of “up to” $50 billion a month, on October 31 the balance sheet declined by $33.8 billion  – the biggest weekly total yet – consisting of $23.8 billion in Treasuries, $8 billion in Mortgage Backed Securities, and a modest decline in various other assets.

As a result of Wednesday’s maturities, the Fed’s balance sheet has now shrunk by $321 billion to $4.140 trillion, the lowest since February 12, 2014; since October 2017, when the Fed began its QE unwind, it has now shed $321 billion, or just over 7% from its all time highs.

While MBS totals shifted around over the month, the Treasury decline took place in one day as there were no Treasury securities maturing on Oct. 15, while three security issues matured all in one day on Oct. 31, totaling $23 billion. Those were allowed to “roll off” entirely without replacement. In other words, the Treasury Department paid the Fed $23 billion for them, money which the Fed will promptly “shred”, digitally speaking.

…click on the above link to read the rest of the article…

“Peak QE”: This Is What Share Of The Market Central Banks Now Own

After a decade of unprecedented liquidity injections by central banks to preserve the western financial system, global QE has peaked.

First, the aggregate balance sheet of major central banks started to shrink earlier in the year, a reversal that took investors many months to notice but judging by recent market volatility, it is finally being fully appreciated.

Second, beginning this month the Fed’s bond portfolio run-offs as part of its QT are roughly offsetting the combined tapered net QE purchases by the ECB and BoJ. Worse, QT is now set to dominate.

Some facts: between mid-2008 and early 2018, the “Big-6” central banks expanded their balance sheets by nearly $15tn, most of it due to explicit targeted purchases of domestic assets (QE) in addition to other forms of liquidity injections (collateralised lending such as the ECB’s TLTROs or FX interventions equivalent to foreign-asset QE).

According to Deutsche Bank estimates, the four major central banks involved in QE (Fed, ECB, BoJ and BoE) are now collectively holding $11.3tn of securities accumulated through their asset purchase programs.

Why is the above important? Because as Deutsche strategist Michal Jezek, now that liquidity is contracting makes for a timely moment for looking at the proportion of relevant asset classes owned by central banks and putting the ECB’s corporate bond holdings into a wider context.

To begin, as Jezek confirms what we have been saying since the start of 2009, “clearly, QE matters.” As central banks reduced the free float of some securities and QE has worked its magic on confidence and growth, asset valuations reached unprecedented levels while volatility became suppressed. A couple of years ago, a quarter of the global bond market was trading with a negative yield. With global QE fading, this proportion has now fallen by half but remains significant.

…click on the above link to read the rest of the article…

Blain: “We Are Finally Approaching The End Phase Of The 2008 Global Financial Crisis”

Blain’s Morning Porridge, Submitted by Bill Blain

“I found Rome a City of Bricks and left it a City of Marble.”

In the Headlights this morning – see www.morningporridge.com for some of the stories I’m watching:

Debt Leverage: Interesting quote I came across y’day. Which country are we talking about? A) Germany, B) Italy, C) China or D) US?  10 points for the first correct answer. (And remember points mean prizes): “local credit rating agencies have applied absurdly optimistic standards, giving top ratings to companies that rank among the most highly leveraged in the world.”

Global Markets?

Null Entrophy sums up the market’s current energy. Stocks seem to have lost their mojo. Even a major boost from the Chinese government expressing its love for the market failed to restore the mood. Indices have stalled. Funnily enough – a number of portfolio managers tell me we seem to be getting to equity price levels where dividend yields make sense for traditional economy names.

Meanwhile, I’m being told by some fixed income managers they see value in current yields in the face of potential global slowdown. Whether they are right or wrong depends on where the global economy goes and if central banks hold their tightening course. (That said, I’ve got to giggle when certain commentators are calling for central banks to ease to save stock markets – FFS! that would be an absolute abrogation of the Invisible Hand, and a far greater offense than bailing out banks… markets need creative destruction to evolve and function!)

What’s really happening? There is a very serious reassessment of trends and expectations underway in both bonds and stocks which could spell trouble all round! It feels like we are finally approaching the end-phase of the 2008 Global Financial Crisis…

…click on the above link to read the rest of the article…

QE Party Is Drying Up, Even at the Bank of Japan

QE Party Is Drying Up, Even at the Bank of Japan

Despite repeated speeches to the contrary.

As of September 30, total assets on the Bank of Japan’s elephantine balance sheet dropped by ¥5.4 trillion ($33 billion) from a month earlier, to ¥537 trillion ($4.87 trillion). It was the fourth month-over-month decline in a series that started in December. This chart shows the month-to-month changes of the balance sheet. Despite all the volatility, the trend since mid-2016 is becoming clear:

Abenomics became the economic religion of Japan in later 2012, and “QQE” (Qualitative and Quantitative Easing) was an integral part of it. So has the “QQE Unwind” commenced? Are central bankers, even at the Bank of Japan, getting cold feet about the consequences?

At BOJ policy meetings, concerns have been voiced over  the “sustainability” of the stimulus program, according to the minutes of the July meeting, released on September 25. So the BOJ staff “proposed measures to enhance the sustainability of the current monetary easing while taking into consideration, for example, their effects on financial markets.”

And “flexibility” has been proposed as solution to those concerns.

The minutes reiterated that the BOJ would continue to buy Japanese Government Bonds (JGBs) in “a flexible manner” so that its holdings would increase by about ¥80 trillion a year.

But this is precisely what has not been happening, in line with this “flexibility.” Over the past 12 months, the BOJ’s holdings of JGBs rose by “only” ¥26.2 trillion – not ¥80 trillion. And they declined in September from the prior month (more in a moment).

Shortly after the minutes had been released, BOJ Governor Haruhiko Kuroda, once the most reckless among the money printers, changed his tune and said in a speech that, “in continuing with powerful monetary easing, we now need to consider both its positive effects and side-effects in a balanced manner.”

…click on the above link to read the rest of the article…

The Fed’s In A Box And People Are Starting To Notice

The Fed’s In A Box And People Are Starting To Notice

It’s long been an article of faith in the sound money community that the Fed, by bailing out every dysfunctional financial entity in sight, would eventually be forced to choose between the deflationary collapse of a mountain of bad debt and the inflationary chaos of a plunging currency.

That generation-defining crossroad is finally in sight.

On one hand, a tight labor market is pushing inflation to levels that normally call for higher interest rates:


source: tradingeconomics.com


source: tradingeconomics.com

Today’s Fed-heads are old enough to remember the 1970s, when failure to get inflation under control produced a decade-long monetary crisis that was only resolved with (not exaggerating here) interest rates approaching 20%.

On the other hand, the yield curve – the difference between long-term and short-term interest rates – is trending towards zero and will, if it keeps falling, invert, meaning that short rates will exceed long. When this has happened in the past a recession has ensued.

yield curve Fed's in a box

With a system this highly leveraged it’s completely possible that the next recession will threaten the whole fiat currency/globalization/fractional reserve banking world. No one at the Fed wants to preside over that, leading some to view rising inflation as the lesser of two evils. See Atlanta Fed Chief Pledges to Oppose Hike Inverting Yield Curve.

A lot of people seem to be aware of the Fed’s dilemma. Here’s an excerpt from a recent Reuters article on the subject:

Fed’s Powell between a rock and hard place: Ignore the yield curve or tight job market?

Unemployment near a 20-year low screams at the U.S. Federal Reserve to raise interest rates or risk a too-hot economy. The bond market, not far from a state that typically precedes a recession, says not so fast.

…click on the above link to read the rest of the article…

BCA: The “Bubble In Everything” Threatens $400 Trillion In Assets

By now, it’s a very familiar question: how high can the Fed hike rates before it causes a major market “event.”

Two weeks ago, Stifel analyst Barry Banister became the latest to issue a timeline on how many more rate hikes the Fed can push through before the market is finally impacted. According to his calculations, just two more rate hikes would put the central bank above the neutral rate – the interest rate that neither stimulates nor holds back the economy. The Fed’s long-term projection of its policy rate has risen from 2.8% at the end of 2017 to 2.9% in June. As the following chart, every time this has happened, a bear market has inevitably followed.

A similar argument was made recently by both Deutsche Bank and Bank of America, which in two parallel analyses observed last year that every Fed tightening cycle tends to end in a crisis.

Now, it’s the turn of BCA research to warn that ultimately the fate of risk assets depends on the relative size of the inflationary impulse being spawned by the Fed vs the remnant disinflationary impulse from monetary policies over the past decade.

In a report issued on Friday, BCA’s strategists make the key point that the performance of bonds – and stocks – in an inflation scare would depend on the relative size of the inflationary impulse compared with the disinflationary impulse that resulted from sharply lower risk-asset prices.

They make the point that if central banks were more concerned about the inflationary impulse, which at least for Fed chair Powell appears to be the case for now – Janet Yellen’s “lower for longer revised forward guidance” notwithstanding – they would have to keep tightening – in which case, bond yields would be liberated to reach elevated territory.

…click on the above link to read the rest of the article…

The Fed’s QE Unwind Hits $250 Billion

The Fed’s QE Unwind Hits $250 Billion

Here’s my math when this “balance sheet normalization” will end.

In August, the Federal Reserve was supposed to shed up to $24 billion in Treasury securities and up to $16 billion in Mortgage Backed Securities (MBS), for a total of $40 billion, according to its QE-unwind plan – or “balance sheet normalization.” The QE unwind, which started in October 2017, is still in ramp-up mode, where the amounts increase each quarter (somewhat symmetrical to the QE declines during the “Taper”). The acceleration to the current pace occurred in July. So how did it go in August?

Treasury Securities

The Fed released its weekly balance sheet Thursday afternoon. Over the period from August 2 through September 5, the balance of Treasury securities declined by $23.7 billion to $2,313 billion, the lowest since March 26, 2014. Since the beginning of the QE-Unwind, the Fed has shed $152 billion in Treasuries:

The step-pattern of the QE unwind in the chart above is a consequence of how the Fed sheds Treasury securities: It doesn’t sell them outright but allows them to “roll off” when they mature; and they only mature mid-month or at the end of the month.

On August 15, $23 billion in Treasuries matured. On August 31, $21 billion matured. In total, $44 billion matured during the month. The Fed replaced about $20 billion of them with new Treasury securities directly via its arrangement with the Treasury Department that cuts out Wall Street – the “primary dealers” with which the Fed normally does business. Those $20 billion in securities were “rolled over.”

But it did not replace about $24 billion of maturing Treasuries. They “rolled off” and became part of the QE unwind.

Mortgage-Backed Securities (MBS)

…click on the above link to read the rest of the article…

The Anatomy of a Crisis: A Strong Dollar and Disappearing Liquidity

The Anatomy of a Crisis: A Strong Dollar and Disappearing Liquidity

Since March – the dollar’s rallied over 7%. And it’s caused the Emerging Markets to implode.

But the bigger problem is what lies ahead.

And that’s a global dollar shortage – which the mainstream continues to ignore. . .

I’ve touched on this a couple months back. Wondering when the mainstream would start to realize that the stronger the dollar gets – the more pressure global economies will feel.

I wrote. . . “This is going to cause an evaporation of dollar liquidity – making the markets extremely fragile. Putting it simply – the soaring U.S. deficit requires an even greater amount dollars from foreigners to fund the U.S. Treasury. But if the Fed is shrinking their balance sheet, that means the bonds they’re selling to banks are sucking dollars out of the economy (the reverse of Quantitative Easing which was injecting dollars into the economy). This is creating a shortage of U.S. dollars – the world’s reserve currency – therefore affecting every global economy.”

Since then, things have only gotten worse. . .

First: Jerome Powell – the Fed Chairman – issued a statement at the end of June that they would actually increase the amount of rate hikes over the next two years. This means they’re tightening even faster.

Second: the U.S. Treasury increased their debt-borrowing needs to the highest since the financial crisiswhich was over a decade ago. Therefore, they will need even more dollars to fund their spending.

The department expects to issue $329 billion in net marketable debt from July through September, the fourth-largest total for that quarter on record and higher than the $273 billion estimated in April [a 17% increase], the Treasury said in a report Monday. The department’s forecast for the October-December quarter is $440 billion, bringing the second-half borrowing estimate to $769 billion, the highest since $1.1 trillion in July-December 2008…”

…click on the above link to read the rest of the article…

Update on the Fed’s QE Unwind

Update on the Fed’s QE Unwind

With QE, the Fed created money to buy securities and pump up asset prices; now it sheds securities to destroy this money.

Here’s what the Fed’s QE unwind – or the balance sheet normalization, as it calls it – is all about: it reverses over an unknown span of years a large part of what QE had done over the span of five-and-a-half years. During QE, whose stated purpose was the “wealth effect,” the Fed amassed $3.4 trillion in Treasury securities and mortgage-backed securities (MBS). Just as the Fed spent a year tapering QE to zero, it is now spending a year ramping up the QE unwind.

Total assets on the Fed’s balance sheet for the week ending July 4 dropped by $29.4 billion over the past four weeks. This brought the total drop since October, when the QE unwind began, to $171 billion. At $4,289 billion, total assets are now at the lowest level since April 16, 2014, during the middle of the “taper.”

The Fed’s announced plan calls for shedding up to $420 billion in securities this year and up to $600 billion a year in each of the following years until the Fed considers its balance sheet to be “normalized” — or until something major goes awry. For June, the plan calls for the Fed to shed up to $18 billion in Treasuries and up to $12 billion in MBS. So how did it go?

Treasury securities

The balance of Treasury securities fell by $17.5 billion in June to $2,360 billion, the lowest since May 7, 2014. Since the beginning of the QE-Unwind, $105 billion in Treasuries “rolled off.”

The step-pattern in the chart below is a result of how the Fed sheds securities. It doesn’t sell them outright but allows them to “roll off” when they mature. Treasuries only mature mid-month or at the end of the month. Hence the stair-steps.

…click on the above link to read the rest of the article…

Next Central Bank Puts QE Unwind on the Calendar

Next Central Bank Puts QE Unwind on the Calendar

The end of an era spreads.

Markets were surprised today when the Bank of England took a “hawkish” turn and announced that three out of nine members of its Monetary Policy Committee – including influential Chief Economist Andrew Haldane, who’d been considered dovish – voted to raise the Bank Rate to 0.75%, thus dissenting from the majority who kept it at 0.5%. This dissension, particularly by Haldane, communicated to the markets that a rate hike at the next meeting in August is likely. The beaten-down UK pound jumped.

But less prominent was the announcement about the QE unwind. Like other central banks, the BoE heavily engaged in QE and maintains a balance sheet of £435 billion ($577 billion) of British government bonds and £10 billion ($13 billion) in UK corporate bonds that it had acquired during the Brexit kerfuffle.

Before it starts shedding assets on its balance sheet, however, the BoE wants to raise the Bank Rate enough to where it can cut it “materially” if needed, “reflecting the Committee’s preference to use Bank Rate as the primary instrument for monetary policy,” as it said.

In this, it parallels the Fed. The Fed started its QE unwind in October 2017, after it had already raised its target range for the federal funds rate four times.

The BoE’s previous guidance was that the QE unwind would start when the Bank Rate is “around 2%.” Back in the day when this guidance was given, NIRP had broken out all over Europe, and pundits assumed that the BoE would never be able to raise its rate to anywhere near 2%, and so the QE unwind could never happen.

Today the BoE moved down its guidance about the beginning of the QE unwind to a time when the Bank Rate is “around 1.5%.”

…click on the above link to read the rest of the article…

“Dollar Is King”: Indonesia Joins India In Begging Fed To Stop Shrinking Its Balance Sheet

It’s getting a little tight around the neck for emerging market central bankers.

On the same day that the governor of Malaysia’s central bank quit, and just days after Urjit Patel, governor of the Reserve Bank of India, took the unprecedented step of writing an oped to the Federal Reserve, begging the US central bank to step tightening monetary conditions, and shrinking its balance sheet, thereby creating a global dollar shortage which has slammed emerging markets (and forced India into an unexpected rate hike overnight), Indonesia’s new central bank chief joined his Indian counterpart in calling on the Federal Reserve to be “more mindful” of the global repercussions of policy tightening amid the ongoing rout in emerging markets.

As Bloomberg reports, in his first interview with international media since he took office two weeks ago, Bank Indonesia Governor Perry Warjiyo – who bears a remarkable resemblance to what Jamie Dimon would look like if he were about 40 pounds overweight – echoed what Patel said just days earlier, namely that the pace of the Fed’s balance sheet reduction was a key issue for central bankers across emerging markets.

Bank Indonesia Governor Perry Warjiyo

As a reminder, the RBI Governor made exactly thew same comments earlier this week, arguing that slowing the pace of stimulus withdrawal at a time when the US Treasury is doubling down on debt issuance, would support global growth, as the alternative would be an emerging markets crisis that would spill over into developed markets.

In a thinly veiled warning addressing the Fed, Warjiyo said that “we know every country must decide their policy based on domestic circumstances but look, you have to take account of your actions and the impact of your actions to other countries, especially the emerging markets.”

…click on the above link to read the rest of the article…

Swan Song Of The Central Bankers, Part 5: The Flat Line Does Not Spell Recovery

Swan Song Of The Central Bankers, Part 5: The Flat Line Does Not Spell Recovery

The punk January industrial production (IP) report brought another reminder that the Fed has stimulated nothing at all on the output/employment prong of its dual mandate.

Indeed, as they celebrate a purported “mission accomplished” full employment recovery and confidently prepare to plow forward with an epochal pivot to QT (quantitative tightening), our Keynesian central bankers have remained absolutely mum on this stunning fact: To wit, there has been no recovery at all in US industrial production, and that’s as in nichts, nada and nugatory.

In fact, January 2018 output in the manufacturing sector was still 2.2% below its December 2007 level, and total industrial production has barely crept forward at a 0.19% annual rate. And if you don’t think that is close enough to zero for government work, just recall what a real historical recovery looks like on the IP front.

During the December 2000 to December 2007 cycle, for example, total IP grew at 1.4% per annum and manufacturing output rose by 1.9% per annum on a peak-to-peak basis. Prior to that during the 1990-2000 cycle, the figures were 4.0% and 4.6% per annum, respectively.

And if you want to dial way back in time to the Reagan-Bush cycle from July 1981 to July 1990, the peak-to-peak growth trend for total industrial production was 2.3% per annum and 2.8% for manufacturing output. And, by your way, that cycle also included a deep recession in 1982 that was only slightly less severe than the 2008-2009 downturn.

In short, when you don’t get anywhere on industrial production over the course of 10 full years—-the Great Recession notwithstanding—you are not succeeding. And while you are bragging, you at least ought to attempt to explain or rationalize what is otherwise a screaming aberration in the modern history of business cycles.

…click on the above link to read the rest of the article…

Olduvai IV: Courage
Click on image to read excerpts

Olduvai II: Exodus
Click on image to purchase

Click on image to purchase @ FriesenPress