Home » Posts tagged 'Housing Bubble' (Page 2)

Tag Archives: Housing Bubble

Olduvai
Click on image to purchase

Olduvai III: Catacylsm
Click on image to purchase

Post categories

Post Archives by Category

There’s a New Crash Coming

There’s a New Crash Coming

Donald Trump is the epitome of irrational exuberance.

You might remember that phrase from the 1990s. Alan Greenspan, the head of the Federal Reserve at the time, was describing how the tech boom was creating a bubble by generating enthusiasm way out of proportion to the actual value of the new companies.

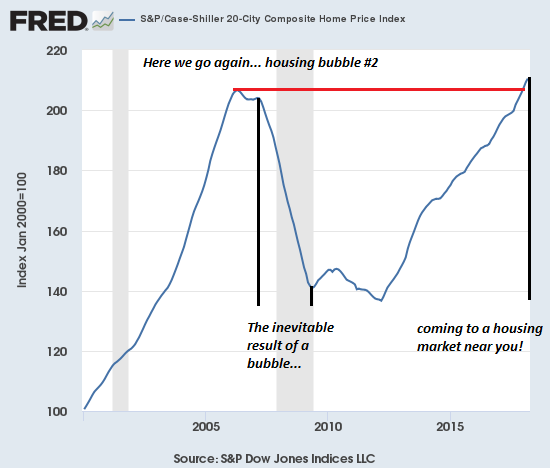
Such an unwarranted economic boom was hardly something new, so it was easy to predict what would happen next. Periods of irrational exuberance — whether the dot-com expansion, Dutch tulipmania in the 17th century, or the housing bubble in America of the 2000s — have always led to a sudden crash and a serious hangover.

And now, here we go again.

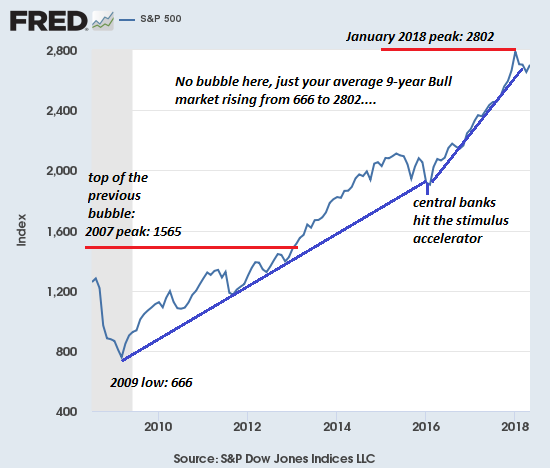
Trump, always exuberant when talking about himself and his putative accomplishments, loves to boast about how well the American economy is chugging along. The stock market reached its all-time high at the end of August. In its second quarter this year, U.S. economic growth was 4.1 percent. Unemployment remains below 4 percent, and inflation remains moderate. Even wages are going up.

Irrationality enters the picture because there’s little if any connection between the president’s policies and the outcomes he lauds (since these trends began before he took office). Also, the prosperity that has resulted from this economic expansion has largely been enjoyed by the wealthier sectors of society. Finally, Trump’s economic fever dream is fueled by an enormous and growing amount of debt.

When it comes to irrational exuberance, it’s never if there will be a bust but when. On the tenth anniversary of the financial collapse of 2008, it’s worth looking at the potential pinpricks that will pop Trump’s hot-air balloon and send America crashing back to earth.

Mountains of Debt

…click on the above link to read the rest of the article…

Evidence The Housing Bubble Is Bursting?: “Home Sellers Are Slashing Prices At The Highest Rate In At Least Eight Years”

Evidence The Housing Bubble Is Bursting?: “Home Sellers Are Slashing Prices At The Highest Rate In At Least Eight Years”

The housing market indicated that a crisis was coming in 2008.  Is the same thing happening once again in 2018?  For several years, the housing market has been one of the bright spots for the U.S. economy.  Home prices, especially in the hottest markets on the east and west coasts, had been soaring.  But now that has completely changed, and home sellers are cutting prices at a pace that we have not seen since the last recession.  In case you are wondering, this is definitely a major red flag for the economy.  According to CNBC, home sellers are “slashing prices at the highest rate in at least eight years”…

After three years of soaring home prices, the heat is coming off the U.S. housing market. Home sellers are slashing prices at the highest rate in at least eight years, especially in the West, where the price gains were hottest.

It is quite interesting that prices are being cut fastest in the markets that were once the hottest, because that is exactly what happened during the subprime mortgage meltdown in 2008 too.

In a previous article, I documented the fact that experts were warning that “the U.S. housing market looks headed for its worst slowdown in years”, but even I was stunned by how bad these new numbers are.

According to Redfin, more than one out of every four homes for sale in America had a price drop within the most recent four week period…

In the four weeks ended Sept. 16, more than one-quarter of the homes listed for sale had a price drop, according to Redfin, a real estate brokerage. That is the highest level since the company began tracking the metric in 2010. Redfin defines a price drop as a reduction in the list price of more than 1 percent and less than 50 percent.

…click on the above link to read the rest of the article…

Even Mortgage Lenders Are Repeating Their 2006 Mistakes

Even Mortgage Lenders Are Repeating Their 2006 Mistakes

You’d think the previous decade’s housing bust would still be fresh in the minds of mortgage lenders, if no one else. But apparently not.

One of the drivers of that bubble was the emergence of private label mortgage “originators” who, as the name implies, simply created mortgages and then sold them off to securitizers, who bundled them into the toxic bonds that nearly brought down the global financial system.

The originators weren’t banks in the commonly understood sense. That is, they didn’t build long-term relationships with customers and so didn’t need to care whether a borrower could actually pay back a loan. With zero skin in the game, they were willing to write mortgages for anyone with a paycheck and a heartbeat. And frequently the paycheck was optional.

In retrospect, that was both stupid and reckless. But here we are a scant decade later, and the industry is headed back towards those same practices. Today’s Wall Street Journal, for instance, profiles a formerly-miniscule private label mortgage originator that now has a bigger market share than Bank of America or Citigroup:

The New Mortgage Kings: They’re Not Banks

One afternoon this spring, a dozen or so employees lined up in front of Freedom Mortgage’s office in Mount Laurel, N.J., to get their picture taken. Clutching helium balloons shaped like dollar signs, they were being honored for the number of mortgages they had sold.

Freedom is nowhere near the size of behemoths like Citigroup or Bank of America; yet last year it originated more mortgages than either of them, some $51.1 billion, according to industry research group Inside Mortgage Finance. It is now the 11th-largest mortgage lender in the U.S., up from No. 78 in 2012.

private label mortgage lenders

…click on the above link to read the rest of the article…

Housing Bubble Pops in Sydney & Melbourne, Australia

Housing Bubble Pops in Sydney & Melbourne, Australia

And with impeccable timing, an immense flood of new construction.

In Sydney, breeding ground for one of the world’s biggest housing bubbles, prices of single-family houses dropped 7.3% in August, compared to a year earlier. Prices of “units” — condos in US lingo — fell 2.2% year-over-year. Price declines were the sharpest at the high end, with prices down 8.1% in the most expensive quarter of home sales. Prices of all types of homes combined fell 5.6%, according to CoreLogic’s Daily Home Value Index. The index is down 5.8% from its peak last September:

Melbourne, where the inflection point has been lagging a few months behind Sydney’s, is in the process of catching up. Over the three month-period, June-August, prices fell 2.0%, making Melbourne the weakest housing market among the capital cities. By segment, house prices fell 2.7% from a year ago while condo prices still inched up 1.5%. At the most expensive quarter of sales, prices fell 5.2% from a year ago. For all types of dwellings combined, prices declined 1.7% year-over-year, to the lowest level since early June 2017, according to CoreLogic. Prices are down 3.6% from their peak at the end of November 2017:

Corelogic tracks the largest five of Australia’s eight capital cities in a separate index. Due to the size of their housing markets, Sydney and Melbourne weigh the most. In the remaining three of the five capital cities in the index, prices were mixed in August:

  • In Brisbane, home prices inched up 0.9% year-over-year.
  • In Adelaide, home prices ticked up 1.0%.
  • In Perth, home prices fell 2.0%, with houses down 1.5% and condos down 4.4%. Prices have been skidding since late 2014, when Western Australia mining boom turned into a mining bust.

The aggregate five capital cities index fell 3.1% in August year-over-year. The index has declined month-to-month for 11 months in a row and is down 3.5% from its peak in October 2017:

…click on the above link to read the rest of the article…

More Evidence The Economy Is Deteriorating

More Evidence The Economy Is Deteriorating

“Financial-market and economic prospects remain far shy of the hype and headlines, amidst tanking consumer optimism and negative revisions to recent reporting.” – John Williams, Shadowstats.com

The economy may seem like it’s doing well if you are part of the upper 10% demographic. Though, in reality, for most of the upper 10%, doing “well” has been a function of having easy access to credit. NASA Federal Credit Union is offering 0% down, 0% mortgage insurance for mortgages up to $2.5 million.

Someone I know suggested the tax cut stimulus had run its course. But the narrative that the tax cuts would stimulate economic activity was pure propaganda. The tax cuts stimulated $1 trillion in expected share buybacks and put more money in the pockets of corporate insiders and billionaires. The average middle class household spent its tax cut money on more expensive gasoline and food. Since the tax cut took effect, auto sales and home sales have declined. Retail sales have been mixed. However, it’s difficult to distinguish between statistical manipulation and inflation. I would argue that, net of real inflation and Census Bureau statistical games, real retail sales have been declining.

As an example, last week Black Box Intelligence released July restaurant sales. While comparable store sales were up 0.54% over July 2017, comparable restaurant traffic was down 1.8%. On a rolling three months, comp sales are up 0.46% but comparable traffic is down nearly 2%. With traffic declining, especially a faster rate relative to the small increase in sales, it means the sales “growth” is entirely a function of price inflation. If Black Box Intelligence could control it’s data for price increases, it would show that there is no question that real sales are declining. I have been loathe to recommend shorting restaurant stocks because, for some reason, the hedge funds love them.

…click on the above link to read the rest of the article…

Toxic Mix in Canada: Spiking Inflation, Variable-Rate Mortgages, and a Housing Bubble

Toxic Mix in Canada: Spiking Inflation, Variable-Rate Mortgages, and a Housing Bubble

What will the Bank of Canada do?

The Bank of Canada has nudged up its target rate four times, starting July a year ago, from 0.5% to 1.5%. It last hiked on July 11. But now it is facing inflation that suddenly and unexpectedly jumped at twice the Bank of Canada’s current target rate.

Canada’s Consumer Price Index (CPI) rose 3.0% in July from a year earlier, the hottest since September 2011, Statistics Canada reported on Friday. Consensus expectation was a rise of 2.5%, same as in June.

Prices rose in all major components. Prices for services – the largest part of consumer spending – jumped 3.2% year over year, up from a 2.2% increase in June.

In most provinces, CPI ran even hotter:

  • Alberta : 3.5%
  • Prince Edward Island: 3.4%
  • Manitoba: 3.3%
  • British Columbia: 3.3%
  • Ontario: 3.1%
  • Saskatchewan: 3.1%
  • Newfoundland and Labrador: 2.7%
  • Nova Scotia: 2.7%
  • New Brunswick: 2.7%
  • Quebec: 2.4:

But no problem.

Like the Fed and other central banks, the Bank of Canada has its “preferred” measures of inflation. And they’re a lot lower, of course. Which is the point. But unlike the Fed, it does not use a core index “without food and energy.” Instead, it has three measures (definitions) that have been statistically “trimmed:” CPI-trim, CPI-median and CPI-common.

Its stated goal is to keep inflation as measured by these three indices at the 2% midpoint of “an inflation-control range of 1% to 3%.” And this is how these three indices stacked up in July:

  • CPI-trim: 2.1%
  • CPI-median: 2.0%
  • CPI-common: 1.9%

Statistically trimming the hot items out of an index works miracles, though it makes this trimmed index even more meaningless to consumers because consumers, who live in the the real world, cannot trim those items out of their budgets quite so easily. So now, after a proper trimming of the index, the BOC is right on target.

…click on the above link to read the rest of the article…

Housing Bubbles Are Dangerous, That’s Why Canada is Finally Trying to Tamp Down on Them. And the US?

Housing Bubbles Are Dangerous, That’s Why Canada is Finally Trying to Tamp Down on Them. And the US?

Wolf Richter with Jim Goddard on This Week in Money:

The underlying dynamics are similar, but the approach is different.

Home prices experience a historic spike in Seattle, and sharp increases in other metros, but prices of condos in New York fall. Read…  The Most Splendid Housing Bubbles in America

Global Housing Bubble Is Popping. Here Comes The “Reverse Wealth Effect”

Global Housing Bubble Is Popping. Here Comes The “Reverse Wealth Effect”

Just a few months ago, real estate was on fire. Prices were blowing past records set during the previous decade’s housing bubble as desperate buyers bought whatever was available at above the asking price while homeowners, confident that prices would keep rising, held out for the next big pop to sell. Notice on the following chart how the ascent steepens at the beginning of this year.

home prices wealth effect

Then, as if someone flipped a switch, the trend shifted into reverse. Not just in the US but nearly everywhere. This list of recent headlines tells the tale:

Housing demand sees biggest drop in more than 2 years

Hamptons property sales slow as caution spreads to the wealthy

Home Prices Are Falling in One of America’s Richest Suburbs

First Time Ever, More Chinese sellers than buyers

Vancouver Suffers Its Worst July for Home Sales Since 2000

Record Drop in Foreigners Buying U.S. Homes

Australian home prices take biggest dip since 2011

The End of the Global Housing Boom

Manhattan Real Estate: Prices Plummet, Sales Tank

What’s happening and why is it happening now?
Several things came together pretty much simultaneously to turn houses from must-have-at-any-price necessities into completely optional and maybe not even desirable: First, prices rose beyond the reach of all but the seriously affluent. The gap between the price of the average home and the size of the mortgage the average local buyer can afford has been rising for years, but recently in the hottest markets it has become a chasm. Meanwhile, mortgage rates have started to rise, increasing the monthly payment on a given house dramatically.

mortgage rates wealth effect

If you live in San Francisco or Sydney or Vancouver, chances are you can’t afford to buy a decent house – not even close. And if you can’t you don’t.

…click on the above link to read the rest of the article…

A Housing Bubble Pops: Update on Australia

A Housing Bubble Pops: Update on Australia

It is rare that a housing market makes such a beautifully defined U-turn, after a long hard surge.

In Sydney, Australia’s largest housing market and one of the world’s biggest housing bubbles, prices of homes of all types fell 5.4% in July compared to a year ago, and 5.5% from the peak in September. Prices of single-family houses dropped 7.0%, and prices of condos (“units”) fell 1.6%, according to CoreLogic’s Daily Home Value Index:

The most expensive quarter of the market got hit the hardest, with prices down 8.0% in July compared to a year ago. Across the so-called “most affordable quarter of the market” – “least unaffordable” would be more appropriate – prices fell by 1.8%.

And supply in Sydney is starting to come out of the woodwork: Total number of homes listed for sale, based on a rolling 28-day count, jumped 22% from a year ago to 26,103 listings, according to CoreLogic, the most since July 2012.

In the chart below, the number of homes listed for sale in 2018 is denoted with the black line. It’s below only the blue line (2012), but creeping up on it. Note the seasonality, with listings getting pulled during the Christmas holiday period (chart via CoreLogic):

And so goes the rental market, where “conditions eased further in July,” CoreLogic noted in its report: In Sydney rents fell 0.4% year-over-year. While that might not sound like much of an annual decline, it is “the largest decline on record” in CoreLogic’s data going back over a decade.

Melbourne lags a few months behind Sydney but is now catching up. Home prices in Melbourne fell 0.5% in July year-over-year, according to CoreLogic, and are down 3.0% from their peak at the end of November 2017: House prices fell 1.4% from a year ago while condos are still up 2.3%. The index is now back where it had been at the end of June, 2017:

…click on the above link to read the rest of the article…

The greedy little nation that sold its soul for house prices

There was a time when Australia’s housing bubble was not much more than a curiosity. Contained mostly to Sydney it seemed it would pass with a little pop and be forgotten.

Then there was a time when the bubble went national. And suddenly the little pop was going to be a big pop so monetary and fiscal policy began to distort in support of it.

Next there was a time when moral hazard became so great that the bubble grew to engulf all policy and media, marginalising an entire generation from home ownership. Politicians routinely lied to cover the collapse in evidence based policy-making.

Finally, we come to today. When notions of managing the macro-economic levers of an economy now boil down to just one thing:

  • low interest rates to prevent the housing bubble bursting;
  • fiscal repair to prevent the bubble bursting, and
  • mass immigration to prevent the bubble bursting even though it is crushing living standards and gutting wages.

This classic slippery slope upon which one bad policy choice cannoned directly into the next is not over. Three ridiculous further steps are being mulled that will ensure the complete selling of the nation’s soul in a vain attempt to save house prices. The first is captured by Anthony Bubalo of the Lowy Institute:

Not long ago I listened to four Australians of Chinese heritage speak at the Lowy Institute about the impact on their communities of the foreign interference question. Some of the issues they raised were similar to those articulated by Muslim Australians when they talked about the effect of terrorism on their relationship with broader society.

…The government is certainly seized of this challenge. New legislation has been passed and a new position, the National Counter Foreign Interference Coordinator, has been created in the Department of Home Affairs, similar to the longer-standing position of Commonwealth Counter-Terrorism Coordinator.

…click on the above link to read the rest of the article…

Housing Bubble and Everything Bubble in One Simple Picture

To understand the magnitude of the housing bubbles simply compare the index of wages to the index of prices.

How Did We Get Here?

That’s easy.

Average Wages vs CPI

Note the correct CPU comparison for this chart is CPI-W not CPI-U, not that it matters much.

No matter what official CPI one uses, the chart is a joke. Why? The CPI only reflects rent, not actual housing prices.

The Fed made this mistake during the housing bubble and they made it again from 2011 to present.

More bubbles will burts and that is very deflationary. By chasing its tail, the Fed creates the very conditions it seeks to prevent.

Price Deflation Not a Problem

For years, the Fed desperately sought more inflation. However, a BIS Study on the Historical Costs of Deflation shows routine price deflation is not a problem.

According to the BIS, “Deflation may actually boost output. Lower prices increase real incomes and wealth. And they may also make export goods more competitive.”

Meanwhile, people keep faith in the Phillips’ Curve. It’s pathetic.

Related Articles

Here We Go Again: Our Double-Bubble Economy

Here We Go Again: Our Double-Bubble Economy

The bubbles in assets are supported by the invisible bubble in greed, euphoria and credulity.

Well, folks, here we go again: we have a double-bubble economy in housing and stocks, and a third difficult-to-chart bubble in greed, euphoria and credulity.

Feast your eyes on Housing Bubble #2, a.k.a. the Echo Bubble:

Here’s the S&P 500 stock index (SPX): no bubble here, we’re told, just a typical 9-year long Bull Market that has soared from a low in 2009 of 666 to a recent high of 2802 in January of this year:

Here’s a view of the same bubble in the Dow Jones Industrial Average (DJIA):

Is anyone actually dumb enough not to recognize these are bubbles? Of course not. Those proclaiming that “these bubbles are not bubbles” know full well they’re bubbles, but their livelihoods depend on public denial of this reality.

And so we’re inundated with justifications of bubble valuations, neatly bound with statistical mumbo-jumbo: forward earnings (better every day in every way!), P-E expansion, and all the rest of the usual blather that’s spewed by status quo commentators and fund managers at the top of every bubble.

The problem with bubbles is they always pop. The market runs out of Greater Fools and/or creditworthy borrowers, and so sellers overwhelm the thinning ranks of buyers.

Those dancing euphorically, expecting the music will never stop, are caught off guard (despite their confidence that they are far too clever to be caught by surprise), and the panic-driven crowd clogs the narrow exit, leaving a ballroom of bag-holders to absorb the losses.

The other problem with bubbles is that we’ve become dependent on them as props holding up a rotten, corrupt status quo. Since the economy can no longer generate sufficient prosperity to go around via actual increases in productivity and efficiency, those skimming most of the gains rely on “the wealth effect” generated by expanding asset bubbles to create a dreamy illusion of prosperity.

…click on the above link to read the rest of the article…

The 3 Stage Housing Bubble Collapse

The 3 Stage Housing Bubble Collapse

Most Americans don’t know, but the housing market is heading toward another epic bubble.  However, the bubble forming today is much different than the subprime housing meltdown in 2007.  Back in 2007, there was an oversupply of homes, whereas today there is a shortage.  With more buyers than sellers bidding up prices, the U.S. median home price value hit a new record high of $338,000 at the end of 2017.

Unfortunately, wages have not kept up with rising home values.  For example, the average hourly earnings have only increased 21% since 2009.  However, the U.S. median home price $330,000 in Q1 2018 is 53% higher:

Now, to make up for the shortage of homes in the high-demand cities across the country, the new-home building boom is once again on the rise.  The U.S. housing starts in March are up to 1.3 million from the low of 478,000 at the bottom of the 2009 recession.  Now, even though current housing starts are more than double what they were at the lows in 2009, they are nearly 50% less than the peak of 2.3 million in 2006.

However, there is a much different dynamic today as the cost to build a new home is much higher than it was in 2006.  At the peak in 2006, the U.S. median new home price was $262,000 versus the $337,000 in Q1 2018.  Moreover, the U.S. median new home price is 60% higher than the low in 2009:

Even though the average wages of an American increased 21% since 2009, the median new home price is 60% higher.  Part of the reason for the higher new home price is the increased demand but it’s also due to higher costs.  For example, the lumber price shut up 170% since the beginning of 2016.  When the U.S. median new home price reached a high of $262,000 in 2006, the price of lumber was $330.  Today, the lumber price isn’t quite double, but at $592, it’s pretty darn close:

…click on the above link to read the rest of the article…

Toronto’s Splendid Housing Bubble Turns to Bust

Toronto’s Splendid Housing Bubble Turns to Bust

Market freezes up at the top. Average price of detached house plunges C$175,000 in 12 months.

Home sales in the Greater Toronto Area (GTA), Canada’s largest housing market, and among the most inflated in the world, plunged 32% in April, compared to a year ago, to 7,792 homes, according to the Toronto Real Estate Board (TREB), a real estate lobbying group. The sales plunge affected all types of homes, even the once red-hot condos:

  • Detached houses -38.4%
  • Semi-detached houses -29.3%
  • Townhouses -22.1%
  • Condos -26.0%.

The sales slowdown was particularly harsh at the higher end: Sales of homes costing C$2 million or more collapsed by 64%. The market is freezing up at the top.

Prices follow volume. Both types of prices the TREB publishes – the average price and its proprietary MLS Home Price Index based on a “composite benchmark home” – fell from April last year. This is a confusing experience for the real estate industry, sellers, and buyers, since prices have ballooned for 18 years, interrupted by only one brief dip during the Financial Crisis, and the rule has been that prices will always go up and that you cannot lose money in real estate.

The average price in April for the Greater Toronto Area (GTA) plunged 12.3% year-over-year to C$804,584. A drop of C$113,600. By market:

  • In Toronto itself: -8.2% (-C$76,860) to C$865,817.
  • In the rest of the GTA without Toronto: -15.2% (-C$137,070) to C$767,359.

Detached houses – which are generally more expensive than other home types – got hit the hardest:

  • Detached houses -14.4% to C$1,030,103 (down by C$175,000)
  • Semi-detached houses -6.4% to C$792,385
  • Townhouses -7.8% to C$645,172
  • Condos +3.2% to C$559,343

While Condo prices still gained 3.2%, that gain was down from a 6.1% gain in March, and down from double-digit gains earlier.

…click on the above link to read the rest of the article…

“Canada Is In Serious Trouble” Again, And This Time It’s For Real

Some time ago, Deutsche Bank’s chief international economist, Torsten Slok, presented several charts which showed that  Canada is in serious trouble” mostly as a result of its overreliance on its frothy, bubbly housing sector, but also due to the fact that unlike the US, the average Canadian household had failed to reduce its debt load.

Additionally, the German economist demonstrated that it was not just the mortgage-linked dangers from the housing market (and this was before Vancouver and Toronto got slammed with billions in “hot” Chinese capital inflows) as credit card loans and personal lines of credit had both surged, even as multifamily construction was at already record highs and surging, while the labor market had become particularly reliant on the assumption that the housing sector would keep growing indefinitely, suggesting that if and when the housing market took a turn for the worse, or even slowed down as expected, a major source of employment in recent years would shrink.

Fast forward to last summer, when the trends shown by Slok three years ago had only grown more acute, with Canada’s household debt continuing to rise, its divergence with the US never been greater…

… making the debt-service ratio disturbingly sticky.

And yet despite all these concerning trends, virtually all of these red flags have been soundly ignored, mostly for one reason: the “wealth effect” in Canada courtesy of its housing market grew, and grew, and grew

Looking at the chart above, Bloomberg recently said that:

On a real basis, Canadian housing prices experienced a much smaller, shorter decrease in prices during the financial crisis and a much larger, longer increase in prices during the recovery. When you couple this unfathomable rise in housing prices with near-record high household debt-to-income ratios, the Canadian housing bubble starts to look scary should the tide turn.

…click on the above link to read the rest of the article…

Olduvai IV: Courage
Click on image to read excerpts

Olduvai II: Exodus
Click on image to purchase

Click on image to purchase @ FriesenPress