– Financial advice needed in 2019? Let six experts guide you
– Save regularly, switch your mortgage, check up on tax reliefs & hedge risks in 2019 by diversifying into gold
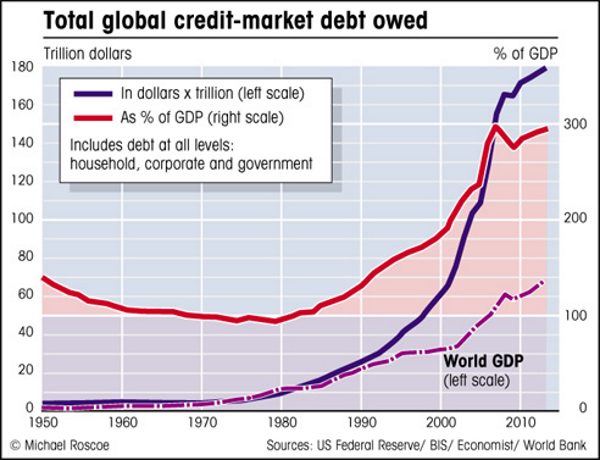
– “There are also very real risks posed by the global debt bubble as the world nears $250 trillion in debt and the global debt-to-GDP ratio has risen to nearly 320 per cent” say GoldCore
Excerpt from Irish Times today (subscriber only)
My resolution:
One financial resolution is to read and watch less financial news. I stay up to date with financial markets, including breaking financial news, as I have to write a market update every day and frequently provide comment to media.
However, in the age of Trump and Brexit, it can be hard to keep up with it all.
I am going to unsubscribe from many of the alerts I get and become more selective and focused in my news consumption. This will help filter out much of the daily and weekly market noise and help me get more valuable long-term signal.
We believe that diversification and owning gold as a hedge and safe haven asset will again be important in 2019.
My recommendation:
We live in an increasingly polarised and uncertain world which casts shadows over our economies and the investment outlook.
This is clearly seen with Brexit, the risk of “Italexit”, an increasingly fractured EU and Trump’s aggressive foreign and economic policies, including trade wars.
There are also very real risks posed by the global debt bubble as the world nears $250 trillion in debt and the global debt-to-GDP ratio has risen to nearly 320 per cent.
We believe that diversification and owning gold as a hedge and safe haven asset will again be important in 2019 and in the coming years.
…click on the above link to read the rest of the article…


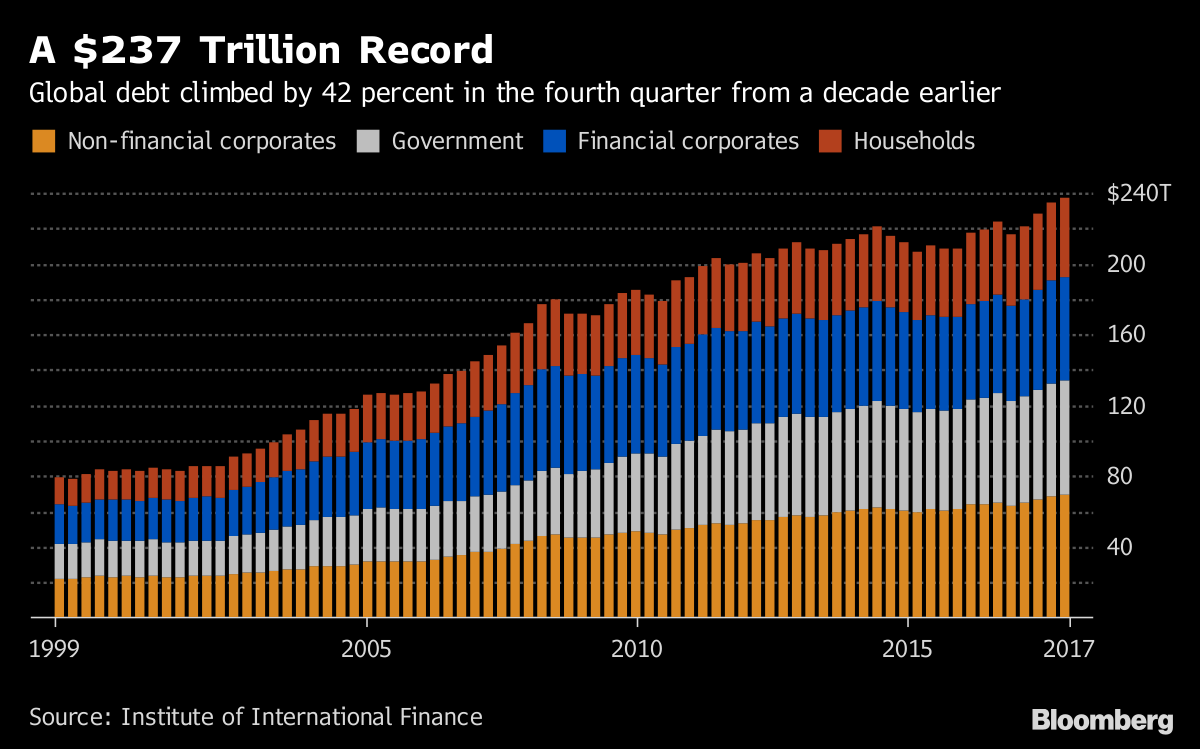 Source: Bloomberg