Home » Posts tagged 'energy information agency' (Page 2)

Tag Archives: energy information agency

Olduvai
Click on image to purchase

Olduvai III: Catacylsm
Click on image to purchase

Post categories

Post Archives by Category

Australian Public Broadcaster ABC unable to look at oil statistics

Australian Public Broadcaster ABC unable to look at oil statistics

Four times in as many months did ABC publish inaccurate statements about US shale oil. A glut of mis-information. This is unacceptable because it leads to wrong policy decisions and has ultimately damaging economic and financial consequences.

(1) “US shale producers pump like never before”
Just in time for last year’s X’mas we received these reassuring news:

Peak oil losing credibility as renewables shift accelerates
24/12/2015
“US shale producers are pumping like never before and adding to stockpiles”
http://www.abc.net.au/news/2015-12-24/peak-oil-losing-credibility-as-shift-to-renewables-accelerates/7052196

(2) “US virtually self-sufficient in oil”

This was broadcast on the 7 pm news (ABC channel 1)
16/1/2016
“The United States is now virtually self-sufficient in oil, while Saudi Arabia, the world’s biggest producer, has stepped up production to protect its market share.”
http://www.abc.net.au/news/2016-01-16/benefits-of-falling-oil-prices-not-fully-passed-on-to-motorists/7091862?section=business

(3) “US oil output rises”

Two months later the headline was:

Oil output rises even as US rig count falls to historic lows
18/3/2016
“The US Energy Information Agency said, despite the dramatic decline in rig numbers, production has steadily grown, indicating that drilling has becoming increasingly efficient”
http://www.abc.net.au/news/2016-03-18/oil-output-rises-even-as-us-rig-count-falls/7259566

This ABC article included the following graph

Fig 1: EIA’s annual US oil production

Coming from this post by the EIA:

Hydraulic fracturing accounts for about half of current U.S. crude oil production
15/3/2016
http://www.eia.gov/todayinenergy/detail.cfm?id=25372

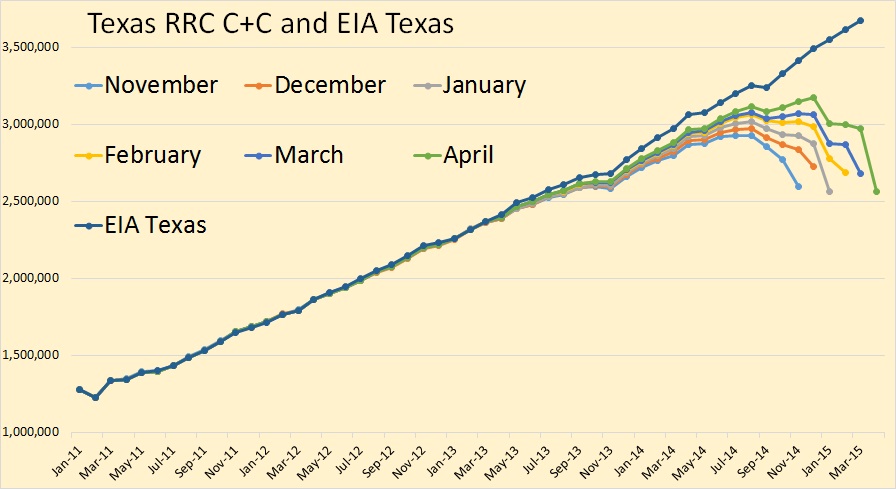
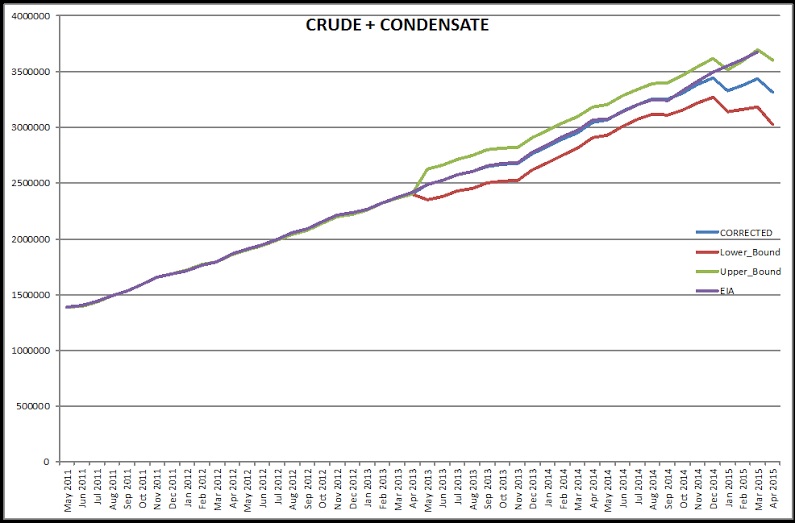
The graph shows that indeed 2015 production is higher than 2014 but the ABC author failed to look at monthly statistics where a turning point was already visible.

(4) “New shale oil technology the end of OPEC”

In the most recent article “Saudi Arabia to sell part of Aramco as part of shift from oil” we find this para:

New shale oil technology ‘the end of OPEC’
26/4/2016
“With US shale oil producers pumping more than ever before and Iran production coming back on line with US sanctions lifted, the planned Saudi reforms underscore the damage from falling revenues.”
http://www.abc.net.au/news/2016-04-26/saudi-arabia-to-sell-part-of-aramco-as-part-of-shift-from-oil/7360388?section=business

…click on the above link to read the rest of the article…

Oil Production Vital Statistics March 2016

Oil Production Vital Statistics March 2016

Since the possible double bottom at $26 formed on February 11th the oil price has staged a rally to $40 (WTI). Traders lucky enough to buy at $26 and sell at $40 have pocketed a tidy 54% profit. Very few will have been this lucky. The trade was stimulated by news that Saudi Arabia and Russia had agreed to not increase production this year which is hollow news since neither country could significantly increase production no matter how hard they tried. Profit taking has now driven WTI back towards $37 as of 1 April.

What next? There is precious little sign of significant production falls anywhere. US and international rig counts continue to plunge. And there is little sign of global demand recovering as OECD economies buckle under the weight of misguided energy policy and debt. There is a risk of the plunge in oil price resuming.

The following totals compare Feb 2016 with Jan 2016:

  • World Total Liquids down 180,000 bpd
  • USA down 60,000 bpd
  • North America down 100,000 bpd (includes USA)
  • OPEC up 100,000 bpd
  • Saudi Arabia up 20,000 bpd
  • Iran up 220,000 bpd
  • Russia + FSU down 10,000 bpd
  • Europe up 220,000 bpd (YOY)
  • Asia up 60,000 bpd

This article first appeared on Energy Matters.

EIA oil price and Baker Hughes rig count charts are updated to the end of March 2016, the remaining oil production charts are updated to February 2015 using the IEA OMR data.

Figure 1 WTI tested the $26.68 low set on Jan 20 by returning to $26.19 on Feb 11. Since then a rally to $40 has been staged and the price has moved above the near term downwards trend line. Charts have limited value in prediction and must be used in conjunction with fundamentals. For now I don’t believe this chart is providing clear direction. Fundamentals remain chronically weak and the next chart points to an on-going plunge in price. But only time will tell.

…click on the above link to read the rest of the article…

Advantage U.S. In The Global Petroleum Showdown?

Advantage U.S. In The Global Petroleum Showdown?

Is the crude stock data in the EIA’s Weekly Petroleum Status Report (Table 1 in the report) a useful tool for judging the prospects for the U.S. petroleum industry— and therefore for the global petroleum industry—or is it misleading?

With few interruptions, U.S. crude stocks increased steadily during 2015 and have continued this trend in 2016. According to weekly EIA data, average commercial crude stocks levels were 7.82 percent higher on average in March than on average in January 2016, and 13.16 percent higher than in 2015 in the week ending January 2, 2015:

With the Weekly Petroleum Status Report’s publication each Wednesday, these steady increases reinforce skepticism on the potential for balanced crude supply and demand and therefore for higher crude prices domestically and internationally. Last week, when the EIA on March 23 reported a 9.3 million barrel build in U.S. commercial crude stocks—around the same time several Federal Reserve officials were suggesting a faster pace for interest rate hikes—WTI and Brent prices fell and continued to fall in the following days.

This week, after the EIA on March 30 reported a smaller build (2.3 million barrels), prices fluctuated, both up and down, despite encouraging words from Fed Chair Yellen on the pace of interest rate hikes in a speech the previous day (of course, other factors, such as OPEC member pronouncements on output policy, influence prices).

Sources of Increasing Crude Stocks

The impetus for gains in crude stocks through March 2016 comes from imports (capacity utilization increased to 88.88 percent from 88.33 percent in the corresponding 2015 period). Average daily crude imports have surged, increasing over 10 percent in January and February compared to 2015’s average daily imports in those months, and 8.63 percent cumulatively year-to-date through March 25:

…click on the above link to read the rest of the article…

Oil Price And Its Effect On Production

Oil Price And Its Effect On Production

Also, JODI, for some reason, does not count all of Canada’s oil sands production. So for Canada I use Canada’s National Energy Board numbers instead.

The JODI C+C numbers, for Non-OPEC, will average about 2.4 million barrels per day less than the EIA. This is largely due to some countries not reporting to JODI. But these countries only have small changes in their overall production so would have little effect on any of my charts or calculations.

JODI World C+C

According to JODI, world crude oil production peaked, so far, in July and has declined by 339,000 barrels per day.

JODI Non-OPEC

The recent price collapse has had a greater effect on Non-OPEC production than OPEC production. Non-OPEC production peaked, so far, in December 2014 and in December 2015 stood at 650,000 bpd below that peak.

JODI Russia

No discussion of Non-OPEC production would be complete without Russia, Non-OPEC’s largest producer. I would never claim, just by looking at the chart, that Russia is peaking, or has peaked. But there have been reports coming out of Russia for over two years now that Russia is peaking. Some of those reports like this one Global and Russian Energy Outlook to 2040 have been reported on this blog. I think the charts lend strong credence to those reports.

…click on the above link to read the rest of the article…

Is The EIA Too Optimistic On U.S. Oil Output?

Is The EIA Too Optimistic On U.S. Oil Output?

After following the weekly production statistics avidly for some months and initially being smugly pleased by the data saying exactly what I wanted to hear, I then became completely befuddled by the data saying the opposite. I had almost reached the conclusion that the weekly production data wasn’t worth paying attention to.

I apologise to the EIA for saying that, it is a Herculean task to capture production data across the United States of America on a weekly basis and even that fleeting thought did them a disservice. But I have poked and prodded the data and I think lurking within it, like a chicken’s entrails on the altar, are the signs of what will happen in the year to come. So I have created a forecast of US production in 2016 and a forecast of how the 2015 data will eventually be revised (which is why I have titled this article a 2015 to 2017 production forecast).

This is the chart that first pleased and then befuddled me. It had pleased me to see the rapid drop off in US production, which sat well with my expectations of very high decline rates from shale oil wells, it befuddled me to see US production climb week after week, as companies cut back on investment and stacked rigs.

What I am showing in the chart above are three sets of data from the EIA, the dark blue line is made up from the weekly production estimates; the deep green is the monthly production data and the pale green is the monthly forecast production from the Short Term Energy Outlook. There is an important difference between the weekly estimates and the monthly figures. The latter get revised, the former don’t.

…click on the above link to read the rest of the article…

Oil Companies Running Out Of Options

Oil Companies Running Out Of Options

The financial pressure on indebted oil and gas companies continues to mount, putting them in a bind as they try to mend their deteriorating balance sheets.

As their debt rises, drillers have had to divert more of their operating cash flow to servicing that debt. Or, put another way, as cash flow declines, a greater share of those resources are swallowed up by debt payments.

According to an analysis by the EIA, a group of 44 onshore oil and gas operators, responsible for 2.7 million barrels of oil production, are increasingly struggling to deal with falling oil prices. Between July 2014 and June 2015, an estimated 83 percent of the operating cash flow from these companies is dedicated for debt payments.

As the oil bust got underway late last year and in early 2015, oil companies had options. They could cut spending, take on new debt, issue new shares, or sell assets, to name a few.

Related: Does OPEC Have An Ace Up Its Sleeve?

In the first half of this year, the U.S. shale industry raised an estimated $44 billion in fresh debt and equity. Companies could roll over or refinance debt, taking on new loans in order to retire old ones. In a low-interest rate environment, lenders were very willing to do this. More importantly, in the first and second quarter of 2015, many lenders expected oil prices to rebound.

That optimism about oil prices has all but vanished at this point. As a result, it is becoming increasingly difficult for indebted companies to secure fresh loans – interest rates for high-risk companies are becoming prohibitively expensive. According to the EIA, the bond yields for energy companies with a credit rating in junk territory have shot above 11 percent, as the bond markets start to steer clear of high-yield energy debt. Debt and equity markets are all but shut off for distressed companies.


…click on the above link to read the rest of the article…

EIA Data Still Doesn’t Add Up

EIA Data Still Doesn’t Add Up

As initially pointed out by Peakoilbarrel.com in a recent article, discrepancies between actual data for oil production in Texas vs. what the EIA claims are so stark it’s almost scary. How this can be overlooked by the mainstream media as well as by most of the broker community is even more alarming. Further, how the U.S. oil industry fails to catch it and question it given that their livelihood is tied to it is even scarier.

Using the data plotted on the Texas RRC website, combined with the knowledge that Bakken production has been flat to declining, makes us wonder how in the world the EIA can not only restate monthly production higher recently, starting in March, but expect over a 700,000 barrels per day (B/D) overall increase for 2015.

Using the EIAs own data off their website on page 7 of their June monthly report, in Texas they expect a 2015 increase of 400,000 B/D (3592 vs. 3164 in table below) alone. Historical data through May shows production essentially flat from March to May (3609 vs. 3675) as well as in 1Q15 to 2Q15 (3602 vs. 3614).

Related: Could Armenia Be The Next Ukraine?

TexasRRCFigures

(Click Image To Enlarge)

Comparing these figures with Texas RRC figures off their website, the differences are startling. First, the chart below clearly shows the trend through 4/1/15 as being flat to down, as production nosedived in April by nearly 15 percent, compared with the previous month, and 15 percent from end of 2014.

Yes, these numbers bounce around but, plotting the monthly data below, the trend is clearly down, not up. So the first question is: what prompted the EIA to boost expectations recently, starting in March, when the data is clearly flat in the largest region of EIA growth expectations?

…click on the above link to read the rest of the article…


U.S. Oil Glut An EIA Invention?

U.S. Oil Glut An EIA Invention?

In the latest weekly production data from the EIA, on the back of recent March revisions, the U.S. managed to post a 76,000 barrel per day increase in the lower 48. Production from Alaska fell by 61,000 barrels per day, putting overall U.S. output 15,000 barrels per day higher for the week ending June 12 compared to the previous week.

This comes at a time when multimillion barrel draws have become the norm. It is important to note that lower 48 production is estimated based on an EIA black box model, while Alaska is virtually real time data. That suggests that the weekly supply estimates are hugely overestimated.

These weekly supply numbers are then used as a basis to jump to the conclusion that the markets are suffering from too much supply. As stated on OilPrice.com many times before, the amount of “over supply” vs. the averages in the U.S. according to the EIA amounts to tens of millions of barrels of oil.

I continue to maintain that the EIA revision to production came very suspiciously at exactly the same time inventory draws began, as did the “Miscellaneous to Balance” figure used in calculating inventory. The chart below clearly shows when this figure started to grow and by what amount. It totals more than 30 million barrels since April and has been rising, which is virtually all of the oversupply above the mean in the U.S! To reiterate that number is at discretion of the EIA and is not an actual data point but an “adjustment.”

Related: The Growing Sino-Latin Energy Relationship

Data Errors Have Real World Consequences

This figure, as created by the EIA, has (with the media’s help) created the impression of a huge oil glut in the U.S. market. No one, either within the media or the industry, has asked for clarification of this number and it is instead taken as gospel. This is now wreaking havoc in energy states such as Texas, as well as threatening most oil companies as well as tens of thousands employed within the oil and gas industry. With such importance placed on a number which has impacted not only billions of dollars in company revenue but many lives for the worse, how can it be largely unchallenged by all but a few in the media?


…click on the above link to read the rest of the article…

New International Energy Statistics.

New International Energy Statistics.

World

World C+C dropped 477,000 bpd in January and another 65,000 bpd in February for a total decline of 542,000 bpd. World C+C stood at 79,160,000 barrels per day in February.

Non-OPEC

Non OPEC C+C declined 244,000 bpd in January and another 100,000 bpd in February for a total decline of 344,000 since December. Non-OPEC C+C production stood at 46,656,000 bpd in February.

OPEC C+C

OPEC C+C, in February 2015 stood at 32,504,000 bpd, down 1,451,000 bpd from its peak in April 2012. However according to the OPEC MOMR their crude only is up 1,000,000 bpd from February to May.


Why A U.S Shale Slowdown Will Hardly Effect Oil Prices

Why A U.S Shale Slowdown Will Hardly Effect Oil Prices

Just last week I wrote on the possibility of a renewed downturn in oil prices, owing to the fact that huge volumes of supplies could potentially come online in places like Iraq, Libya, and Iran. That is still the case.

But let’s look at the other side of the coin. Despite the surprising resilience of U.S. shale, production could be now entering an extended period of decline. The EIApredicts that output in the major shale regions could decline by 91,000 barrels per day in July.

An ongoing and deeper contraction is likely. The EIA also reports a dramatic decline in well completions since October of last year. When prices starting falling, especially after the November 2014 OPEC meeting, rig counts started vanishing from the field and drilling companies began completing fewer wells.

(Click to enlarge)

That is important because shale wells suffer from rapid decline rates in their production profiles. After about the first year, the initial burst of oil largely peters out, and the decline rate is precipitous. As a result, a large number of fresh wells need to constantly be completed just to keep output flat.

Related: Global Oil Production Substantially Lower Than Believed

With the number of well completions down, falling production from wells that were drilled in the past start to become more obvious. This “legacy decline” is now overtaking new production, most likely forcing overall net production to have dipped into negative territory in May.

(Click to enlarge)

The volume of legacy declines will only increase as it will increasingly reflect the huge volume of production that came online in 2013 and 2014. All of that recent production won’t be replaced as drillers sit on the sidelines. That means the decline in total production will only accelerate in the months ahead.


…click on the above link to read the rest of the article…

Texas Oil and Gas Production for April

Texas Oil and Gas Production for April

The preliminary Texas RRC Production Data is out this morning. There appears to be a considerable drop in Texas crude oil production in April. All Texas RRC data in the charts below is through April 2015 and all EIA data is through March 2015.

For those new to this site, the Texas RRC data is incomplete. The drooping lines will eventually, after the final data comes in, closer resemble the EIA data. Though I believe the EIA data is quite a bit too high at this point.

Texas C+C

It appears that, when the final data comes in that Texas will have took a huge hit in January, recovered somewhat in February and March, then took another hit this past April.

Dean C+C

Dr. Dean Fantazzini, with his algorithm that calculates the final production numbers, also comes to the conclusion that Texas took a hit in April production. Dean has three results with the most probable in the middle.


…click on the above link to read the rest of the article…

U.S. Oil Glut Story Grossly Exaggerated

U.S. Oil Glut Story Grossly Exaggerated

It’s called the “age of propaganda” where truth matters little and comes out later in so called revisions. Take the recent spate of economic data points from the Kansas City Fed which said that economic activity not only stalled but wasnegative at -4 vs expectations of +1. The recent durable goods statistics also show contraction as well.

Yet we see the services PMI at a 6 month high. How can these divergences be possible? Well for one, some statistics are hard while others are estimated/massaged and others are seasonally adjusted or estimated (only to be revised later). In oil, the same thing appears to be occurring as we speak. The near record pace of oil storage additions in some weeks nearing 8-10 million barrels per day comes at a time when all indicators are that oil production is slowing.

Related: Oil Price Speed Limit Presaging An Age Of Austerity?

Even using the EIA’s own data, production is up some 500,000 per day since October or 3.5M per week. So how can more than two times that be added to storage while gasoline demand accelerates to 5% year over year from low single digits? Refinery maintenance is part of it, yes, as well as seasonality as people drive less in absolute terms, so as production continues this would explain storage adds, but to this magnitude?


…click on the above link to read the rest of the article…

Olduvai IV: Courage
Click on image to read excerpts

Olduvai II: Exodus
Click on image to purchase

Click on image to purchase @ FriesenPress