Home » Posts tagged 'bakken' (Page 2)

Tag Archives: bakken

Olduvai
Click on image to purchase

Olduvai III: Catacylsm
Click on image to purchase

Post categories

Post Archives by Category

Bakken Production Down plus IEA Predictions

Bakken Production Down plus IEA Predictions

The Bakken and North Dakota production data is in.

ND & Bakken

Bakken production was down 19,502 bpd in August while all North Dakota was down 20,552 bpd.


ND & Bakkwn Amplified

Here is an amplified chart of Bakken and all North Dakota production.

ND & Bakken BPW

Bakken barrels per well per day is now 112 while all North Dakota gets 94 barrels per well per day.

North Dakota Change in BPD

This chart shows the monthly change in North Dakota production. It is likely that by next month the 12 month average change in production will be negative.

Bakken wells producing increased by 69 and ND wells producing increased by 65.

From the Director’s Cut

July Permitting: 233 drilling and 0 seismic
Aug Permitting: 153 drilling and 1 seismic
Sep Permitting: 154 drilling and 1 seismic

July Sweet Crude Price1 = $39.41/barrel
Aug Sweet Crude Price = $29.52/barrel
Sep Sweet Crude Price = $31.17/barrel
Today’s Sweet Crude Price = $35.00/barrel
(low-point since Bakken play began was $22.00 in Dec 2008)
(all-time high was $136.29 7/3/2008)

July rig count 73
Aug rig count 74
Sep rig count 71
Today’s rig count is 67
(in November 2009 it was 63)(all-time high was 218 on 5/29/2012)

Comments: The drilling rig count increased 1 from July to August, decreased 3 from August to September, and dropped 4 more this month. Operators are now committed to running fewer rigs than their planned 2015 minimum as drill times and efficiencies continue to improve and oil prices continue to fall. This has resulted in a current active drilling rig count of 10 to 15 rigs below what operators indicated would be their 2015 average if oil price remained below $65/barrel. The number of well completions fell from 119(final) in July to 115(preliminary) in August. Oil price weakness now anticipated to last well into next year is the main reason for the continued slow-down. There was one significant precipitation event in the Minot area, 6 days with wind speeds in excess of 35 mph (too high for completion work), and no days with temperatures below -10F.

…click on the above link to read the rest of the article…

U.S. tight oil production decline

U.S. tight oil production decline


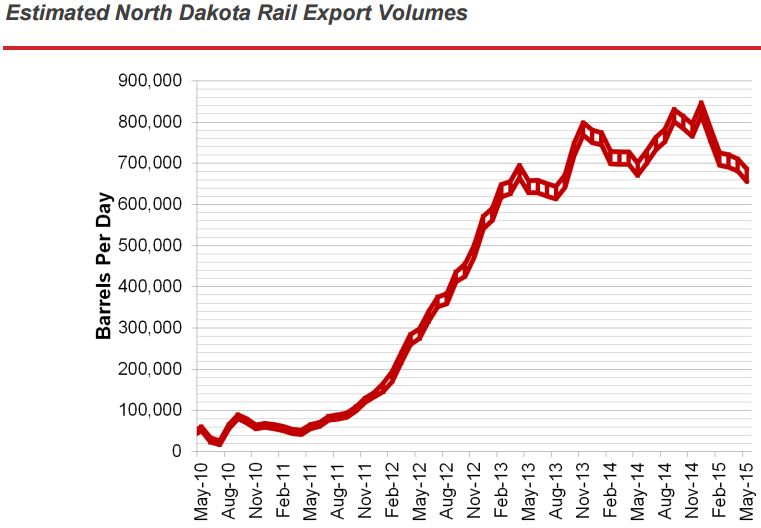
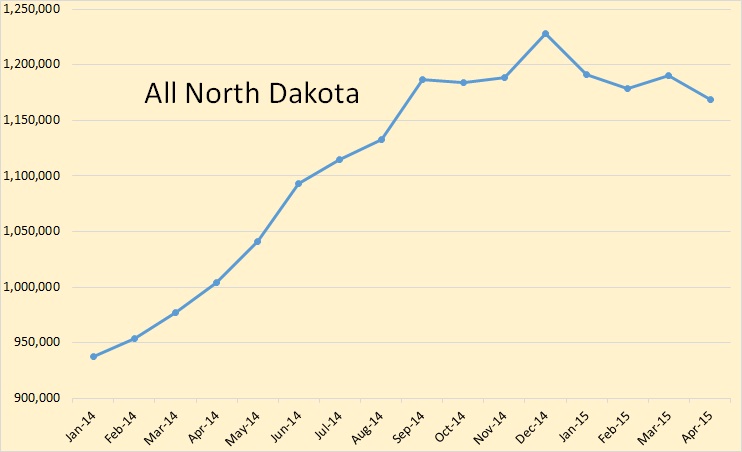
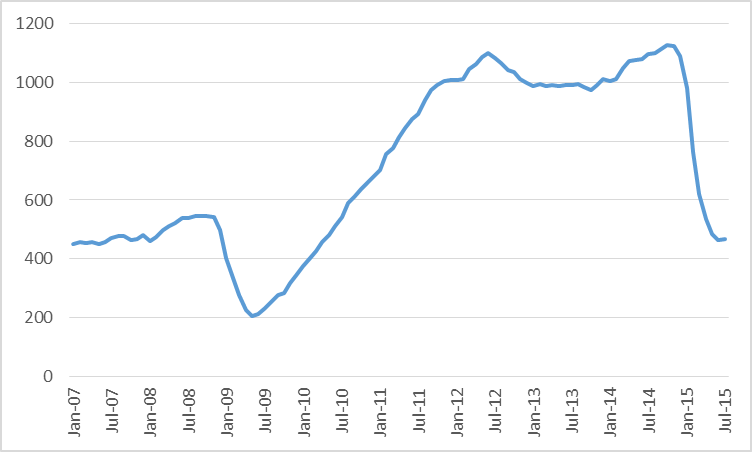
Oil companies have cut back spending significantly in response to the fall in the price of oil. The number of rigs that are active in the main U.S. tight oil producing regions– the Permian and Eagle Ford in Texas, Bakken in North Dakota and Montana, and Niobrara in Wyoming and Colorado– is down 58% over the last 12 months.

Number of active oil rigs in counties associated with the Permian, Eagle Ford, Bakken, and Niobrara plays, monthly Jan 2007 to July 2015. Data source: EIA Drilling Productivity Report.

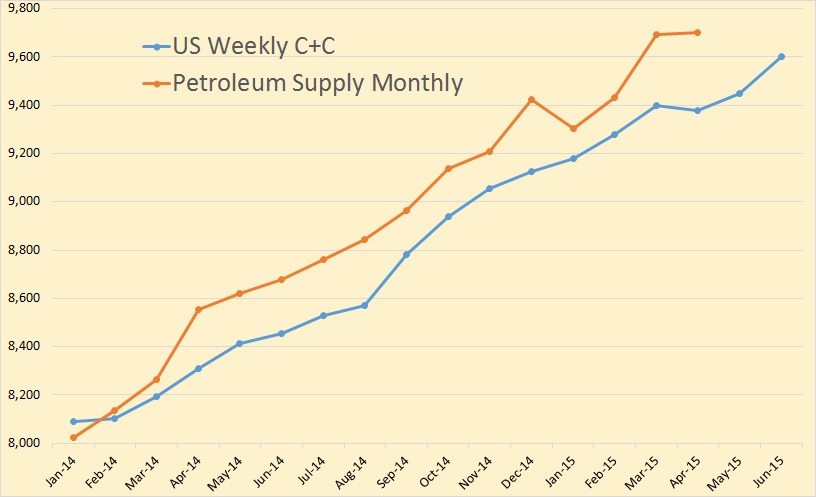
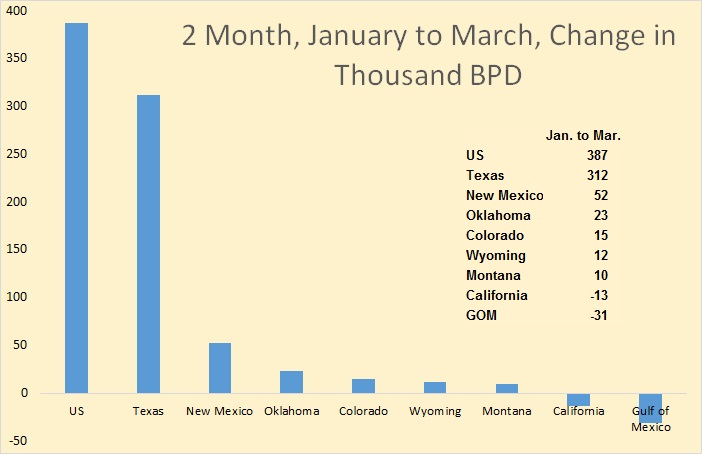
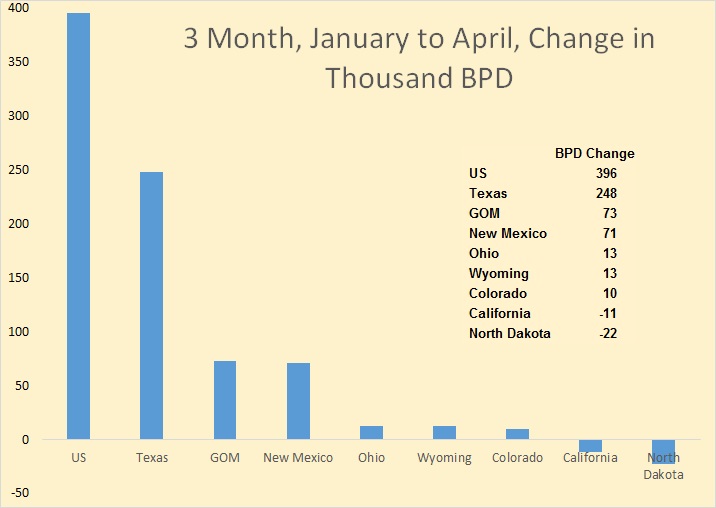
Nevertheless, U.S. tight oil production continued to climb through April. It has fallen since, but the EIA estimates that September production will only be down 7%, or about 360,000 barrels/day, from the peak in April.

Actual or expected average daily production (in million barrels per day) from counties associated with the Permian, Eagle Ford, Bakken, and Niobrara plays, monthly Jan 2007 to September 2015. Data source: EIA Drilling Productivity Report.

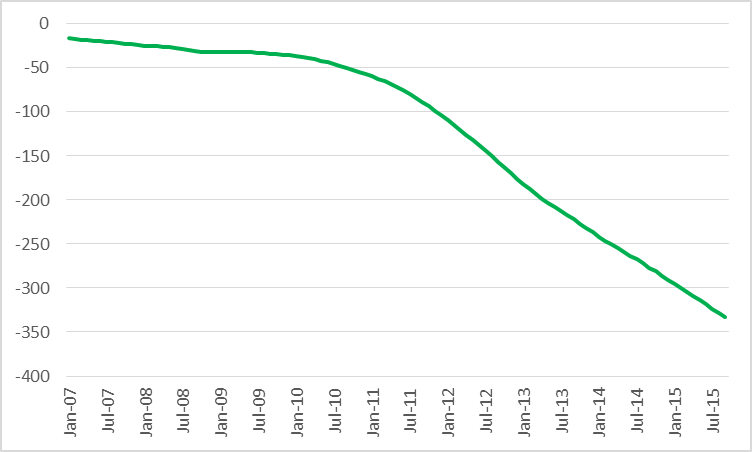
This is despite the fact that typically output from an existing well falls very quickly after it begins production. The EIA estimates that tight oil production from wells that have been in operation for 3 months or more has declined by 1.6 mb/d since April, as calculated by the sum of the EIA estimated monthly declines in legacy production from May to September.

Legacy production change (month-to-month production change, in thousands of barrels per day, coming from wells in operation 3 months or more) in counties associated with the Permian, Eagle Ford, Bakken, and Niobrara plays, Jan 2007 to Sept 2015. Data source: EIA Drilling Productivity Report.

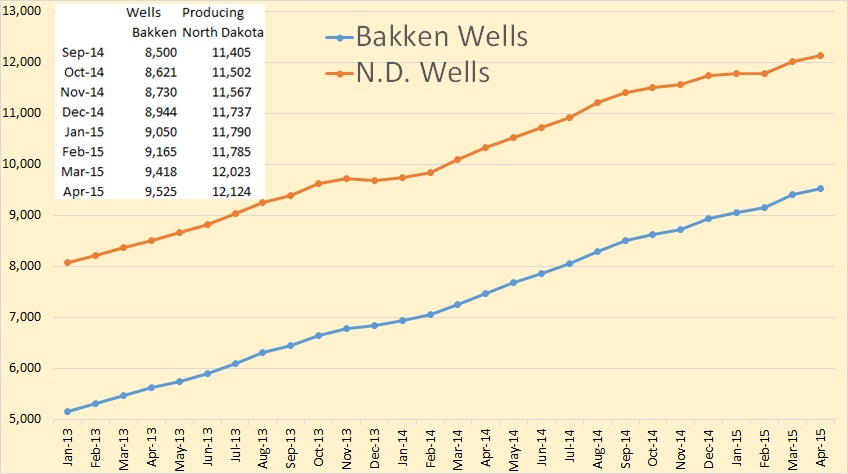
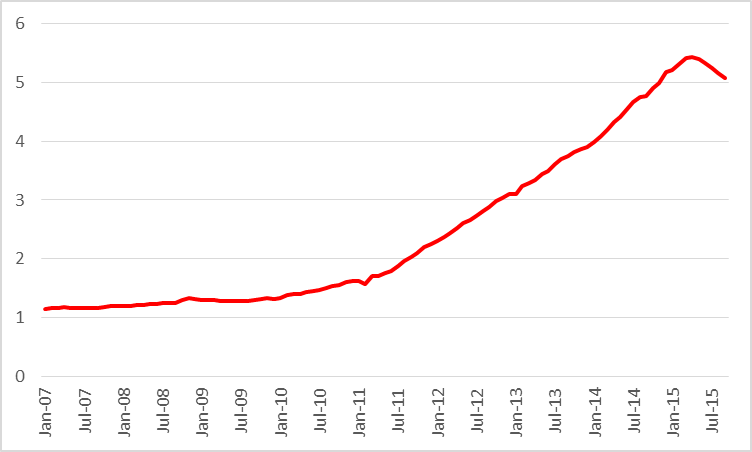
One would think that these decline rates from existing wells and the drop in the number of rigs drilling new wells would mean that production would have fallen much more dramatically. Why didn’t it? The answer is that there has been a phenomenal increase in productivity per rig. For example, the EIA estimates that operating a rig for a month in the Bakken would have led to a gross production increase of 388 barrels/day two years ago but can add 692 barrels today.

…click on the above link to read the rest of the article…


A Reality Check For U.S. Natural Gas Ambitions

A Reality Check For U.S. Natural Gas Ambitions

Something unusual happened while we were focused on the global oil-price collapse–the increase in U.S. shale gas production stalled (Figure 1).

Figure 1. U.S. shale gas production. Source: EIA and Labyrinth Consulting Services, Inc.

(click image to enlarge)

Total shale gas production for June was basically flat compared with May–down 900 mcf/d or -0.1% (Table 1).

Table 1. Shale gas production change table. Source: EIA and Labyrinth Consulting Services, Inc.

(click image to enlarge)

Marcellus and Utica production increased very slightly over May, 1.1 and 1.5 mmcf/d, respectively. The Woodford was up 400 mcf/d and “other” shale increased 300 mcf/d. Production in the few plays that increased totaled 3.3 mmcf/d or one fair gas well’s daily production.

Related: The Broken Payment Model That Costs The Oil Industry Millions

The rest of the shale gas plays declined. The earliest big shale gas plays–the Barnett, Fayetteville and Haynesville–were down 25%, 14% and 48% from their respective peak production levels for a total decline of -4.8 bcf/d since January 2012.

The fact that Eagle Ford and Bakken gas production declined suggests tight oil production may finally be declining as well.

To make matters worse, total U.S. dry natural gas production declined -144 mmcf/d in June compared to May, and -1.2 bcf/d compared to April (Figure 2). Marketed gas declined -117 mmcf/d compared to May and -1 bcf/d compared to April.

Figure 2. U.S. natural gas production. Source: EIA and Labyrinth Consulting Services, Inc.

(click image to enlarge)

Although year-over-year gas production has increased, the rate of growth has decreased systematically from 13% in December 2014 to 5% in June 2015 (Figure 3).

Figure 3. U.S. dry gas year-over-year production change. Source: EIA and Labyrinth Consulting Services, Inc.

(click image to enlarge)

This all comes at a time when the U.S. is using more natural gas for electric power generation. In April 2015, natural gas used to produce electricity (32% of total) exceeded coal (30% of total) for the first time (Figure 4).


…click on the above link to read the rest of the article…

Oil Shipments by Rail Declining

Oil Shipments by Rail Declining

Weekly oil shipments by rail can be found on the web at Weekly Carload Reports. And a summation of that data with charts can be found at Association of American Railroads  Freight Rail Traffic Data.

Rail Oil Carloads 3

Crude oil by rail basically started with the shale boom. Prior to that almost all oil was shipped by pipeline. Of course a lot of oil was trucked to the pipelines. The EIA says in the first seven months of 2014 8 percent of all us crude and refined products was shipped by rail. It looks like that percentage was increased somewhat in the second half of 2014.

Rail Oil Carloads

Oil by rail, for the entire USA, peaked in August, September and October of 2014 and has declined since.

Daily Oil by Rail 2

I have converted the weekly carloads to daily then converted carloads to barrels. There are about 700 barrels per carload. That gives us the average barrels per day by rail.

Daily Oil by Rail

I have converted the weekly “daily average” to monthly “daily average” and plotted it against the North Dakota production. The EIA says: Between 60% and 70% of the more than 1 million barrels per day of oil produced in the state has been transported to refineries by rail each month in the first half of 2014, according to the North Dakota Pipeline Authority.

Rail Oil ND 1

As we can see from this chart the volume of oil shipped by rail changes from month to month. The chart is barrels per day per month. The peak, for North Dakota, is December 2014. Oil by rail for the USA peaked about three months earlier.


…click on the above link to read the rest of the article…

Oil Shock Models with Different Ultimately Recoverable Resources of Crude plus Condensate (3100 Gb to 3700 Gb)

Oil Shock Models with Different Ultimately Recoverable Resources of Crude plus Condensate (3100 Gb to 3700 Gb)

The views expressed are those of Dennis Coyne and do not necessarily reflect the views of Ron Patterson.

blog20150706/

The post that follows relies heavily on the previous work of both Paul Pukite (aka Webhubbletelescope) and Jean Laherrere and I thank them both for sharing their knowledge, any mistakes are my responsibility.

In a previous post I presented a simplified Oil Shock model that closely followed a 2013 estimate of World C+C Ultimately Recoverable Resources (URR) by Jean Laherrere of 2700 Gb, where 2200 Gb was from crude plus condensate less extra heavy oil (C+C-XH) and 500 Gb was from extra heavy (XH) oil resources in the Canadian and Venezuelan oil sands.

In the analysis here I use the Hubbert Linearization (HL) method to estimate World C+C-XH URR to be about 2500 Gb. The creaming curve method preferred by Jean Laherrere suggests the lower URR of 2200 Gb, if we assume only 200 Gb of future reserve growth and oil discovery.

Previously, I have shown that US oil reserve growth (of proved plus probable reserves) was 63% from 1980 to 2005. If we assume all of the 200 Gb of reserves added to the URR=2200 Gb model are from oil discoveries and that in a URR=2500 Gb, oil discoveries are also 200 Gb, then 300 Gb of reserve growth would be needed over all future years (we will use 90 years to 2100) or about 35% reserve growth on the 850 Gb of 2P (proved plus probable) reserves in 2010. I conclude that a URR of 2500 Gb for C+C-XH is quite conservative.

A problem with the Hubbert Linearization method is that there is a tendency to underestimate URR.

…click on the above link to read the rest of the article…


The EIA’s Questionable Numbers

The EIA’s Questionable Numbers

EIA Post 1

I averaged the weekly numbers and converted them to monthly data. They were pretty close for the first three months of 2014 but then they begin to diverge. Of course they were much closer earlier but in the Petroleum Supply Monthly has, over several months, been revised upward. The Weekly Petroleum Status Report is never revised.

In April, the Petroleum Supply Monthly shows US C+C production 322,000 barrels per day above the weekly average of the Weekly Petroleum Status Report.

EIA Post 2

The Petroleum Supply Monthly shows US production increased 387,000 barrels per day in the two months January to March. That is an increase when oil rigs were being stacked by the dozens. They show Texas up 312,000 over those two months and New Mexico up 52,000 bpd. That means they think the Permian, which is mostly in Texas but partly in New Mexico, was really booming during those two months.


EIA Post 3

The EIA has crude production continuing to climb during April, up 396,000 bpd January to April. The Gulf of Mexico, which had been down slightly the previous three months, was shown up 104,000 in April, giving them a gain of 71,000 bpd over the three months.

But obviously Texas is where all the action is.


…click on the above link to read the rest of the article…

Bakken by County

Bakken by County

All charts are in barrels per day and are only for the last 16 months in order to get a better and expanded view of what each county is doing.

North Dakota Expanded

First a sixteen month view of all North Dakota production. North Dakota production, in April, stood at  1,168,636 bpd. That is 17,631 bpd below their production last September, seven months previous. North Dakota production is down 59,385 bpd since the high reached in December.

McKenzie

McKenzie County April production stood at 413,671 bpd, 31,555 bpd below their high in December.

Mountrail

Mountrail County production stood at 255,384 bpd in April, 36,132 bpd below their peak in September.


…click on the above link to read the rest of the article…

Bakken April Production Data

Bakken April Production Data

Bakken Production

Eight month of flat to down production from the Bakken.

Bakken Amplified

I have shortened the data to 16 months here to give a better picture of what is really happening. North Dakota reached an 8 month low. North Dakota, in April, was 17,631 barrels per day below their September 2014 production. The Bakken was only 11,024 below September 2014 so conventional wells seem to be dropping off pretty fast.

The Baken is 54,599 bpd below their peak in December and all North Dakota is 59,385 bpd below their December Peak.

As usual there was very little adjustments in the previous months data. Bakken March production was adjusted down by 114 barrels per day while North Dakota production was adjusted down by 81 barrels per day.

Bakken BPD Per Well

Bakken BPD per well has been dropping for four months now. Bakken bpd per well now stands at 116, down 4 from March. All North Dakota bpd per well is now 96, down 3 while conventional wells bpd per well is 23, down 1 from March.

Bakken Wells Producing

Bakken wells producing increased by 107 while North Dakota wells producing increased by 101.

The North Dakota rig count now stands at 75, down 7 since Wednesday.

…click on the above link to read the rest of the article…


Busting The “Canadian Bakken” Myth

Busting The “Canadian Bakken” Myth

The financial pages of Canadian newspapers have been full of headlines lately announcing the potential of two large shale oil fields in the Northwest Territories said to contain enough oil to rival the Bakken Formation of North Dakota and Montana.

The report by Canada’s National Energy Board (NEB) evaluated, for the first time, the volume of oil in place for the Canol and Bluefish shale formations, located in the territory’s Mackenzie Plain. It found the “thick and geographically extensive” Canol formation is expected to contain 145 billion barrels of oil, while the “much thinner” Bluefish shale contains 46 billion barrels.

Related: More OPEC Oil Coming When Iranian Sanctions Removed

The report did not estimate the amount of recoverable oil, but points out that even if one percent of the Canol resource could be recovered, that represents 1.45 billion barrels. The calculation immediately had reporters comparing Canol and Bluefish to the Bakken, where the latest USGS estimate shows 7.4 billion barrels of technically recoverable oil (this includes the Three Forks Formation underlying the Williston Basin straddling North Dakota, Montana, Saskatchewan and Manitoba).

“Northwest Territories sitting on massive shale oil reserves on par with booming Bakken field in U.S.,” enthused the Financial Post. “NEB and GNWT study finds 200 billion barrels of oil in the Sahtu,” gushed CBC News, referring to a region of the sprawling territory that cuts across three provinces and touches the Arctic Ocean.

…click on the above link to read the rest of the article…

The Bakken ”Red Queen” is restrained with more credit

The Bakken ”Red Queen” is restrained with more credit

This post is an update on Light Tight Oil (LTO) extraction in Bakken based upon published data from the North Dakota Industrial Commission (NDIC) as per March 2015.

Extraction developments of LTO from Bakken may be followed by county, formation, vintage of wells, and one important source to understand the developments are coming from studying the developments by companies. Holding this up with companies’ financial statements (10-K and 10-Q) is an invaluable source about the companies, their financial capabilities and their strategies. This information is paramount to understand the developments in LTO extraction from Bakken and provides valuable insights into what to expect of future developments.

To get some understanding of what will drive future developments, it is helpful to look at individual companies.

Amongst all the companies operating in Bakken I selected for this post to present a closer look at 3 of the biggest companies in Bakken; Continental Resources, EOG Resources and Whiting Petroleum.

These 3 companies were found to be representative for several of the companies with regard to a range of variation in quality of wells, development strategies, use of debt, asset sales and not least what their responses to oil price changes may reveal.

  1. For Q1 – 15 the companies involved in LTO extraction in Bakken used an estimated $4 Billion(CAPEX) for well manufacturing and an estimated $2.3 Billion was from external sources, primarily from equity and asset sales and assuming more debt.
    The “average” well with around 90 kb [90,000 barrels] of flow in its first year is estimated to have an undiscounted point forward break even (that is a nominal break even with 0% return for the well)at around $60/Bbl (WTI).
  2. The break even price increases with increases in the return requirement.
  3. This analysis shows that the companies have deployed different strategies as responses to the decline in the oil price, which will affect future developments in LTO extraction.


…click on the above link to read the rest of the article…

New Oil-By-Rail Regulations Are Big Win for Oil and Rail Industries, Won’t Stop “Bomb Trains”

New Oil-By-Rail Regulations Are Big Win for Oil and Rail Industries, Won’t Stop “Bomb Trains”

The long-awaited oil-by-rail regulations released today are basically a guidebook for the oil and rail industries to continue doing business as usual when it comes to moving explosive Bakken crude oil by rail.

DeSmog recently reported on how the Obama administration has worked behind the scenes to help achieve the oil industry’s top goal when it came to these new regulations — allowing the oil producers to continue to put the highly volatile Bakken crude oil into rail tank cars without removing the natural gas liquids that make it such an explosive mixture.

As we’ve reported, there is a relatively simple fix to end, or significantly reduce, the “bomb train” disasters, via a process known as stabilization.

But the new regulations not only give the industry a pass on doing this, they add to the “we need more research before we do anything” approach that is the preferred tactic the industry and regulators are using to delay addressing the issue.

On page 232 of the new regulations, they state the following:

Any specific regulatory changes related to treatment of crude oil would consider further research and be handled in a separate action.

If you are a Bakken oil producer, that one sentence out of the close to 400 pages of new regulations is all you need to know. Time to start writing thank you notes to your lobbyists.

As Al Jazeera recently reported, quoting a professor of petroleum engineering at the University of Houston who was commenting on the science of Bakken crude:

The notion that this requires significant research and development is a bunch of BS.”

A similar sentiment was expressed in an editorial published by RailwayAge earlier this week responding to the Department of Energy announcement that it will study the issue of Bakken oil volatility


…click on the above link to read the rest of the article…

Global Shale Revolution On Hold

Global Shale Revolution On Hold

Along with the rest of the energy world, we have been closely tracking rig counts (now down 40 percent from last fall) and other data to try to determine where the oil markets are heading. This week, the Energy Information Administration reported that production is finally set to decline in several key U.S. shale regions; a long-awaited development. The Eagle Ford, Bakken, and Niobrara shales are expected to see a combined 24,023 barrel-per-day decline in production in April, the first significant dip in output since oil prices collapsed last year. The monthly data may be a bit obscured by the fact that the Permian basin is expected to see production increases of 21,254 barrels per day. Overall, total U.S. production may stay flat. There is still a great deal of uncertainty about the next few months, but with declines beginning in the Eagle Ford and Bakken especially – two critical regions that drove the U.S. shale revolution – there appears to be light at the end of the tunnel for the oil glut.

The Federal Reserve caused a bit of a ripple in the oil markets this week when it appeared to slightly slow plans to raise interest rates later this year. The Fedlowered its estimate for the federal funds rate this year and next, an indication that it will not let its foot off of the gas pedal in terms of loose money. With low inflation and still room for labor markets to heal, the Fed sees no reason to pull back too quickly. Loose monetary conditions push up oil prices, so WTI and Brent rallied a bit this week on the news (after falling significantly). WTI closed out the week around $45 and Brent at $55 per barrel.


…click on the above link to read the rest of the article…

Deciphering The Latest Rig Count Data

Deciphering The Latest Rig Count Data

The main take-away from this week’s rig count is that everything is on track for lower U.S. oil production by mid-year. The weekly changes vary but the overall trend since October is down and that is positive for achieving a better balance between supply and demand.

Please remember the following points and read my previous post “Oil Prices Don’t Change Because of Rig Count” if you haven’t already:

• Rig count is only one indicator of future production trends. 
• Week-to-week changes are not critical but trends may become important.
• Horizontal rigs are more important than vertical rigs.
• Bakken, Eagle Ford and Permian basin are the most important plays for tight oil production in the U.S.

This week, the overall rig count was down 75 compared with 43 rigs last week. The horizontal rig count was down 51 compared with 33 rigs last week.

The Eagle Ford Shale play lost 9 horizontal rigs this week, the Permian lost 15 and the Bakken lost 3 rigs.

RigCountChangeTable

Rig Count Change Table. Source: Baker-Hughes, Labyrinth Consulting Services, Inc.

(Click to enlarge)

Related: Oil Price Crash A Blessing In Disguise For US Shale

The Bakken horizontal rig count is down 40% from its maximum in 2014. The Permian basin horizontal rig count is down 33% and the Eagle Ford is down 30%.


…click on the above link to read the rest of the article…

OPEC Production Cut May Not Be Needed After All

OPEC Production Cut May Not Be Needed After All

U.S. tight oil production may fall 600,000 barrels per day by June 2015 based on reasonable projections of current rig counts.

I compared the decrease in rig counts that began in late 2014 to the rig count decrease in 2008 and 2009 following the Financial Crisis. I projected current total rig counts according to three scenarios out to June 5, 2015 shown in the chart below. I then applied those decline rates to rig counts and production in the 4 major tight oil plays: the Bakken, D-J Niobrara, Eagle Ford and Permian basin.

RigDecrease0809AndNow

Comparison of rig count decrease in 2008-2009 and 2014-2015. Source: Baker Hughes

In 2008-2009, the U.S. rig count dropped from 2,031 to 876 over a period of 283 days. As of February 13, 2015, the rig count has fallen from 1,931 to 1,358 over a period of 151 days. The current rate of decrease is greater than in 2008-2009. I used the 2008-2009 rig count trend as a general guide for rate of change and duration recognizing that there are differences between the two events. Other than the rate of decrease, the most notable difference is that in 2008-2009, there was more vertical drilling than in 2014-2015 and that rig efficiency was lower in 2008-2009 as a result.


…click on the above link to read the rest of the article…

Are The Bakken’s Sweet Spots Past Their Prime?

Are The Bakken’s Sweet Spots Past Their Prime?

This post is an update on total Light Tight Oil (LTO) extraction from Bakken in North Dakota based upon actual data as of October 2014 from North Dakota Industrial Commission (NDIC). It further presents a statistical analysis on developments of well productivity with a detailed look at developments in Parshall, Reunion Bay and Sanish.

• There were general improvements in LTO well productivity in Bakken during 2013.

• Present trends in LTO well productivity for Mountrail’s sweet spots (Alger, Parshall, Reunion Bay, Sanish and Van Hook) suggests these are past their prime.

• Figure 29 in this post shows development in well productivity for Alger and Van Hook and figures 06, 08 and 10 for Parshall, Reunion Bay and Sanish. A common feature for Parshall, Reunion Bay, Sanish, and Van Hook is that these reached new highs in well productivity for wells started in 2013.
Alger has been in general decline since 2011.

• LTO extraction in recent years may be viewed as a source for global swing production for oil.

BakkenChart1

Figure 01The chart above shows development in Light Tight Oil (LTO) extraction from January 2009 and as of October 2014 in Bakken North Dakota [green area, right hand scale]. The top black line is the price of Western Texas Intermediate (WTI), red middle line the Bakken LTO price (sweet) as published by the Director for NDIC and bottom orange line the spread between WTI and Bakken LTO wellhead all left hand scale.

…click on the above link to read the rest of the article…


Olduvai IV: Courage
Click on image to read excerpts

Olduvai II: Exodus
Click on image to purchase

Click on image to purchase @ FriesenPress