Home » Posts tagged 'zirp'

Tag Archives: zirp

Olduvai
Click on image to purchase

Olduvai III: Catacylsm
Click on image to purchase

Post categories

Post Archives by Category

Fourth Turning 2022–Bad Moon Rising (Part 2)

FOURTH TURNING 2022 – BAD MOON RISING (PART 2)

In Part 1 of this article I laid out how the global elite have used this covid flu to manipulate the weak minded into a fear induced mass psychosis as a key element in their Great Reset plan to control the world and keep you technologically enslaved under lock and key. Now I will try to decipher how this mass hysteria might play out over the course of 2022 and beyond.

“Americans today fear that linearism (alias the American Dream) has run its course. Many would welcome some enlightenment about history’s patterns and rhythms, but today’s intellectual elites offer little that’s useful. Caught between the entropy of the chaoticists and the hubris of the linearists, the American people have lost their moorings.” – Strauss & Howe – The Fourth Turning

Federal Reserve Just Declared the American Dream is Dead for Most Americans

“The most effective way to destroy people is to deny and obliterate their own understanding of their history.” ― George Orwell

The American Dream, where all Americans, no matter the circumstances of their birth, had a legitimate opportunity to live a better life than their parents, based upon their own intelligence, work ethic, and good fortune, is an illusion in today’s world. The ruling elite have stolen the wealth of the nation and its citizens. This was not an accident, but a plan implemented over many decades, accelerating after Nixon closed the gold window and opened the door to unlimited amounts of debt being created out of thin air and backed by nothing.


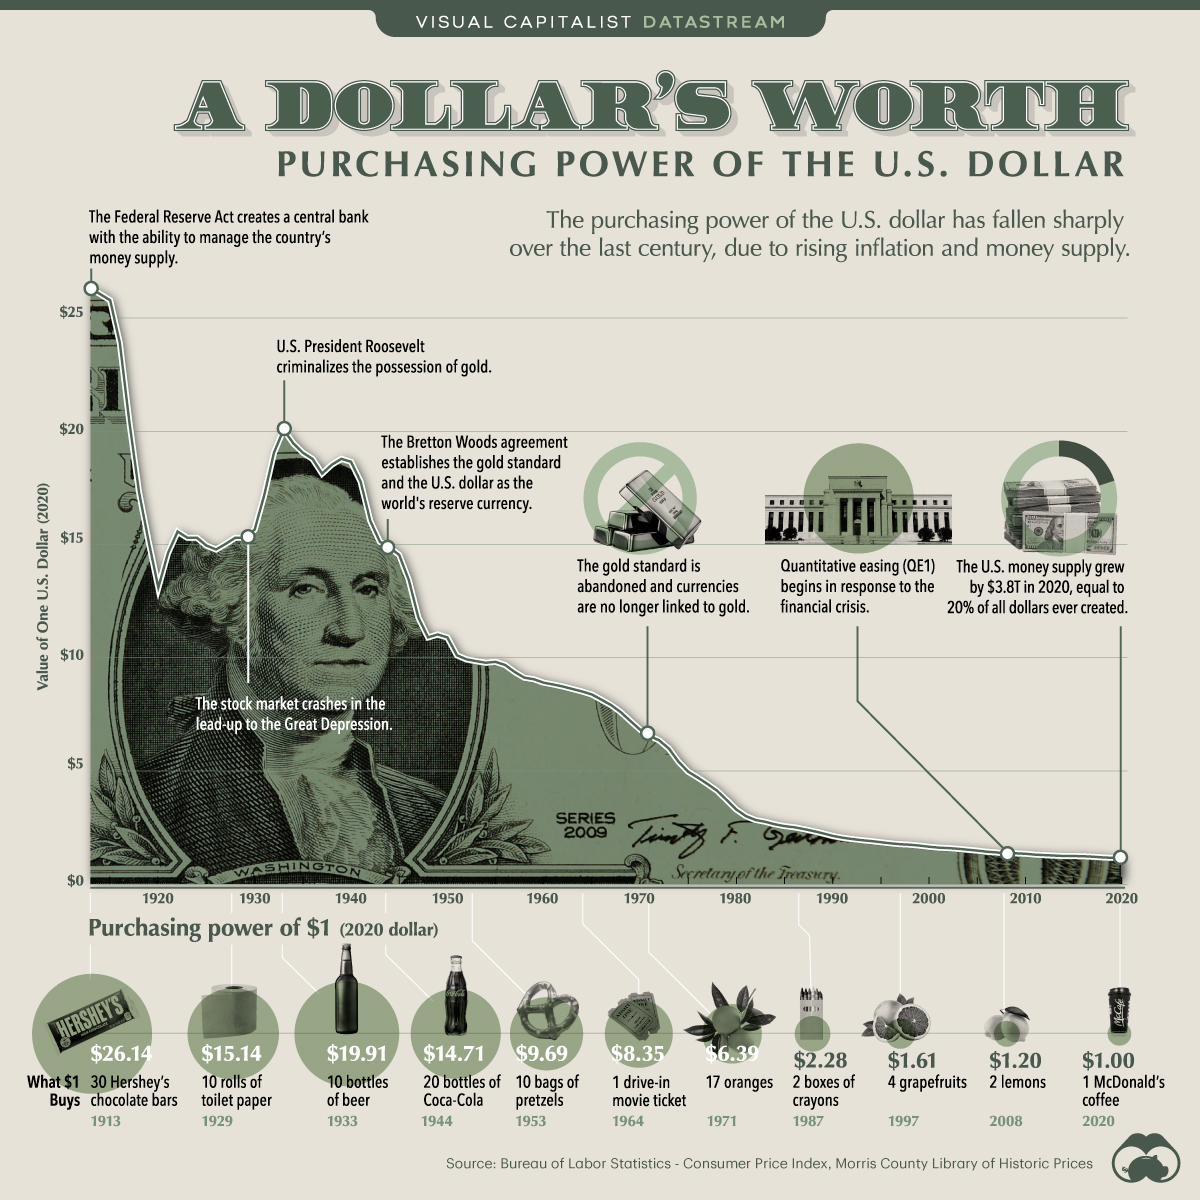
One of the Fed’s only mandates was to maintain a stable currency. Since its inception in 1913 to 2020, the USD had lost 96% of its purchasing power. The USD has lost 7.5% of its purchasing power since 2020, as Powell and his cronies have lost control of inflation.

Visualizing the Purchasing Power of the U.S. Dollar Over Time

…click on the above link to read the rest of the article…

Federal Reserve IR Policy – Longer, Lower, and ZIRP Until Something (or Everything) Breaks

Federal Reserve IR Policy – Longer, Lower, and ZIRP Until Something (or Everything) Breaks

The current interest rate cycle began in August of 2019 when the Fed cut rates from the previous cycle high of 2.4% to 2.1%.  The Fed was then fighting the “repo-crisis” in which the Fed was incapable of setting interest rates…and gasp…free-market based interest rates were the result.  And, shocker, they were not “lower for longer”.  So, just thought I’d offer put interest rate cycles in perspective and detail why I anticipate this will be the longest and lowest interest rate cycle with likely zero recovery of those rate cuts.
To begin, the chart below shows interest rate cycles from 1981 through 2020 (and likely through 2040)…and note they grow progressively longer, starting and ending lower, and with less interest rate recovery.  Based on this pattern and the macro’s driving this, this current cycle is likely to be decades at zero (or more likely moving to NIRP) with no rate hikes.

To gauge the changing dynamics of the interest rate cycles, the chart below details the DEPTH of the cut (the percentage from starting rate to cycle low rate), the DURATION (the number of months from initial rate cut to initial rate cut of the next cycle), and the RECOVERY (how much rates are hiked in the hiking phase from the cycle low rate).  Again, the depth of cuts moves progressively greater (essentially 100% for last two cycles), duration stretching from less than a year to over a decade, and recovery moving from outright rate hikes to less than 50% recovery of previous cuts.  Again, this the current cycle, we already have 100% cuts and I anticipate something on the order of twenty years of zero rates meaning zero recovery.

…click on the above link to read the rest of the article…

Fourth Turning Accelerating Towards Climax

FOURTH TURNING ACCELERATING TOWARDS CLIMAX

“At some point, America’s short-term Crisis psychology will catch up to the long-term post-Unraveling fundamentals. This might result in a Great Devaluation, a severe drop in the market price of most financial and real assets. This devaluation could be a short but horrific panic, a free-falling price in a market with no buyers. Or it could be a series of downward ratchets linked to political events that sequentially knock the supports out from under the residual popular trust in the system. As assets devalue, trust will further disintegrate, which will cause assets to devalue further, and so on. Every slide in asset prices, employment, and production will give every generation cause to grow more alarmed.” – Strauss & Howe – The Fourth Turning

Economists Predict Great Depression II for US Economy: Fast or V ...

I’ve been writing articles about the Fourth Turning for over a decade and nothing has happened since its tumultuous onset in 2008, with the global financial collapse, created by the Federal Reserve and their Wall Street co-conspirator owners, that has not followed along the path described by Strauss and Howe in their 1997 book – The Fourth Turning.

Like molten lava bursting forth from a long dormant (80 years) volcano, the core elements of this Fourth Turning continue to flow along channels of distress, long ago built by bad decisions, corrupt politicians and the greed of bankers. The molten ingredients of this Crisis have been the central drivers since 2008 and this second major eruption is flowing along the same route. The core elements are debt, civic decay, and global disorder, just as Strauss & Howe anticipated over two decades ago.

…click on the above link to read the rest of the article…

Aussie Reserve Bank, Considering “Extreme Measures”, Admits “We’re Almost Out Of Ammo”

Aussie Reserve Bank, Considering “Extreme Measures”, Admits “We’re Almost Out Of Ammo”

At least one reserve bank globally is starting to ponder the question that many central banks across the world will soon inevitably be asking: what happens if we cut to zero and the economy continues to falter?

This has led Australia to start considering QE, following in the footsteps of a world full of central bankers all offering each other as much confirmation bias necessary to continue to walk down the path of eventual economic destruction.

In Australia, the reserve bank has cut to 1% and “nobody expects them to stop cutting,” according to News.com.au. The bank released this chart days ago, showing that market is expecting further cuts. 

The average of all expectations is for the market to fall to 0.37% by September 2020. That exact outcome is described as “unlikely”, but the RBA could have rates at 0.25% or 0.5% by then. That would only leave room for one or two more cuts before rates are at zero.

Then what? Destroy your currency and print your way out of your problems. 

Apparently convinced that economies only exist as permanent booms now, the RBA said last week that it would begin a program similar to QE in the United States, wherein the central bank would buy financial assets in exchange for cash. The RBA is considering buying Australian government bonds.

“We could take action to lower the risk-free rates further out along the term spectrum,” said the RBA Governor.

Justifying this nonsense, the article then gives the quintessential example of how QE bond buying works in practice:

Bonds are how the government borrows. Here’s how it works in simplified terms:

The government offers to sell a piece of paper that says, “Australia will pay you back a million dollars in 10 years” (a 10-year bond).

Someone buys that for, let’s say, $900,000.

 …click on the above link to read the rest of the article…

The Positive Interest Rate Cycle, RIP…1950 – 2019

The Positive Interest Rate Cycle, RIP…1950 – 2019

I’m going to make the case that the US is concluding the final positive interest rate cycle and that upon the next downturn, the Japanese / EU style ZIRP and/or NIRP will become the new norm.  But, before we say goodbye…let’s take a look at the ups, downs, and rationale of the post WWII cycles.

Below, the 11 interest rate cycles since 1954, with each subsequent cycle highlighted in a separate box.  Each cycle was unique but, in sum, they were part of an arc that has run its course.  I’ll detail that the Federal Funds curve actually represents the real annual change in demand.  Organic demand accelerated up to 1981 and organic demand decelerated from ’81 to present but synthetic credit / debt based demand was increasingly substituted.   And, for some strange reason, when the annual core population growth among the consumer nations was at its peak, the Fed (and CB’s) restricted the economy and potential capacity via extremely high rates.  Now at minimal to negative core population change (little to no demand growth), the Fed is attempting to incentivize debt and increase capacity with zero and/or with negative rates?

Below, every US interest rate cycle since WWII, showing cycles from initial rate cut until the initiation of cuts starting a new cycle.  Clearly, the ’89 to ’00 and current “lower for longer” cycles stick out like a sore thumb.

Splitting the cycles into two separate buckets; first looking at the cycles from 1950 through 1980.  During this period, every cycle finished at a higher rate than the cycle began (recouping all cuts plus some).  Cycles were as short as a year all the way up to six years long.

Second, looking at 1980 through 2019; interest rate cuts become deeper, none of the cuts are fully clawed back and rates are progressively lower prior to the next cycle. 

 …click on the above link to read the rest of the article…

The Corporate Debt Bubble

The largest asset bubbles occur while economic growth and inflation remain positive, but subdued, for extended periods of time.  According to its dual mandate, the Federal Reserve focuses primarily on growth and price stability, and tends to ignore the creation of asset bubbles as long as economic activity is not running too hot and inflation is benign.  Historically, the Fed has not considered it a priority to prevent or pop asset bubbles, despite inadvertently enabling their creation through various policy measures.

During the inflation of asset bubbles, it is common for excess liquidity (easy money) to follow the path of least regulation outside of traditional regulated banking systems.  These channels are known as the shadow banking system or shadow lending markets where it is more profitable for both lenders and borrowers to transact due to lower costs and lax oversight.  During the last financial crisis, companies like Countrywide, New Century and even certain money market funds helped fill this role.  Unfortunately, the boom-time “innovations” which emerge around these shadow lending markets are not battle-tested, and often fail spectacularly when inevitably stressed.

Today, we here at Fox Capital believe a bubble highly vulnerable to collapse lies in the corporate debt market and the passive investment vehicles accompanying it.  While C&I lending from the traditional banking system has been healthy since the last crisis ended, the corporate bond market has absolutely exploded, tripling in size from the peak of the prior cycle in 2007.  As a direct result of the Fed’s zero interest rate policy, investors of all kinds were forced out on the risk curve, scrambling for yields attractive enough to meet their own obligations. Pension funds, endowments, insurance companies and retail investors (through ETF’s and bond funds) gorged on corporate debt for extra yield in a ZIRP world.

…click on the above link to read the rest of the article…

Choking On the Salt of Debt

Choking On the Salt of Debt

Life After ZIRP

Roughly three years ago, after traversing between Los Angeles and San Francisco via the expansive San Joaquin Valley, we penned the article, Salting the Economy to Death.  At the time, the monetary order was approach peak ZIRP.


Our boy ZIRP has passed away. Mr. 2.2% effective has taken his place in the meantime. [PT]

We found the absurdity of zero bound interest rates to have parallels to the absurdity of hundreds upon hundreds of miles of blooming crop fields within the setting of an arid desert wasteland.

Given today’s changing financial conditions, namely the prospect of a sustained period of rising interest rates, we have taken the opportunity to refine our analysis.  What follows is an attempt to bring clarity to disorder.

The natural starting point for the topic at hand is from a place of delusion. That is, the popular delusion that central planners can stimulate robust economic growth by setting interest rates artificially low. The general theory is that cheap credit compels individuals and businesses to borrow loads of cash – and consume.

Over a sample size of five to ten years, say the growth half of the business cycle, central bankers can falsely take credit for engineering a productive economy.  Profits increase.  Jobs are created.  Wages rise.  A cycle of expansion takes root.  These are the theoretical benefits to an economy that central bankers claim they impart with just a little extra liquidity.  In practice, however, this policy antidote is a disaster.

Without question, cheap credit can have a stimulative influence on an economy with moderate debt levels. But once an economy has reached total debt saturation, where new debt fails to produce new growth, the cheap credit trick no longer works to stimulate the economy.  In fact, the additional credit, and its flip-side debt, distorts prices and strangles future growth.

…click on the above link to read the rest of the article…

Peter Schiff Explains “What Happens Next” In 47 Words

Outspoken critic of The Fed and one of the few that can see through the endless barrage of bullshit to how this really ends, has laid out in a tweet “what happens next”…

Likely sequence of events:

1. Bear market;

2. Recession;

3. Deficits explode;

4. Return of ZIRP and QE;

5. Dollar tanks;

6. Gold soars;

7. CPI spikes;

8. Long-term rates rise;

9. Fed. forced to hike rates during recession

10. A financial crisis without stimulus or bailouts!

h/t @PeterSchiff

This ‘Deflationary’ Bull Markets Ending – And Here’s What’s Coming Next For Investors

This ‘Deflationary’ Bull Markets Ending – And Here’s What’s Coming Next For Investors

After many years of cheap money and asset bubbles – it looks like the upside is finally over.

That is – the potential upside against the amount of risk taken on – is over.

I often write about investors needing to find asymmetric (low risk – high reward) opportunities. And lately – as I’ve written about earlier this month – many key indicators are now flashing potentially huge downside ahead.

As I wrote then – it’s not like I’m predicting markets to tank tomorrow. Or even next week.

But what I’m getting at is that there’s significantly more risk ahead than reward – at least for the general market and equities.

I’m not alone thinking this way. . .

Bank of America & Merrill Lynch (BAML) recently published a white paper with an interesting trading suggestion. . .

First, they show us that the nearly 10-year monster U.S. bull market has been highlydeflationary. And in case you forgot, deflation refers to when there’s an overall decline in the prices of goods and services.

The ‘deflationary assets’ group includes U.S. investment grade bonds, government bonds, the S&P 500, ‘growth stocks’, U.S. high yield credit, and U.S. consumer discretionary equities (aka non-essential goods – such as luxury goods, entertainment, automobiles, etc.) . . .

And the ‘inflationary assets’ group which includes commodities, developed market stocks (excluding U.S. and Canada), U.S. bank stocks, ‘value stocks’, cash, and treasury inflation protected securities (aka TIPS) . . .

Since the end of the 2008 crash – the Fed embarked on a ‘easy money’ and expansionary path via ZIRP (zero interest rate policy) and QE (quantitative easing; aka money printing).

But even after all this – deflationary assets have seriously outperformed inflationary assets. . .

…click on the above link to read the rest of the article…

Why Trade Wars Ignite and Why They’re Spreading

Why Trade Wars Ignite and Why They’re Spreading

The monetary distortions, imbalances and perverse incentives are finally bearing fruit: trade wars.
What ignites trade wars? The oft-cited sources include unfair trade practices and big trade deficits. But since these have been in place for decades, they don’t explain why trade wars are igniting now.
To truly understand why trade wars are igniting and spreading, we need to start with financial repression, a catch-all for all the monetary stimulus programs launched after the Global Financial Meltdown/Crisis of 2008/09.
These include zero interest rate policy (ZIRP), quantitative easing (QE), central bank purchases of government and corporate bonds and stocks and measures to backstop lenders and increase liquidity.
The policies of financial repression force risk-averse investors back into risk assets if they want any return on their capital, and brings consumption forward, that is, encourages consumers to borrow and buy now rather than delay purchases until they can be funded with savings.
As Gordon Long and I explain in the second part of our series on Trade Warsfinancial repression generates over-capacity and over-consumption: with credit almost free to corporations and financiers, new production facilities are brought online in the hopes of earning a profit as the global economy “recovers.”
Soon there is more productive capacity than there is demand for the good being produced: this is over-capacity, and it leads to over-production, which as a result of supply and demand, leads to a loss of pricing power: producers can’t raise prices due to global gluts, so they end up dumping their over-production wherever they can.
If the producers are state-owned enterprises subsidized by governments and central banks, these producers can sell at a loss because their only function is to sustain employment; profitability is a bonus.

…click on the above link to read the rest of the article…

The Greatest Bubble Ever: Why You Better Believe It, Part 2

The Greatest Bubble Ever: Why You Better Believe It, Part 2

During the 40 months after Alan Greenspan’s infamous “irrational exuberance” speech in December 1996, the NASDAQ 100 index rose from 830 to 4585 or by 450%. But the perma-bulls said not to worry: This time is different—-it’s a new age of technology miracles that will change the laws of finance.

It wasn’t. The market cracked in April 2000 and did not stop plunging until the NASDAQ 100 index hit 815 in early October 2002. During those a heart-stopping 30 months of free-fall, all the gains of the tech boom were wiped out in an 84% collapse of the index. Overall, the market value of household equities sank from $10.0 trillion to $4.8 trillion—-a wipeout from which millions of baby boom households have never recovered.

Likewise, the second Greenspan housing and credit boom generated a similar round trip of bubble inflation and collapse. During the 57 months after the October 2002 bottom, the Russell 2000 (RUT) climbed the proverbial wall-of-worry—-rising from 340 to 850 or by 2.5X.

And this time was also held to be different because, purportedly, the art of central banking had been perfected in what Bernanke was pleased to call the “Great Moderation”. Taking the cue, Wall Street dubbed it the Goldilocks Economy—-meaning a macroeconomic environment so stable, productive and balanced that it would never again be vulnerable to a recessionary contraction and the resulting plunge in corporate profits and stock prices.

Wrong again!

During the 20 months from the July 2007 peak to the March 2009 bottom, the RUT gave it all back. And we mean every bit of it—-as the index bottomed 60% lower at 340. This time the value of household equities plunged by $6 trillion, and still millions more baby-boomers were carried out of the casino on their shields never to return.

…click on the above link to read the rest of the article…

The Cost Basis of our Economy is Spiraling Out of Control

The Cost Basis of our Economy is Spiraling Out of Control

What will it take to radically reduce the cost basis of our economy?

If we had to choose one “big picture” reason why the vast majority of households are losing ground, it would either be the stagnation of income or the spiraling out of control cost basis of our economy, that is, the essential foundational expenses of households, government and enterprise.

Clearly, both rising costs and stagnating income cause households to lose ground, i.e. their income buys fewer goods and services every year.

I’ve often covered the dynamics of stagnating income for the bottom 95%, and real-world inflation, i.e. a decline in purchasing power.

But neither of these dynamics fully describes the relentless upward spiral of the cost basis of our economy, that is, the cost of essentials and the foundations of the economy: education, healthcare, energy and labor.

These expenses are pushing the costs of virtually every good and service, public and private, higher in a self-reinforcing spiral. The costs of education are spiraling out of control, stripping households of income as an entire generation is transformed into debt-serfs by student loan debt. The soaring costs of healthcare are a core driver of higher costs in the education complex (and goverment in general), and to cover these higher costs, counties raise property taxes, which add additional cost burdens to households and enterprises as rents rise.

Rising rents push the cost structure of almost every enterprise and agency higher.

Then there’s the asset inflation created by central bank ZIRP (zero interest rate policy) which has inflated a second echo-bubble in housing that has pushed home ownership out of reach of many, adding demand for rental housing that has pushed rents into the stratosphere in Left and Right Coast cities.

…click on the above link to read the rest of the article…

700 Years Of Data Suggests The Reversal In Rates Will Be Rapid

700 Years Of Data Suggests The Reversal In Rates Will Be Rapid

Have we been lulled into a false sense of security about the future path of rates by ZIRP/NIRP policies? Central banks’ misguided efforts to engineer inflation have undoubtedly been woefully feeble, so far. As the Federal Reserve “valiantly” raises short rates, markets ignore its dot plot and yield curves continue to flatten. And thanks to Larry Summers, the term “secular stagnation” has entered the lexicon.  While it sure doesn’t feel like it, could rates suddenly take off to the upside?

A guest post on the Bank of England’s staff blog, “Bank Underground”, answers the question with an unequivocal yes. Harvard University’s visiting scholar at the Bank, Paul Schmelzing, normally focuses on 20th century financial history. In his guest post (see here), he analyses real interest rates stretching back a further 600 years to 1311. Schmelzing describes his methodology as follows.

We trace the use of the dominant risk-free asset over time, starting with sovereign rates in the Italian city states in the 14th and 15th centuries, later switching to long-term rates in Spain, followed by the Province of Holland, since 1703 the UK, subsequently Germany, and finally the US.

Schmelzing calculates the 700-year average real rate at 4.78% and the average for the last two hundred years at 2.6%. As he notes “the current environment remains severely depressed”, no kidding. Looking back over seven centuries certainly provides plenty of context for our current situation, where rates have been trending downwards since the early 1980s. According to Schmelzing, we are in the ninth “real rate depression” since 1311 as shown in his chart below. We count more than nine, but let’s not be picky.

…click on the above link to read the rest of the article…

The Biggest Ponzi in Human History


Jean-Léon Gérôme Slave market 1866
Here’s the story in a nutshell: Ultra low interest rates mark a shift away from people’s wealth residing in their savings and pension plans, and into to so-called wealth residing in their homes, which are bought with ever growing levels of debt. When interest rates rise, they will lose that so-called wealth.

It is grand theft auto on an unparalleled scale, and it’s a piece of genius, because while people are getting robbed in plain daylight, they actually think they’re winning. But as I wrote back in March of this year, home sales, and bubbles, are the only thing that keeps our economies humming.

We haven’t learned a thing since March, and we haven’t learned a thing for many years. People need a place to live, and they fall for the scheme hook line and sinker. Which in a way is a good thing because the economy would have been dead without that ignorance, but at the same time it’s not because it’s a temporary relief only and the end result will be all the more painful for it.

Whatever Yellen decides as per rates, or Draghi, it doesn’t really matter anymore, this sucker’s going down something awful. This is a global issue. Housing bubbles have been blown not only in the Anglosphere, though they are strong there, many other countries have them as well, Scandinavia, Netherlands, even Germany and France. It’s what ultra low rates do.

First, here’s what I said in March:

Our Economies Run On Housing Bubbles

What we have invented to keep big banks afloat for a while longer is ultra low interest rates, NIRP, ZIRP etc. They create the illusion of not only growth, but also of wealth. They make people think a home they couldn’t have dreamt of buying not long ago now fits in their ‘budget’. That is how we get them to sign up for ever bigger mortgages. And those in turn keep our banks from falling over.

…click on the above link to read the rest of the article…

Necessity is the Mother of Invention–Retirees Desperate Reach for Yield

Ben Bernanke’s creativity inspired a generation of economists and central bankers. QE, ZIRP and NIRP established a new class of economics that is mathematically sound but practically disastrous. Billions of dollars were transferred from savers to investors to boost the economy, but the wizards of quant forgot that something has to give. In this case, it was the formation of a pension crisis that threatens the golden years of millions of retirees across the world. None of the econometrics models provide a solution for the growing gap in pension funding, other than unsustainable debt accumulation.

Creativity cascaded to the less sophisticated pension fund managers. In a desperate reach for yields they increased exposure to project finance. Perceived higher returns, long-term investment horizon and inflation protection made it the perfect match for pension funds. However, like their central banker peers, pension fund managers were completely mistaken. Actual risks were largely underestimated. The binary nature of cashflow risks makes conventional risk measures meaningless. This is best illustrated by looking at the cumulative default rates of project finance (1991-2011) in North America, which exceeded the default rate of the non-investment grade Ba bonds in the first 6 years and is more than triple that of investment grade default rates.

Cum Defaut Rates

The European Investment Bank (EIB) decided to ride the wave of project finance and waste taxpayers’ money by providing loans and insurance on risks that EIB cannot remotely comprehend. They ignored the fact that mono-liners in the US did the same a decade ago and paid a hefty price when the bubble burst where almost all bond insurers went out of the market.

…click on the above link to read the rest of the article…

Olduvai IV: Courage
Click on image to read excerpts

Olduvai II: Exodus
Click on image to purchase

Click on image to purchase @ FriesenPress