Home » Posts tagged 'wolf street'

Tag Archives: wolf street

Olduvai
Click on image to purchase

Olduvai III: Catacylsm
Click on image to purchase

Post categories

Post Archives by Category

Producer Prices Surge. Germany, China, other Countries Are Now Exporting Inflation, Adding to US Inflation Pressures

Producer Prices Surge. Germany, China, other Countries Are Now Exporting Inflation, Adding to US Inflation Pressures

Central banks still brush it off as just “temporary.”

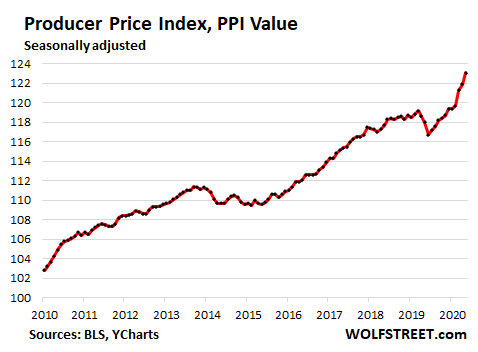
Producer prices of German industrial products in March rose by 0.9% from February, after having risen by 0.7% in February from January, and after having spiked by 1.4% in January from December, the biggest month-to-month jump since 2008.

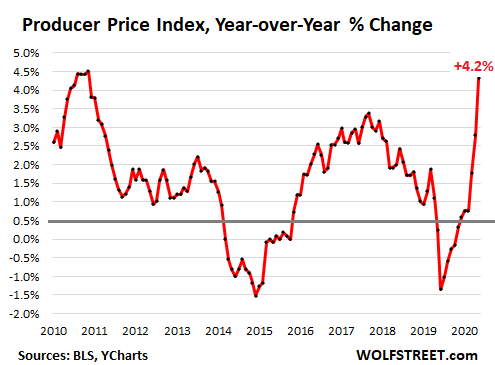
Compared to March last year, producer prices jumped by 3.7%, according to the German Federal Statistics Office (Destatis), the biggest year-over-year jump since November 2011. The surge began last fall, after sharp declines earlier in the year:

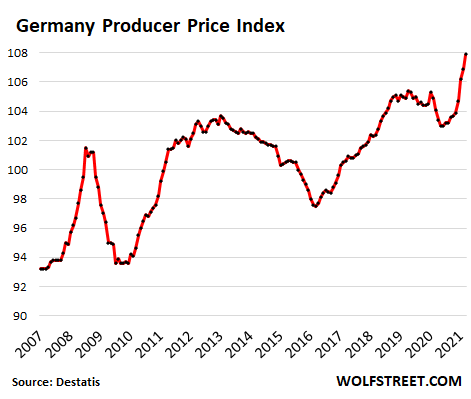
Part of what caused the 3.7% increase from March last year — but not the surge over the past few months — is the “base effect“, since in February and March last year the producer price index was declining, and the latest year-over-year results are measured from those low points.

But factory prices have been rising on a month by month basis for the seventh straight months — with large increases over the past three months. And that has nothing to do with the base effect.

Prices of intermediate goods jumped by 5.7% year over year in March, the fastest since July 2011, due mainly to sharp rises in the price of secondary raw material (47%) and prepared feed for farm animals (16%). There were also increases in durable consumer goods (1.4%) and energy (8%), which in large part were driven by a sharp increase in electricity prices (9.6%).

Producer prices are now rising fast in the major manufacturing economies.

In China input costs rose 4.4% in March from a year earlier up from a 1.7% increase in February. It was the sharpest rise since July 2018. As the world’s biggest exporter, China’s rising prices stoke inflation around the world.

…click on the above link to read the rest of the article…

Dollar’s Purchasing Power Drops Sharply to Record Low, But It’s a Lot Worse than CPI Shows

Dollar’s Purchasing Power Drops Sharply to Record Low, But It’s a Lot Worse than CPI Shows

If the homeownership component in CPI mirrors the Case-Shiller Home Price Index, CPI would jump 5.1%! Not to speak of new & used vehicle prices, which I nevertheless speak of.

The Consumer Price Index jumped 0.6% in March compared to February, the sharpest month-to-month jump since 2009, according to the Bureau of Labor Statistics today, and was up 2.6% from a year earlier, after the 1.7% rise in February.

The infamous Base Effect, which I discussed last week in anticipation of what is now coming, was responsible for part of it: CPI had dipped in March last year, which created a lower base for today’s year-over-year comparison. Over the 13 months since February last year, which eliminates the Base Effect, CPI rose 2.3%.

  • Prices of durable goods continued their upward surge, rising 3.7% from a year ago (purple line);
  • Prices of nondurable goods, which are largely food and energy, including gasoline, jumped 4.2% (green line);
  • Prices of services rose 1.8%. This is the biggie, accounting for two-thirds of overall CPI. It is dominated by a measure for homeownership costs, which ludicrously, as home prices are exploding, merely ticked up 2.0% from a year ago. More on that in a moment.

Consumer price inflation means loss of purchasing power of the consumer dollar, and thereby the loss of the purchasing power of labor denominated in dollars. And the purchasing power thus measured dropped 0.5% in March from February to a new record low, according to the BLS data. Given the insistence by the Fed on perma-inflation, the dollar’s purchasing power keeps dropping from record low to record low:

But wait, it’s a lot worse…

…click on the above link to read the rest of the article…

I Now Track the Most Important Measure of the Fed’s Economy: the “Wealth Effect” and How it Impacts Americans Individually

I Now Track the Most Important Measure of the Fed’s Economy: the “Wealth Effect” and How it Impacts Americans Individually

The Fed provides the data quarterly, I dissect it at the stunning per-capita level.

The Federal Reserve is pursuing monetary policies that are explicitly designed to inflate asset prices. The rationalization is that ballooning asset prices will create the “wealth effect.” This is a concept Janet Yellen, when she was still president of the San Francisco Fed, propagated in a paper. In 2010, Fed Chair Ben Bernanke explained the wealth effect to the American people in a Washington Post editorial. And in early 2020, Fed Chair Jerome Powell pushed the wealth effect all the way to miracle levels.

Today we will see the per-capita progress of that wealth effect – what it means and what it accomplishes – based on the Fed’s wealth distribution datathrough Q4 2020, and based on Census Bureau estimates for the US population over the years. Here are some key results. At the end of 2020, the per-capita wealth (assets minus debts) of:

  • The 1% = $11.7 million per person (green);
  • The next 9% = $1.6 million per person (blue);
  • The 50% to 90% = $263,016 per person (red line at the bottom).
  • The bottom 50% = $15,027 per person. That amount of wealth is so small it doesn’t show up on this per-capita chart that is on a scale of wealth that accommodates the 1%.

The total population in 2020, according to the Census Bureau, was 330 million people. The 1% amount to 3.3 million people. Back in 2000, the population was 283 million people, and the 1% amounted to 2.8 million people. So the 1% has grown by 473,000 people because the population has gotten larger. And the 50% – the have-nots, as we’ll see in a moment – have grown by 24 million people.

…click on the above link to read the rest of the article…


Producer Prices Blow Out

Producer Prices Blow Out

And companies have been reporting that they’re able to pass on those surging costs. So here we go with inflation.

Inflation that producers are experiencing is now blowing out. The surging input costs and the ability to pass on those higher input costs that have been reported by company executives as part of the services PMIs and manufacturing PMIs, and that owners of small businesses have told me about for months, have now solidly fired up the Producer Price Index for final demand, which in March jumped by 1.0% from February – double the rate that economists polled by Reuters had forecast – after having jumped 0.5% in February, and 1.3% in January. The PPI has now taken off, after hovering in fairly benign territory last year.

Compared to March last year, the PPI jumped by 4.2%, the sharpest year-over-year increase since 2011, according to the Bureau of Labor Statisticstoday. Note the surge over the past three months (data via YCharts):

The “Base Effect” that I discussed yesterday can be blamed for only a portion of the year-over-year increase. A big part of the base effect is going to come in April.

The PPI hit a high in January 2020 with an index value of 119.2. In February and March last year, it dropped 0.5% from the prior month, and in April it plunged 1.1% to an index value of 116.7, driven by the collapse in fuel prices. And that was it in terms of declines. It has been rising ever since (data via YCharts):

What might April look like? Today’s index value at 123.1 is already 5.5% higher than that of April last year. If the PPI rises 0.5% in April from today’s level, it would make for a 6% year-over-year increase, the highest since the index was started in November 2009. And this would include the full brunt of the base effect.

…click on the above link to read the rest of the article…

For Stocks, Any Election Outcome is Now the Best Outcome, Disputed Election, Long Legal Mess, Split Government Without Stimulus, Whatever…

For Stocks, Any Election Outcome is Now the Best Outcome, Disputed Election, Long Legal Mess, Split Government Without Stimulus, Whatever…

This is funny in terms of stock-market “narratives” during these crazy times.

At first, long ago, the narrative was that a Trump victory would boost stocks. And then when this became more uncertain, the narrative was that a Biden victory would also boost stocks, and that a “Blue Wave” would boost stocks hugely because it would trigger the mother of all stimulus packages, which would spread trillions of dollars directly and indirectly to these companies, which would be good for stocks.

And so it was that a victory by either presidential candidate would boost stocks, and that only a disputed election outcome with a long drawn-out legal battle or a split government would derail stocks.

And now, that Trump is already disputing the still unknown election outcome and is threatening a long-drawn-out legal battle if he loses – with Biden leading in electoral votes but millions of mail-in ballots left to be counted – even the threat of a disputed election and a long-drawn-out mess is now boosting stocks.

And even funnier: The only remaining outcome that would not boost stocks, and by some measures would be the worst possible outcome during these times – namely a split government, with the Senate remaining under Republican control and Biden in the White House, and therefore no stimulus package – is suddenly a distinct possibility. But it now too is seen as boosting stocks because it would mean, according to the newly fashioned narrative, that the absence of a Blue Wave would be good for Big Tech because it would be less threatened by antitrust pressures.

…click on the above link to read the rest of the article…

Third Mega-Crisis in 12 Years: Eurozone Economy Plunges at Fastest Rate on Record

Third Mega-Crisis in 12 Years: Eurozone Economy Plunges at Fastest Rate on Record

First the Global Financial Crisis, then the Euro Debt Crisis, now the Big One.

In its 21 years of official existence, the Eurozone has already been through two brutal crises — the Global Financial Crisis and one of its own doing, the Euro Debt Crisis — that nearly tore the bloc apart. Now, it is in the grip of another one that is already exacting a larger toll than the first two, despite having barely begun.

The preliminary GDP in the first quarter for the Eurozone, GDP fell by 3.8%, according to Eurostat’s flash estimates (for the entire EU, it fell by 3.5%), “the sharpest declines observed since the time series started in 1995,” Eurostat said. This is despite the fact that most of the region’s lockdowns did not begin until mid-March:

All things considered, the Euro Area’s biggest economy, Germany, got off relatively lightly. It shrank by just (!!) 2.2% compared to the previous quarter. It was still its biggest contraction since the the Global Financial Crisis, more than a decade ago. German industrial production was particularly hard hit, tumbling by 11.6% year-on-year in March, when the lockdown forced factories to close. In Q4 2019, Germany’s GDP growth rate was already negative (-0.1%).

But many other Euro Area countries fared a lot worse. Of the four worst performing economies, three are the bloc’s second, third and fourth largest, France, Italy and Spain, which between them account for almost 45% of Euro Area GDP. The other was Slovakia. Spain, Italy and France suffered more cases of Covid-19 and resulting fatalities than any other countries in the Euro Area. They also imposed the most draconian lockdowns. The impact on their economies has been brutal.

…click on the above link to read the rest of the article…

Life Under Draconian Lockdown: I Can Barely See the Light at the End of this Long, Dark Tunnel

Life Under Draconian Lockdown: I Can Barely See the Light at the End of this Long, Dark Tunnel

The process of reopening Spain has been dubbed, rather ominously, “Operation New Normality.”

“Is there any light at the end of this long dark tunnel?” That’s a question many people are asking themselves in Spain, whose government has implemented one of the most draconian anti-Covid lockdown regimes in the world and is now beginning to loosen some of the restrictions. Sunday was the first time in 43 days that children were allowed to venture out, albeit only for a maximum of one hour. And only if they were accompanied by one adult. And under the age of 14.

It was hardly a return to normality, but after six long weeks of being cooped up at home, most of the children and their parents were happy to take up the invitation of a little fresh air, a few rays of sunshine and some open space. For the first time in a month and a half, the streets and squares of villages, towns and cities across Spain were alive with the sound of people.

This being Spain, not everyone obeyed the government’s slightly loosened rules. From the vantage point of our balcony, in the Exiample Dreta district of Barcelona, my wife and I could see many children being shepherded by both of their parents. We could also spot groups of families together as well as opportunistic childless couples who were hoping to blend in with the crowds unnoticed. Some got away with it. Others were stopped by the police and given a stern warning or fined.

Since the lockdown began in Spain some 740,000 people — the equivalent of 18,000 per day — have been fined for breaking the government’s Covid-19 rules, according to El País.

…click on the above link to read the rest of the article…

THE WOLF STREET REPORT: How Even “Low” Interest Rates Screw Up the Economy

THE WOLF STREET REPORT: How Even “Low” Interest Rates Screw Up the Economy

Interest rates don’t have to be negative to make a mess in the era of “Secular Stagnation.” (11 minutes)

The Most Splendid Housing Bubbles in Canada Deflate Further

The Most Splendid Housing Bubbles in Canada Deflate Further

Vancouver prices drop. Toronto down 3.7% from peak, flat for 10 months. Winnipeg plunges most since at least 1990. Quebec City flat for 6 years.

In Greater Vancouver, BC, Canada, house prices fell 0.4% in April from March, the ninth month in a row of month-to-month declines, according to the Teranet-National Bank House Price Index. The index is down 4.7% from the peak in July 2018, the sharpest nine-month decline since July 2009. And it’s down 2.8% from April last year. One of the most splendid housing bubbles in the world is now deflating before our very eyes, after prices had skyrocketed 316% from January 2002 to the peak in July 2018 – meaning prices had more than quadrupled in 16 years:

The Teranet-National Bank House Price Index tracks single-family house prices, based on “sales pairs,” comparing the sales price of a house in the current month to the last sale of the same house years earlier (methodology). Using “sales pairs” eliminates the issues that affect median and average price indices but has its own limitations. These median and average house prices, which are much more volatile, are now showing much sharper price declines for Vancouver.

Because the Teranet index uses a similar methodology of “sales pairs” as the S&P CoreLogic Case Shiller index for US housing markets, the indices produce comparable metrics. So let’s compare Vancouver’s housing bubble to the also deflating housing bubble in the San Francisco Bay Area. Splendid v. Splendid. The chart below shows the data of Vancouver (black columns) and San Francisco (red columns), with both indices converted into “percent change from January 2002.”

As the chart above shows, Vancouver’s housing market dipped briefly during the Financial Crisis while San Francisco’s market went into a hard four-year downturn, as the US housing bust morphed into the Mortgage Crisis that contributed to the Financial Crisis.

 …click on the above link to read the rest of the article…

Credit-Cardholders & Bank Customers Burned Again as New IT Chaos Breaks Out in the UK

Credit-Cardholders & Bank Customers Burned Again as New IT Chaos Breaks Out in the UK

The payments industry deplores it, but cash is starting to look pretty good, and central banks agree: “We do not foresee a totally cashless society”: ECB

This has not been a good year for IT systems in the UK. First there was TSB Bank’s botched IT migration in April, which resulted in millions of customers being blocked from their online accounts. The problems at the bank continue to fester even to this day, 22 weeks later. Then there was the Visa outage in June, which caused chaos across much of Western Europe, but particularly in the UK where consumers are far more reliant on contactless Visa cards. And now there’s British Airways and Lloyds Banking Group.

On Thursday, British Airways announced that up to 380,000 card payments on both its website and app had been compromised during a 15-day data breach. BA says the breach affected bookings made between 10.58 pm on August 21 and 9.45 pm on September 5. The compromised data included the personal and financial details of the passengers that booked during that period.

BA says it was not a breach of the airline’s encryption. “There were other methods, very sophisticated efforts, by criminals in obtaining our data,” BA’s chief executive, Álex Cruz, said.

Some customers have complained of having to cancel cards as a result of the breach while others are considering changing their online passwords. BA launched a massive charm offensive assuring customers who lose out financially that they will be compensated. That didn’t stop the shares of BA’s Anglo-Spanish multinational holding company, International Consolidated Airlines Group, S.A., from falling 5% between Thursday and Friday.

…click on the above link to read the rest of the article…

What Kind of Hyper-Enthusiastic Market is this that Blindly Keeps Pursuing Scams to Make a Fortune Overnight, even if They Already Crashed the First Time?

What Kind of Hyper-Enthusiastic Market is this that Blindly Keeps Pursuing Scams to Make a Fortune Overnight, even if They Already Crashed the First Time?

It’ll take many more sell-offs and the collapse of many more iffy stocks before this hyper-enthusiasm, after nine years of central bank nurturing, is finally wrung out of the market.

Shares of “blockchain” company LongFin (LFIN) plunged 17% today to $14.31, the sixth trading day in a row of plunges. Intraday on Friday, March 23, shares still traded at $73. The astonishing thing isn’t that they’ve plunged 81% over those six trading days, but that they had more than doubled over the prior two weeks, and that they’re still trading above penny-stock status to begin with.

LFIN started trading on December 13, following their IPO. On December 15, LongFin announced – with what I called it “a mix of gobbledygook, hype, and silliness” – that it had acquired a “Blockchain-empowered solutions provider,” namely a website that belonged to a Singapore corporation that is 95% owned by Longfin’s CEO and chairman.

Though neither the announcement nor the transaction passed the smell-test, shares skyrocketed 2,700% to an intraday high of $142.55 on December 18, giving it a market cap of $7 billion and making it the role model for a bevy of other “blockchain” companies. Then, as stock jockeys grappled with reality, shares plunged. As did the shares of other “blockchain” companies.

But then on March 12, it started all over again, when index provide FTSE Russell announced that LongFin would be added to some of its indices, including the widely-tracked Russell 2000, effective March 16:

Then all kinds of things happened.

On March 26, short-seller Citron Research tweeted: “If you are fortunate enough to get a borrow, indeed $LFIN is a pure stock scheme. @sec_enforcement should not be far behind. Filings and press releases are riddled with inaccuracies and fraud.”

…click on the above link to read the rest of the article…


What Could Dethrone the Dollar as Top Reserve Currency?

What Could Dethrone the Dollar as Top Reserve Currency?

Central banks seem leery about the Chinese yuan.

What will finally pull the rug out from under the dollar’s hegemony? The euro? The Chinese yuan? Cryptocurrencies? The Greek drachma? Whatever it will be, and however fervently the death-of-the-dollar folks might wish for it, it’s not happening at the moment, according to the most recent data.

The IMF just released its report, Currency Composition of Official Foreign Exchange Reserves (COFER) for the fourth quarter 2017. It should be said that the IMF is very economical with what it discloses. The COFER data for the individual countries – the total level of their reserve currencies and what currencies they hold – is “strictly confidential.” But we get to look at the global allocation by currency.

In Q4 2017, total global foreign exchange reserves, including all currencies, rose 6.6% year-over-year, or by $709 billion, to $11.42 trillion, right in the range of the past three years (from $10.7 trillion in Q4 2016 to $11.8 trillion in Q3, 2014). For reporting purposes, the IMF converts all currency balances into dollars.

Dollar-denominated assets among foreign exchange reserves rose 14% year-over-year in Q4 to $6.28 trillion, and are up 42% from Q4 2014. There is no indication that global central banks have lost interest in the dollar; on the contrary:

Over the decades, there have been some efforts to topple the dollar’s hegemony as a global reserve currency, which it has maintained since World War II. The creation of the euro was the most successful such effort. Back in the day, the euro was supposed to reach “parity” with the dollar on the hegemony scale. And it edged up for a while until the euro debt crisis derailed those dreams.

And now there’s the ballyhooed Chinese yuan. Effective October 1, 2016, the IMF added it to its currency basket, the Special Drawing Rights (SDR). This anointed the yuan as a global reserve currency.

…click on the above link to read the rest of the article…

Banks & Builders Want New Property Bubble In Spain, Government Obliges

Banks & Builders Want New Property Bubble In Spain, Government Obliges

“This plan, far from solving or alleviating the problem, is likely to make it a whole lot worse.”

Spain’s second biggest bank, BBVA, just announced that it’s resurrecting the 100% mortgage, a high-risk loan instrument that notoriously helped fuel Spain’s madcap property boom. For the first time in almost a decade, property buyers will be able to receive credit equivalent to the total value of the property they wish to purchase. As before, no down payment will be needed. But this time, interest rates will be even lower.

Despite boasting the largest stock of empty housing in Europe — 1.36 million units at last count, almost a quarter of them belonging to banks and investment funds — Spain’s economy is being primed for another property boom. Real estate developers and builders want it and banks need it, not only to fatten their NIRP-eroded margins but also to dispose of some of the real estate assets still lingering on their books from the last crisis.

The government will do just about anything it can to help out. For the coming years, real estate developers want to build around 120,000-150,000 new housing units. It’s a mere fraction of the 700,000 new homes a year being built at the apogee of the last bubble — more than in France, Germany, Italy and the UK combined — but still a lot higher than current production levels.

In 2017, a paltry 43,300 new homes were built — little more than a third of the ambitious target real estate developers now have in their sights. There’s likely to be little change in this trend in the coming years, according to forecasts by the National Institute of Statistics (INE). Between 2017 and 2021 it predicts that around 188,000 new homes will be built – an average of just 47,000 a year.

…click on the above link to read the rest of the article…

Even the World’s Most Cashless Nation Doesn’t Want to Go Fully Cashless

Even the World’s Most Cashless Nation Doesn’t Want to Go Fully Cashless

It’s too risky and systematically excludes the most vulnerable people.

There are small but growing signs that Europe’s “War on Cash” is not going exactly according to plan. First, a number of central bankers began voicing concerns about its potential ramifications. Now, even in Sweden, the first European country to enlist its own citizens as largely willing guinea pigs in an economic experiment — negative interest rates in a cashless society — public support is beginning to waver.

Initially, the plan was so successful that by 2017 the amount of cash in circulation had dropped to the lowest level since 1990 and was more than 40% below its 2007 peak, earning Sweden a reputation as the world’s “most cashless nation.” The declines in 2016 and 2017 were the biggest on record. An annual survey by Insight Intelligence found that in 2017, only 25% of Swedes paid in cash at least once a week, down from 63% just four years before; and 36% never used cash at all, or just pay with it once or twice a year.

But that doesn’t mean everyone is on board. In a recent survey, an overwhelming 68% of the respondents stated that they would not like to live in a fully cashless society. The survey, commissioned by Bankomat AB, an ATM chain company representing an alliance of Swedish banks that admittedly has a vested interest in preserving cash’s role as a means of payment, polled over 2,000 people aged 18-65.

Opinions differed markedly between age groups but in no single demographic was there a majority in favor of abolishing physical currency. Among the 18-29 year old respondents 56% declared that they still want to keep cash while 38% said they would welcome a cashless society. Among the survey’s oldest demographic, the 65-year-olds, 85% wanted to keep cash.

…click on the above link to read the rest of the article…


Catalonia Crisis Far From Over Despite Market Surge

Catalonia Crisis Far From Over Despite Market Surge

Hopes that Catalonia’s woes could be contained are fading.

On Tuesday night, for the briefest of moments, Catalonia’s government severed its ties with Spain. The region’s president, Carles Puigdemont, declared independence from Spain at around 7.40 p.m., Spanish time. Then, roughly ten seconds later, he put it all on hold, to the visible dismay of many of his fellow travelers.

The markets were pleased, interpreting the suspended declaration of independence as a retreat from the brink. The Spanish stock index IBEX 35 surged 1.5% on Wednesday, and is up 3.4% in five trading days, making up a big part of what it had lost over the prior four trading days. It remains 7% below its year-to-date high at the end of April.

For many other aspiring nation states, the key to independence lay in getting enough votes on the UN security council. But if Catalonia’s bid for self-determination ever made it to the UN, it probably wouldn’t garner enough support from the Security Council, for the simple reason that an independent Catalonia could encourage other separatist regions in the EU to launch similar bids.

So why did Puigdemont change the script at the very last minute? According to the Catalan government’s chief spokesperson, Jordi Turull, he did so in response to pressure from key international mediators that are insisting on dialogue between Barcelona and Madrid. “[They] said that if we did this they would be willing to act,” said Turull, who refused to reveal the identity of said mediators.

The problem is that Madrid has shown absolutely no interest in dialogue, for two main reasons:

…click on the above link to read the rest of the article…

Olduvai IV: Courage
Click on image to read excerpts

Olduvai II: Exodus
Click on image to purchase

Click on image to purchase @ FriesenPress