Home » Posts tagged 'weather'

Tag Archives: weather

Olduvai
Click on image to purchase

Olduvai III: Catacylsm
Click on image to purchase

Post categories

Post Archives by Category

Torrential Rains Trigger Flash Floods Across California

Torrential Rains Trigger Flash Floods Across California

Since the end of December, a ‘parade of cyclones’ has swamped California. The latest round of torrential rain has caused flooding in Los Angeles County, and still unclear in the early morning hours of Tuesday the extent of the destruction, though social media video on Monday evening shows flooded streets, overflowing streams and rivers, and mudslides in what is usually a dry, sunny place where residents have to worry about drought.

National Weather Service said 34 million people are under flood alerts across Southern and Central California through early Tuesday. In Los Angeles County, a flood warning is in effect through the evening.

Dramatic footage has surfaced on social media showing the widespread flooding.

Forecasters estimate the latest round of rain could bring upwards of 5-10 inches in some areas by the end of this week.

More stormy weather is forecasted for today. NWS said heavy precipitation is expected this morning and will begin to taper later in the day, warning a new and “energetic” low-pressure system was becoming more powerful offshore.

Officials said Los Angeles and San Diego residents faced an increased risk of flash flooding and mudslides. Tropical storm-strength winds were also forecast for San Luis Obispo County. Parts of Highway 101, which runs up and down the West Coast, were closed due to flooded-out sections of the major roadway.

Santa Barbara County told residents to shelter in place and closed public schools today. Officials told wealthy residents of Montecito, such as Prince Harry and Meghan, the Duchess of Sussex, to evacuate because of the flooding.

And it was just only six months ago ‘global warming’ alarmists and celebrities were complaining about droughts…

California Governor Gavin Newsom announced yesterday that storms had caused 14 deaths. He said that figure was higher than deaths caused by “wildfires in the past two years combined.”

…click on the above link to read the rest…

‘Pineapple Express’ And Bomb Cyclone To Wallop California

‘Pineapple Express’ And Bomb Cyclone To Wallop California

A moisture conveyor belt of atmospheric rivers has unleashed near-record rainfall across the West Coast. Another, perhaps, more powerful atmospheric river and bomb cyclone are set to target California on Wednesday and Thursday, continuing ten days of heavy rains and snow for higher altitudes.

The National Weather Service office in the Bay Area warned about the imminent storm, calling it a “truly … brutal system … that needs to be taken seriously.”

“To put it simply, this will likely be one of the most impactful systems on a widespread scale that this meteorologist has seen in a long while,” an NWS meteorologist in San Francisco, adding, “the impacts will include widespread flooding, roads washing out, hillside collapsing, trees down (potentially full groves), widespread power outages, immediate disruption to commerce and the worst of all, likely loss of human life.”

The developing atmospheric river formed near Hawaii and, by Wednesday morning, will spread tropical moisture into California by a low-pressure system. This weather phenomenon is known as the “Pineapple Express.”

“Basically, an (atmospheric river) is a river in the sky of water vapor, and when it hits the mountains, (the moisture) is forced up over the mountains. 

 “That upward motion causes clouds and precipitation to form, and the faster the flow of air and water vapor is hitting the mountains, the faster the rain is falling, so you get more and more rain with the stronger ARs hitting the mountains,” Marty Ralph, Director of the Center for Western Weather and Water Extremes, told FOX Weather

The heaviest rainbands are forecasted over parts of California Wednesday afternoon and evening into Thursday morning. NWS has already posted flood alerts across the Golden State.

Another 2-3 inches could be expected across the San Francisco area. Even the Los Angeles metro area could see 1-3 inches.

…click on the above link to read the rest…

Global NatGas Prices Sink As Warm Weather Spreads

Global NatGas Prices Sink As Warm Weather Spreads

US and European natural gas prices are sliding as warmer weather reduces demand for the heating fuel, and storage levels remain high. Risks of a global energy crisis are diminishing for now — well — that’s until the next cold blast strikes.

The polar vortex that sent much of the Lower 48 into a deep freeze at the end of 2022 ended last week. Now, much of the US will see warmer-than-normal temperatures through mid-Jan.

The National Oceanic and Atmospheric Administration’s latest 6-10 Day Temperature Outlook shows that nearly all Lower 48 will experience above-average weather.

NOAA’s 8-14 Day Temperature Outlook suggests the same.

Weather data via Bloomberg shows Lower 48 temperatures are expected to remain above a 30-year average through mid-month.

And this will reduce heating demand.

US NatGas storage entered into a drawing period in mid-Nov. and has been sliding since.

A weaker heating demand outlook has sent US NatGas prices down nearly 9% to $4.062 per million British thermal units on the New York Mercantile Exchange in early Tuesday trading. Prices are back to levels not seen since early February 2022.

Across the Atlantic, EU NatGas touched the lowest levels since the start of the Ukraine war.

“The risk of extreme market tightness that people were worried about before the winter started seems low now,” BloombergNEF’s Abhishek Rohatgi wrote.

Warmer weather in Europe has eased concerns about blackouts and rationing as stockpiles increase:

In fact, Europe has been able to add more gas into storage in the last few days amid a mix of curbed heating needs and typically lower consumption during the holiday season. -Bloomberg

EU NatGas storage increased last week.

Temperatures across Central EU are expected to hold above seasonal levels through at least the mid-month.

Sign of relief worldwide: NatGas prices slide in the US, EU, and Asia.

…click on the above link to read the rest…


Strong signs that La Nina is breaking down

Strong signs that La Nina is breaking down

Strong signs that La Nina is breaking down

After three successive La Niñas, there are strong signs that the latest La Niña is quickly waning and will release its grip and move towards neutral in its effect on Australia in the second half of summer into autumn, as the previous two did.

This means we can expect an end to the relentlessly wet weather which has lashed large parts of Australia in recent summers, and for much of 2022 – with a return to drier, potentially warmer conditions as we move through summer.

How do we know this? The chart below tells you most of what you need to know.

  • The chart shows an ocean pattern called the Kelvin wave – which moves across the Pacific underneath the surface of the ocean – transporting the warmer-than-usual water that we’ve had in Australian waters back into the central Pacific.
  • At the same time, this is causing the colder waters in the eastern Pacific to retreat, slowly shutting down the cycle.

In simple terms, as those red blobs move west (or to the right of the chart), the effects of La Niña become less pronounced.

Why does warmer water moving away from our region signal the end of La Niña?

Because warm-than-usual water near Australia is La Niña’s fuel.

If you go back to the La Niña explainer piece which we wrote in September 2022, we told you that La Niña occurs when:

  • The temperature contrast that develops across the equatorial Pacific Ocean supports stronger trade winds blowing from east to west across surface of the Pacific.
  • These enhanced trade winds cause warmer-than-average water to pile up on the western side of the equatorial Pacific Ocean and cooler-than-average water to form in the central and western equatorial Pacific.

…click on the above link to read the rest…

A quarter of America could experience LONG BLACKOUTS this winter due to energy supply problems

Image: A quarter of America could experience LONG BLACKOUTS this winter due to energy supply problems

(Natural News) Large parts of North America could face long blackouts and other energy emergencies this winter as supplies of natural gas and coal begin to tighten.

According to the latest seasonal assessment of the North American Electric Reliability Council (NERC), a large portion of the North American [bulk-power system] is “at risk of insufficient electricity supplies during peak winter conditions.”

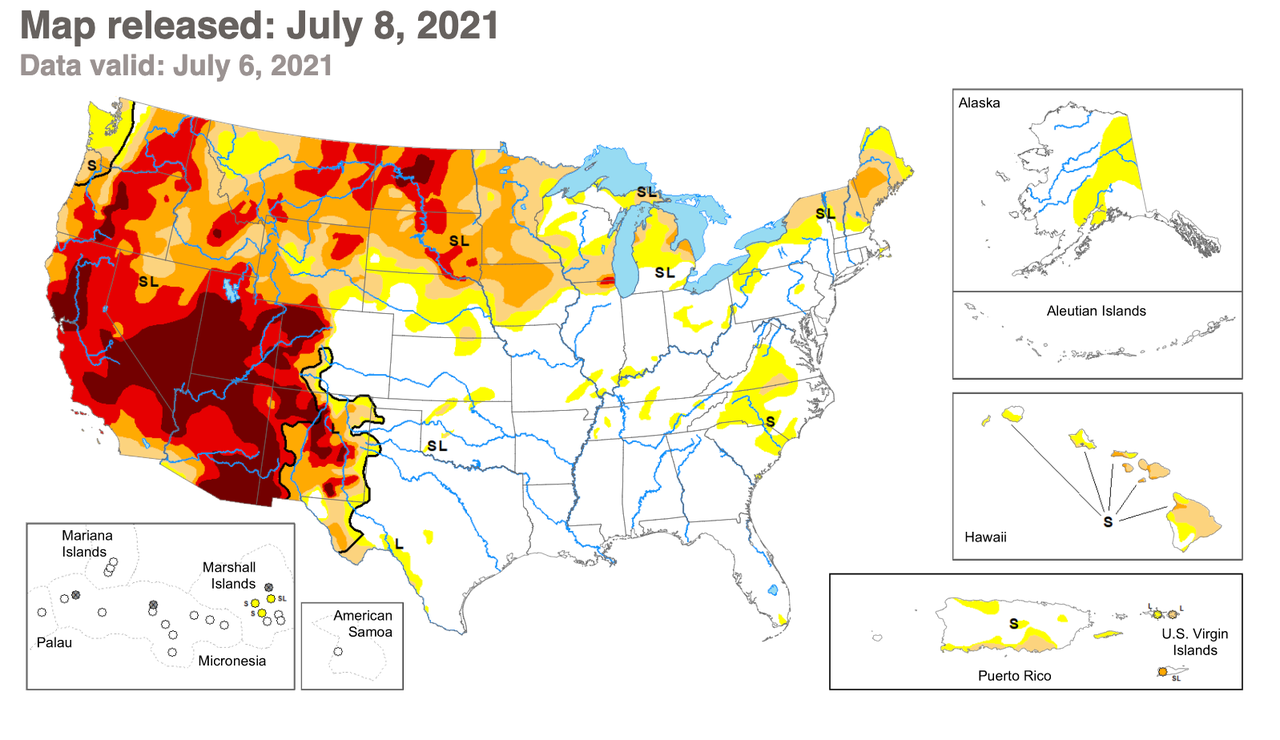
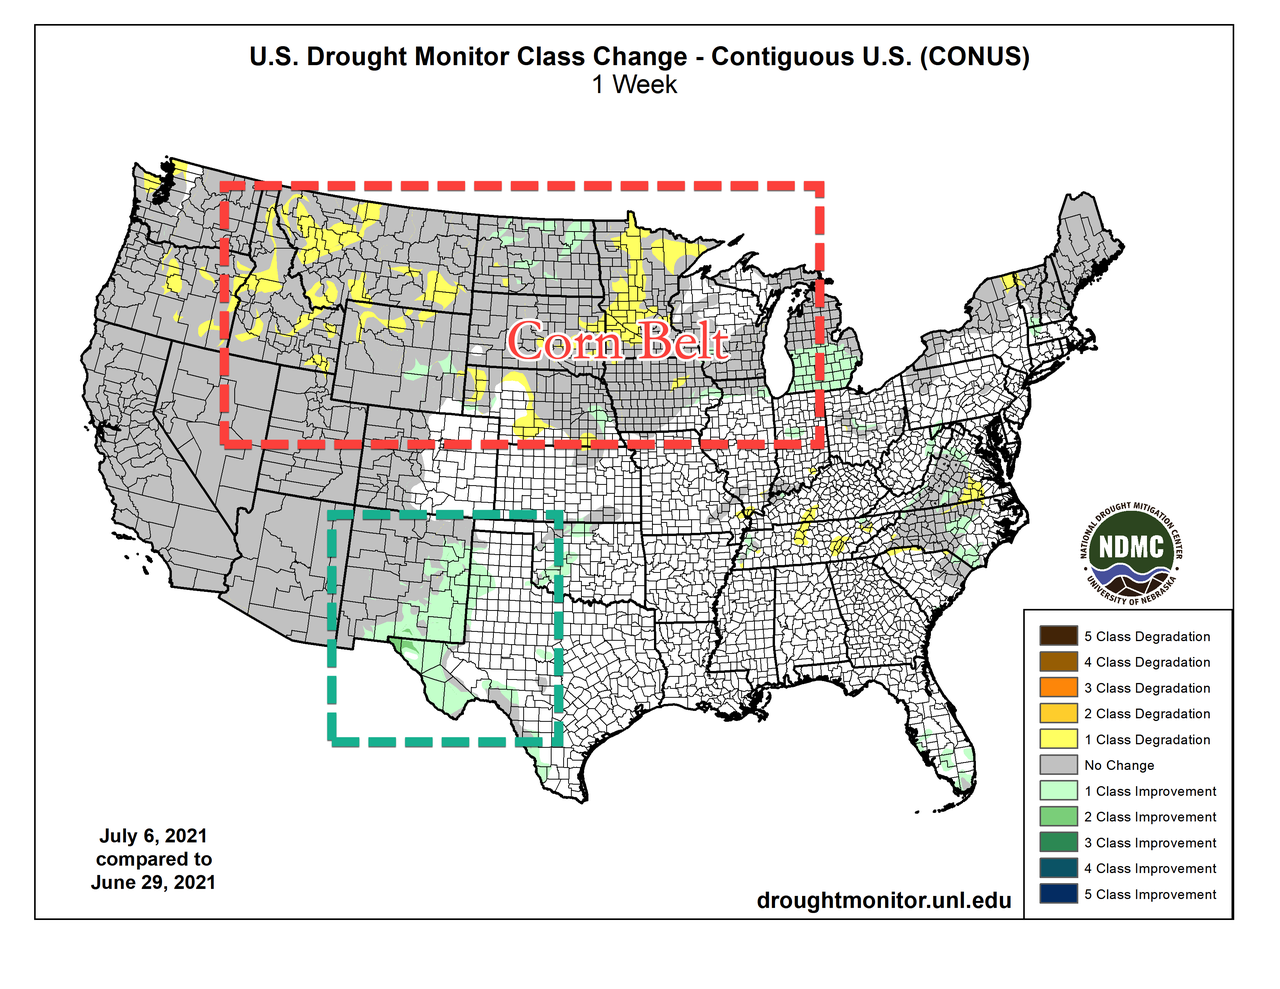
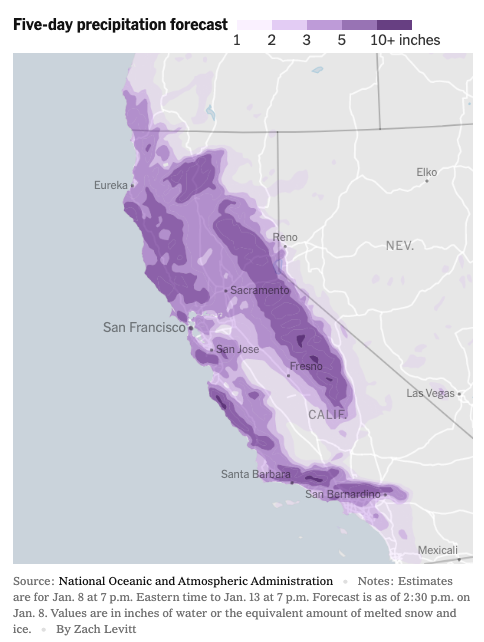
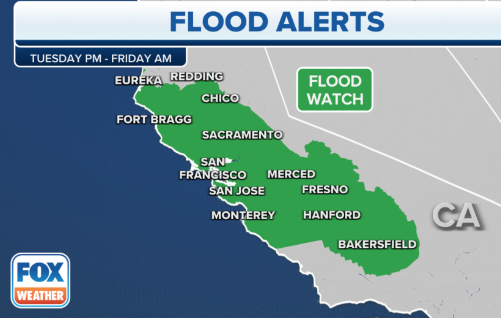
The regional grids with the largest risk of experiencing supply shortfalls this winter are in Texas, New England, the Carolinas and the central system stretching from the Great Lakes region down to Louisiana.

The NERC’s report noted that supply shortfalls, higher peak-demand projections, weaknesses in natural gas infrastructure and inadequate weatherization upgrades for generators are contributing to the heightened risk of power outages.

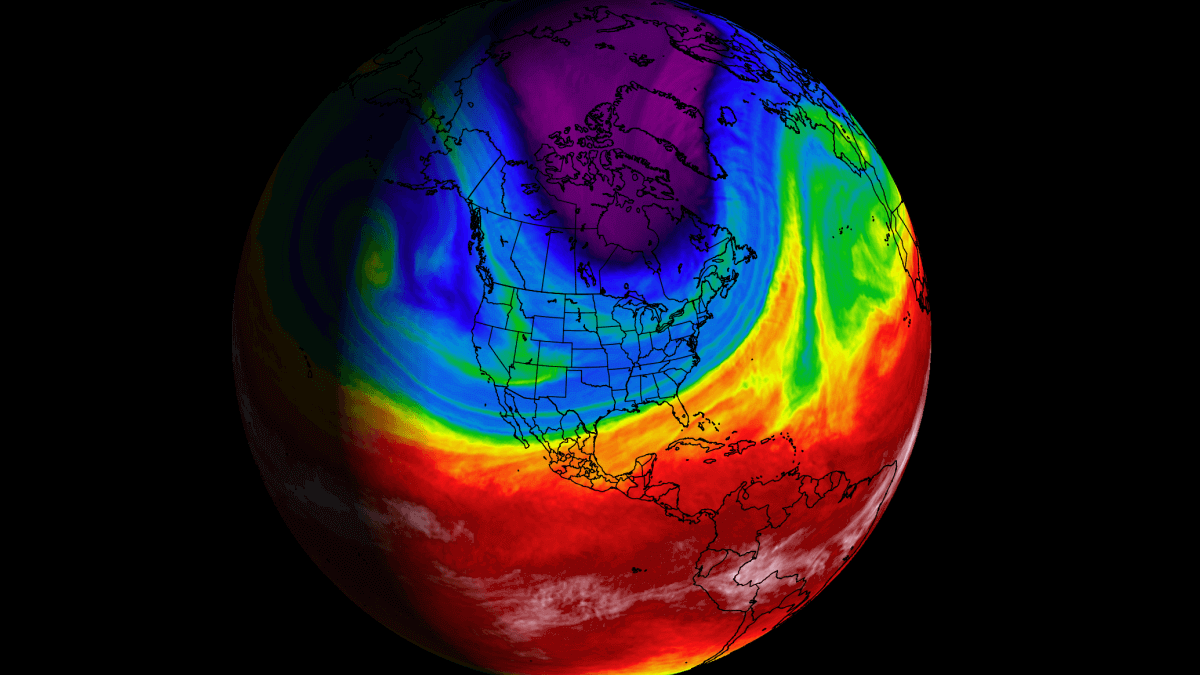
The risk would be further worsened by severe weather putting stress on these already weakened grids by causing demand for electricity to soar while supplies of energy coming from natural gas, coal and backup fuels like oil remain low. (Related: In the middle of a global energy crisis, Joe Biden promises to SHUT DOWN COAL PLANTS all across America.)

“The trend is we see more areas at risk, we see more retirements of critical generation, fuel challenges and we are doing everything we can,” said NERC Director of Reliability Assessment John Moura. “These challenges don’t kind of appear out of nowhere.”

Electricity bills to go up in winter

NERC’s warning for the coming winter notes that around a quarter of American households will also see their already high utility bills soar even higher this winter as demand for power shoots up.

…click on the above link to read the rest…

Weather 2022: New anomalies are growing in the Atmosphere and the Oceans, that will change the weather patterns as we head deeper into the year

Weather 2022: New anomalies are growing in the Atmosphere and the Oceans, that will change the weather patterns as we head deeper into the year

Major changes are coming in 2022 across the atmosphere and the oceans, creating different weather patterns into the second half of the year, and especially in the cold season later in the year. The changes will start slowly, but the main shift will start to occur during the 2022 warm season.

But what exactly is changing this year, and what weather patterns resulted from such changes in the past?

We will go on a weather journey through 2022, starting with a seasonal weather pattern forecast for late winter and early parts of the Spring. From there we will go into the atmosphere and the oceans, to observe what is changing already, and what is yet to come. You will see how and why these global changes occur, and what is going to be different in 2022, compared to the last few years.

weather-forecast-2022-atmosphere-ocean-change-united-states-europe-pressure-temperature-warm-cold-season
ENSO IN THE PACIFIC

We are starting off with the current weather conditions, brought on from the 2021 cold season. Winter is still ongoing and driven largely by a cold ENSO phase.

ENSO is short for “El Niño Southern Oscillation”. This is a large oceanic region in the tropical Pacific, that is regularly changing between warm and cold phases. It has a major impact on the tropical convection patterns (storms), pressure patterns, and thus on the interaction between the ocean and the atmosphere.

We can observe large-scale pressure changes in the tropics as ENSO shifts between warm and cold phases. With some delay, these changes directly affect the circulation over the rest of the world.

…click on the above link to read the rest of the article…

German Cold Blast To Extend Into January Amid Energy Crisis

German Cold Blast To Extend Into January Amid Energy Crisis

A combination of factors creates a perfect storm of turbulence for many Europeans paying some of the highest energy prices ever.

Natural gas stockpiles remain at low levels as gas flows from Europe are depressed. The continuation of cold weather and an energy crunch is expected to further the crisis.

Deutscher Wetterdienst or DWD for short, is the German Meteorological Service. They released new data Friday forecasting month-ahead temperatures will remain below seasonal levels through the third week of January.

Europeans have no relief in sight as natgas stockpiles dwindle and prices hit new record-highs, forcing utility companies who use fossil fuel generators to charge some of the highest power prices ever.

Making matters worse is Germany’s federal network agency, Bundesnetzagentur, announced Thursday that Russia’s Nord Stream 2 pipeline will come online in July. Say goodbye to new supplies as the Dutch month-ahead gas, the European benchmark, continues to soar to new record highs, printing around 139 euros.

We must point out the situation in the US is the complete opposite. Warm weather and ample supplies have depressed natgas prices. However, that could change next month (read: here).

California’s hydroelectric generation affected by historic drought

California’s hydroelectric generation affected by historic drought

Western U.S. drought conditions

Source: U.S. Energy Information Administration, based on U.S. Drought Monitor

Most of the western United States is experiencing intense and historic drought conditions. California is one of the most severely affected states. As of June 22, 2021, 100% of the state is experiencing some degree of drought. About 33% of the state has been categorized under exceptional drought, the most intense drought classification. The drought conditions have affected California’s water supply levels and hydropower plants.

Drought conditions include below-normal precipitation and snowpack accumulation, very dry soil, and higher-than-normal temperatures. These factors lower the water supply available in the summer months.

Mountain snowpack serves as a natural reservoir, providing water throughout the spring and summer as it melts. However, the California snowpack was well below normal this year, and most of it melted quickly because of higher spring temperatures. Measurable snow was present at only 3 of 131 monitoring stations on June 1.

Meltwater from the snowpack often didn’t reach reservoirs in California this year because it was absorbed by drought-parched soil and streams, leaving reservoirs across the state at low levels. Shasta Lake, the largest reservoir in California, is at 48% of its average capacity. Lake Oroville, the second-largest reservoir in the state, is at 40% of its average capacity. Lake Oroville’s water level is expected to fall even lower, which will likely force the Edward Hyatt Power Plant to shut down for the first time since it opened in 1967.

Low water supply can affect hydroelectric generation. California’s previous drought, which lasted from 2012 to 2016, led to significant declines in hydroelectric generation and the state’s first-ever mandatory water restrictions in 2015. As drought conditions eased, hydropower conditions improved.

California monthly electricity generation, by select fuel

Source: U.S. Energy Information Administration, Short-Term Energy Outlook (STEO); U.S. Drought Monitor

…click on the above link to read the rest of the article…

14 Million People Under Flood Warning As Storm Batters Mid-Atlantic

14 Million People Under Flood Warning As Storm Batters Mid-Atlantic

More than 14 million people are under a coastal flood warning early Saturday after heavy rains and strong winds unleashed flooding across the Washington, D.C.-Maryland-Virginia area on Friday.

“The neighbors who have been here a long time say it hasn’t been this high since Isabel, and in their lifetime, that’s the only time it’s been this high,” Baltimore County resident Tyler Fields told WJZ Baltimore. Fields was referring to Hurricane Isabel, which battered the area in 2003.

“While a bulk of the heavy rainfall has concluded, additional rain will track from south to north tonight,” the National Weather Service (NWS) in the Washington-Baltimore region tweeted late Friday. “Additionally, tidal/coastal flooding continues with moderate to major flooding in the forecast! Water levels remain elevated through at least Sat.” 

Along with the rain, strong winds were a significant factor in the flooding, pushing water up the Chesapeake Bay and Delaware Bay, which caused flooding along the coasts of Maryland and Virginia. There were also reports of coastal flooding in Delaware and New Jersey.

Here are some of the key points of the weather event via WaPo:

  • Coastal flooding has resulted in 2 to 4 feet of inundation along the shores of the tidal Potomac River and Chesapeake Bay. In some areas, the highest water levels and most severe coastal flooding are anticipated late Friday night into the predawn hours Saturday at the next high tide. Water levels should gradually fall over the weekend.
  • On Friday afternoon, Old Town Alexandria recorded its third highest tide on record, and highest since 2003.
  • One to two inches of rain fell across the region, with some flooding of small streams. A little more rain is possible this evening before tapering to scattered showers overnight.

…click on the above link to read the rest of the article…

La Niña expected to affect climate around the world by end of year

La Niña expected to affect climate around the world by end of year

Do you wish you had a crystal ball that could tell you what the climate will be next year when you plan your garden? So do many other gardeners (and climatologists). But while there is no magic answer, we do know that in many parts of the United States and other countries, year-to-year climate variability is strongly dominated by what is going on in the eastern tropical Pacific Ocean. This is through a phenomenon called “El Niño Southern Oscillation” or ENSO for short.

Witch Hazel Covered By Snow In The Garden. Hampshire UK. Source: Si Griffiths, Commons Wikimedia

What is ENSO and how does it affect climate?

ENSO has three phases—a cold phase with unusually cold water in the equatorial Eastern Pacific Ocean (EPO) called “La Niña”, a warm phase with unusually warm water in the EPO, and the neutral phase that occurs between the two extreme phases. The ocean see-saws back and forth between the two opposite phases on a semi-regular pattern that usually lasts between two and five years from one El Niño to the next. Sometimes you can have two La Niña years (or even three) back-to-back (the end of 2021 is expected to be a second La Niña in a row), but you almost never have two consecutive years of El Niño.

In many parts of the world, the phase of the ENSO is highly correlated with the climate. Scientists can use that relationship to predict what the climate might be like in the coming months. That is helpful for gardeners who need to know what to expect both next season and next year for planning purposes…

…click on the above link to read the rest of the article…

Counting the Days to Maturity: Calculating planting dates for fall vegetables

Counting the Days to Maturity: Calculating planting dates for fall vegetables

While most of the US is still seeing sweltering hot temps, the cool temps of fall and winter aren’t really all that far away for those of us unlucky (or lucky) enough to not live in a tropical climate.  The tomatoes, peppers, cucumbers, and other warm-season crops planted back at the beginning of summer are still puttering along, even if they might be getting a little long in the tooth and starting to look a little worse for wear ( especially if disease has ravaged them).  For those who aren’t quite done with gardening for the year or who want to reap the bounty of fall crops and get the most out of their production space, fall gardening can be a great tool to extend the garden season.  But knowing when to plant what is tricky, especially when we are talking about different weather patterns and frost dates all around the country.  So a bit of weather data, info from the seed packet or label, a touch of math, and a calendar can be great tools to figure out when you can plant no matter where you are.  Of course if you do live in one of those warmer tropical areas your planting calendar is kind of turned on its head from what us more northern gardeners face. You may prefer to time your planting to avoid high heat.

The first thing to think about is what you can plant.  Cool-season crops such as the Cole crops (cabbage, kale, broccoli, etc.), leafy greens (lettuce, spinach, Bok choi, etc.), root crops (radishes, beets, turnips, scallions), and some cool weather loving herbs like cilantro and parsley are all par for the course for a garden going into cooler fall and winter temps…

…click on the above link to read the rest of the article…

Heat domes, wet spells, and the weather patterns that tie them together

Heat domes, wet spells, and the weather patterns that tie them together

Do you have a favorite kind of weather that you love to experience? For me, it’s the first warm evening of spring, when the air is just warm enough and the wind just strong enough for the air to feel as though it is dripping off my fingers. On nights like that, I can tell that the air really is a fluid, the topic of this week’s blog.

The wind of spring, Toshihiro Oimatsu via Commons Wikimedia

What causes atmospheric weather patterns?

You may have noticed this year that the weather patterns across both the United States and Europe have been very persistent. That has led to the occurrence of record-setting high temperatures in some locations like the Pacific Northwest and the central US and southern Europe as well as day after day of rain in the Southeastern US. Both of these weather patterns have caused no end of grief for gardeners and farmers, since weather is seldom stuck on day after day of “perfect” conditions (even if you could define what those are).

To understand how weather patterns get stuck, it helps to know how the air moves through the atmosphere. Wind is driven by differences in heating between two areas. That contrast leads to differences in density and pressure between the areas, and the air flows from higher pressure to lower pressure to try to equalize the amount of air between those areas. The large-scale weather patterns across the globe are caused by differences in the sun heating the spherical earth at the equator and at the poles at different angles due to latitude. There are also smaller-scale wind circulations due to differences in heating between land and water (oceans or lakes) that cause the same movement of air molecules…

…click on the above link to read the rest of the article…

Dry Corn Belt Ahead Of Pollination May Spell Disaster For Farmers

Dry Corn Belt Ahead Of Pollination May Spell Disaster For Farmers

Kirk Hinz, a meteorologist with BAMWX, published an agriculture note Thursday which outlines “persisting rains” in some parts of the Southwest but “expanding dryness” in the north.

Hinz concentrates on the corn belt, which spans the Midwest. He said, “expanding drought into a crucial time of the year ahead of pollination.” This means that persistent dry conditions could affect pollination success – and if pollination is not successful this year because of drought and lack of water, then harvest yields this season could come under pressure.

“A lack of consistent rainfall across a big chunk of the US major corn production areas in the Midwest and northern Plains this year continues, with the expanding drought into a crucial time of the year ahead of pollination as well. Weather models have remained volatile recently in regards to how much of these major production areas will receive timely rainfall, but the trend recently has been to push previously forecast widespread nourishing rains further south that’s starting to be a growing concern (plus more heat building back in a mid-to-late month) ahead,” Hinz wrote. 

Here’s what happens to corn if pollination is unsuccessful. 

Here’s the US Drought Monitor, which shows much of the Western US is in some form of drought.

Some rain relief was seen in the week ending June 6, but worsening conditions continue in the corn belt (or Midwest area).

For the four weeks ending June 6, rains increased in west Texas and east New Mexico but expanding dryness in the corn belt.

Over the last two months ending June 6, significant increases in precipitation have been seen from Texas to New Mexico up into Colorado. However, most of the corn belt continues to experience worsening droughts.

…click on the above link to read the rest of the article…

Heat Wave!

Heat Wave!

 Find your sunglasses.  Stock up on sunscreen.  And get your shorts and tee shirts out.  You will need them.   A Northwest spring heatwave is about to begin.  

The start to spring has been chilly and damp, but that will be a distant memory by this week.   Consider the latest ensemble forecast (running the model many times, each a bit different) for the NOAA/NWS GFS forecast system (see below). Steadily rising temperatures from the low 60s today to the mid-70s on Saturday and Sunday.

The ensemble members are all very similar, which means we should have confidence in the prediction.

I know your next question.  What about the highly skillful European Center forecasts?  Here they are (below).  Highs of 74 and 73 on Saturday and Sunday, followed by a cool down next week.
What do we owe this turn to torrid conditions? 
A very high amplitude upper-level ridge of high pressure over the eastern Pacific.   The forecast of upper-level (500 hPa, around 18,000 ft) conditions at 5 PM Wednesday, shows the upper-level ridge extended into BC, with troughs (the L’s) on both sides.  This is known as an OMEGA block, because it looks like the Greek letter omega.  Very persistent.
And by Friday afternoon the ridge of high pressure amplifies right over us.  Such high-pressure areas are associated with sinking air (therefore cloud-free) and warming conditions aloft.  At the same time, there is easterly or offshore flow at low levels, which isolates us from the cool Pacific Ocean.
To really warm you up, let me show you the predicted air temperatures just above the surface (2-meters).
The forecast for Wednesday at 5 PM, shows temperatures rising into the mid-60s on both sides of the Cascades, with moderate northerly and northeasterly winds
…click on the above link to read the rest of the article…

Record Warmth In Plains, Midwest?; NYC To Top 60s This Week 

Record Warmth In Plains, Midwest?; NYC To Top 60s This Week 

About ten days ago, we penned a weather note to readers titled “”Early Spring, Winter Is Over?” – New Weather Models Suggest Warmer Weather Nears,” outlining how after a polar vortex split poured Arctic air into much of the US, wreaked havoc on power grids, but there was light at the end of the tunnel as the first half of March would expose much of the country to warmer weather trends.

Well, eight days into March and more than 100 million Americans across the Southwest, West Central, East Central, Southeast, Mid-Atlantic, and Northeast will experience warmer than average temperatures this week.

“The ridge of high pressure over the East will allow southerly winds to spread spring warmth northward and influence conditions for most areas east of the Rockies. Meanwhile, cooler than average temperatures will develop in the West, particularly in the Southwest,” according to The Weather Channel

The mild setup for this week is a relief from last month. Highs could be 10 to 25 degrees above average in the East, except for Florida, by Tuesday. By Wednesday, most parts of the Northeast could be in the 60s.

Here are some of the forecasted temperature highs this week for major metro areas. By mid-late week, NYC could be averaging in the mid-60s.

“High temperatures will be 20 to 35 degrees above average from the Northern and Central Plains into the Great Lakes region through Wednesday. Highs in the 60s and 70s are anticipated with 50s toward the Canadian border. Temperatures near 80 are even possible in parts of the Central Plains,’ The Weather Channel said. 

Temperature anomalies show the widespread warming that will affect more than 100 million people.

Could the US planting season begin earlier this year with warming trends?

NYMEX Henry Hub Natural Gas futures blew through the 2.70 support level.

The warmer weather is expected to last through Mar. 15, with slightly colder temperatures afterward. At this point, Americans will take any warm weather as the tail end of winter has been miserable. 

Olduvai IV: Courage
Click on image to read excerpts

Olduvai II: Exodus
Click on image to purchase

Click on image to purchase @ FriesenPress