Home » Posts tagged 'toronto'

Tag Archives: toronto

Olduvai
Click on image to purchase

Olduvai III: Catacylsm
Click on image to purchase

Post categories

Post Archives by Category

Protests in Canada – Interesting Approach


The Most Splendid Housing Bubbles in Canada Deflate Further

The Most Splendid Housing Bubbles in Canada Deflate Further

Vancouver prices drop. Toronto down 3.7% from peak, flat for 10 months. Winnipeg plunges most since at least 1990. Quebec City flat for 6 years.

In Greater Vancouver, BC, Canada, house prices fell 0.4% in April from March, the ninth month in a row of month-to-month declines, according to the Teranet-National Bank House Price Index. The index is down 4.7% from the peak in July 2018, the sharpest nine-month decline since July 2009. And it’s down 2.8% from April last year. One of the most splendid housing bubbles in the world is now deflating before our very eyes, after prices had skyrocketed 316% from January 2002 to the peak in July 2018 – meaning prices had more than quadrupled in 16 years:

The Teranet-National Bank House Price Index tracks single-family house prices, based on “sales pairs,” comparing the sales price of a house in the current month to the last sale of the same house years earlier (methodology). Using “sales pairs” eliminates the issues that affect median and average price indices but has its own limitations. These median and average house prices, which are much more volatile, are now showing much sharper price declines for Vancouver.

Because the Teranet index uses a similar methodology of “sales pairs” as the S&P CoreLogic Case Shiller index for US housing markets, the indices produce comparable metrics. So let’s compare Vancouver’s housing bubble to the also deflating housing bubble in the San Francisco Bay Area. Splendid v. Splendid. The chart below shows the data of Vancouver (black columns) and San Francisco (red columns), with both indices converted into “percent change from January 2002.”

As the chart above shows, Vancouver’s housing market dipped briefly during the Financial Crisis while San Francisco’s market went into a hard four-year downturn, as the US housing bust morphed into the Mortgage Crisis that contributed to the Financial Crisis.

 …click on the above link to read the rest of the article…

Toronto Will Explore Suing Big Oil for Climate Costs

Toronto Will Explore Suing Big Oil for Climate Costs

Toronto will consider suing oil companies for climate damages

Toronto could be the next major city to file a climate liability suit to recoup climate costs from the fossil fuel industry. Photo credit: City of Toronto  

Toronto became the latest city to explore possible litigation to make fossil fuel companies pay for the costs of climate change, joining an accountability movement spurred by cities in North America.

The city council’s Infrastructure and Environment committee passed a motion on Thursday that had been filed by City Councillor Mike Layton in March. It directs the city to consider suing greenhouse gas emitters for billions of dollars in adaptation and repairs cost to confront the challenges of increasing extreme weather events, like the floods that swept the city in 2013, and other climate impacts. 

“It had gotten to a point where it was kind of a white noise in the background, ‘Yes, we have to do something about climate change.’ It became so abstract. And then it all changed when I had kids and started realizing that we’re actually running out of time,” Layton said during a debate preceding the vote.

Layton said climate change will present the city with budget challenges in the years to come. 

”We have to make sure that those that are profiting pay their fair share,” he said.

The motion asks the city staff to report back to the city council about the cost of making the city resilient to extreme weather events, which have grown more frequent and more damaging with rising global temperatures. The city can then seek compensation for those costs in litigation.

“For decades and decades, there has been an industry that has been made out of blurring the line between greenhouse gasses, fossil fuels and climate change—much like they tried to blur the line between cancer and smoking,” Layton said.

 …click on the above link to read the rest of the article…

Toronto Home Prices Just Plunged At A Rate Not Seen Since 1996

A seismic shift is currently underway in the Toronto real estate market which may have finally pricked Canada’s biggest bubble. In October, home prices plunged at the fastest pace in more than two decades, according to new data published by Statistics Canada.

Statistics Canada’s Price Index for new Toronto homes declined 1.4% in October from a year earlier, the most since September 1996. Across all provinces and territories, home prices increased 0.1%, the slowest pace since 2010, which signals the country’s real estate market has stalled and could reverse into 2020.

The pace of new home construction crashed by a massive 40.3% in the Greater Toronto Area between October 2017 and October 2018.

Bloomberg describes the turning point in the real estate market as a result of government measures, introduced in 2017 to help cool the city’s red-hot housing market, such as tighter mortgage lending laws.

“The Bank of Canada also raised its trend-setting interest rate five times between July 2017 and October of this year,” notes Bloomberg.

“New home prices were advancing at an annual pace of almost 4% late last year before the mortgage rules took effect.”

Further, the current economic backdrop suggests storm clouds are gathering across the country. Last week, the Canadian 2 and five year bond yields inverted, for the first time since 2007.

“This is often taken as a signal that investors are more optimistic about short-term prospects versus the long term, suggesting a lack of confidence in continued economic growth. This can also impact bank profitability, as banks pay short-term rates on deposits and take in long-term rates on loans. A flat or inverted yield curve, therefore, could lead to negative net interest margins,” said Steve Saretsky of VancityCondoGuide.

As Saretsky shows, this can cause bank lending to further tighten, leaving borrowers high and dry when market liquidity is most needed.

…click on the above link to read the rest of the article…

“Colonizing Experiment in Surveillance Capitalism”: Privacy Expert Resigns From Google-Backed Smart City Project Over Surveillance Concerns

A privacy expert tasked with protecting personal data within a Google-backed smart city project has resigned as her pro-privacy guidelines would largely be ignored by participants.

“I imagined us creating a Smart City of Privacy, as opposed to a Smart City of Surveillance,” Ann Cavoukian, the former privacy commissioner of Ontario, wrote in a resignation letter to Google sister company Sidewalk Labs.

“I felt I had no choice because I had been told by Sidewalk Labs that all of the data collected will be de-identified at source,” she added.

Cavoukian was an acting consultant involved in the plan by Canada’s Waterfront Toronto to develop a smart city neighborhood in the city’s Quayside development. She had created an initiative called Privacy by Design that aimed to ensure citizens’ personal data would be protected.

Once it became apparent that citizen privacy could not be guaranteed, Cavoukian decided it was time to leave the project:

But then, at a Thursday meeting, Cavoukian reportedly realized such anonymization protocols could not be guaranteed. She told the Candian news outlet that Sidewalk Labs revealed at that meeting that their organization could commit to her guidelines, but other involved groups would not be required to abide by them.

Cavoukian realized third parties could possibly have access to identifiable data gathered through the project. “When I heard that, I said, ‘I’m sorry. I can’t support this. I have to resign because you committed to embedding privacy by design into every aspect of your operation,’” she told Global News. – Gizmodo

Being touted as “the world’s first neighborhood built from the internet up,” the Google designed smart city is set to deploy an array of cameras and sensors that detect pedestrians at traffic lights or alert cleanup crews when garbage bins overflow, reports The Globe and Mail.

…click on the above link to read the rest of the article…

CMHC Finds Irrational Exuberance in Vancouver & Toronto

There is much to learn from financial mania’s. In particular, the role of human behaviour responsible for inflating asset prices to previously unimaginable heights. Economist Robert Schiller has done some excellent work on this topic in his book Irrational Exuberance.

In essence, Schiller highlights a few key themes. Mainly that real estate booms seem just as mysterious and hard to understand as the stock market booms when they happen, there are always popular explanations for them- explanations that are not necessarily correct, but people love a good story. Meanwhile, higher prices tend to drive a positive feedback loop where initial price increases lead to more price increases as the effects of the initial price increases feedback into yet higher prices through increased investor demand. This second round of price increases feeds back again into a third and then a fourth round, and so on.

A recent publication from CMHC highlights strong human behaviour dynamics have been playing out in the Vancouver & Toronto Real Estate markets. After surveying 30,000 recent homebuyers, CMHC found evidence of euphoric and perhaps irrational behaviour.

For instance, respondents were asked about whether how much they paid was aligned with their plan budget. Respondents were also asked about a series of choices regarding location, size and timing of purchase. Choices all potential homebuyers must consider before buying a home in both Vancouver and Toronto, 48% of homebuyers respectively spent more than they budgeted.

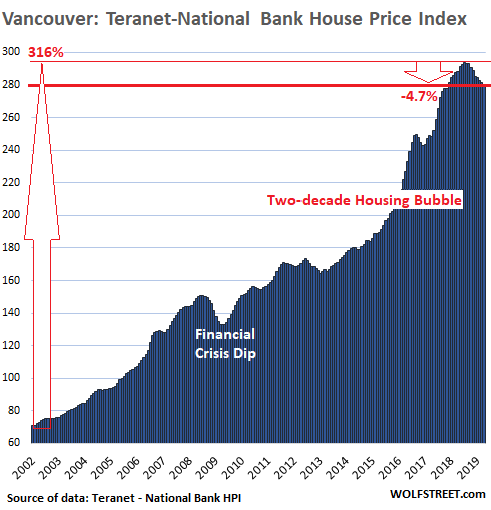
CMHC believes home buyers may have experienced a fear of missing out, citing that homebuyers measure the value of a home through rule of thumb mechanisms like, “it’s a hot market, I can’t miss out, it’s really tight right now-will have to revise our budget if we want to get in”  all of which are phrases pushing homebuyers to overvalue an investment.

…click on the above link to read the rest of the article…

CMHC: 55% Of Toronto And Vancouver Real Estate Buyers Were In A Bidding War

CMHC: 55% Of Toronto And Vancouver Real Estate Buyers Were In A Bidding War

Have you ever woke up after a night of drinking, and only had a vague recollection of what happened? Then your responsible friend sets off a chain of text messages, trying to figure out where you went wrong? Well that’s what the Canadian real estate industry just did, and man-o-man did people screw up. The Canada Mortgage and Housing Corporation (CMHC), the Crown corporation in charge of mortgage liquidity, conducted a massive survey of recent buyers in Toronto, Vancouver, and Montreal. After getting drunk on exuberance, buyers indulged in a little too much borrowing, blaming everything from land scarcity to foreign buyers for the street fights bidding wars they entered.

About The Survey

The CMHC designed a massive survey to try and figure out where buyer exuberance started. Buyers in Toronto and Vancouver saw a quick rise in home prices, and adopted “excessive” expectations of price growth. To determine where the disconnect between fundamentals and price growth started, they took a novel approach – they asked the buyers. 30,000 recent buyers were sent surveys, asking questions ranging from what their budgets were, to why they didn’t stick to their budget.

The majority of price movements were driven by exuberance in Toronto and Vancouver. Yes, fundamentals played a part – but a small part. Instead, the survey focuses on finding out which data points buyers felt drove their FOMO. The fear of being “locked out” is always a powerful motivator, which tends to amplify the read on fundamentals.

Now, issues like foreign buyers are important, and need to be tracked and dealt with. However, no one forced anyone to buy in the small window of exuberance. The homeowner life didn’t choose these buyers, buyers chose the homeowner life.

…click on the above link to read the rest of the article…

Loonie Tumbles After Ugly Canadian Data: Worst Toronto Retail Sales In 3 Years

The synchronized economic slowdown has hit again, this time striking America’s latest trade war opponent, Canada, which moments ago reported some very ugly inflation and retail sales data.

First, on the inflation front, Canadian CPI rose just 2.2% in May from 2.1% in April, badly missing what Wall Street estimated would be an increase to 2.6% due to higher gasoline prices. According to Statistics Canada, the largest upside contributor to the inflation print was the recreation, education category, 0.27 percentage points, while the largest downside contributor was the household operations category, -0.12 percentage points.

Broken down by the various CPI metrics, the data was as follows:

  • The average of CPI core measures was 1.90% y/y in May from 1.97% a month earlier
  • CPI-common at 1.9% y/y in May from 1.9% in previous month
  • CPI-median at 1.9% y/y in May from 1.9% in previous month
  • CPI-trim at 1.9% y/y in May from 2.1% in previous month

The retail sales data was even worse, with the headline number tumbling -1.2% in April, well below not only the consensus estimate of an unchanged print , but also below the lowest end of the forecast range which was -0.4% to 0.2%. Core retail sales, ex-autos, also missed, falling 0.1% in April, est. +0.5%

Just like in the US, a big contributor to the miss appears to be the rise in e-commerce, with online sales of C$1.33B in April, up 8.8% from a year earlier and representing 2.7% of total retail sales.

Broken down by region, there was weakness all round, however Toronto was an outlier, with retail sales falling most since Jan. 2015. Poor weather weather may have hurt retail sales.

  • Toronto retail sales -2.9% m/m
  • Montreal retail sales -2.60% m/m
  • Vancouver retail sales +0.2% m/m

Following the data, the Canadian loony tumbled by 100 pips, with the USCAD rising from 1.327 to 1.337, before regaining some losses.

Toronto’s House Price Bubble Not Fun Anymore

Toronto’s House Price Bubble Not Fun Anymore

Average price of single-family house plunges 13%, or by C$160,000 from peak. Sales of homes priced over C$1.5 million collapse by 63%. Condos still hanging on.

Housing in the Greater Toronto Area is, let’s say, retrenching. Canada’s largest housing market has seen an enormous two-decade surge in prices that culminated in utter craziness in April 2017, when the Home Price Index had skyrocketed 32% from a year earlier. But now the hangover has set in and the bubble isn’t fun anymore.

Home sales plunged 22% in May compared to a year ago, to 7,834 homes, according to the Toronto Real Estate Board (TREB). It affected all types of homes, even the once red-hot condos:

  • Detached houses -28.5%
  • Semi-detached houses -29.4%
  • Townhouses -13.4%
  • Condos -15.5%.

It was particularly unpleasant at the higher end: Sales of homes costing C$1.5 million or more plummeted by 46% year-over-year to 508 homes in May 2018, according to TREB data. Compared to the April 2017 peak of 1,362 sales in that price range, sales in May collapsed by 63%.

But it’s not just at the high end. At the low end too. In May, sales of homes below C$500,000 – about 68% of them were condos – fell by 36% year-over-year to 5,253 homes.

The TREB publishes two types of prices – the average price and its proprietary MLS Home Price Index based on a “composite benchmark home.” Both fell in May compared to a year ago.

The average price in May for the Greater Toronto Area (GTA) fell 6.6% year-over-year to C$805,320, and is now down 12.3%, or an ear-ringing C$113,000, from the crazy peak in April 2017.

There are no perfect measures of home prices in a market. Each has its own drawbacks. Average home prices can be impacted by the mix and by a few large outliers – but over the longer term, it gives a good impression of the direction. The chart below shows the percentage change in average home prices in the GTA compared to a year earlier:

…click on the above link to read the rest of the article…

Toronto’s Splendid Housing Bubble Turns to Bust

Toronto’s Splendid Housing Bubble Turns to Bust

Market freezes up at the top. Average price of detached house plunges C$175,000 in 12 months.

Home sales in the Greater Toronto Area (GTA), Canada’s largest housing market, and among the most inflated in the world, plunged 32% in April, compared to a year ago, to 7,792 homes, according to the Toronto Real Estate Board (TREB), a real estate lobbying group. The sales plunge affected all types of homes, even the once red-hot condos:

  • Detached houses -38.4%
  • Semi-detached houses -29.3%
  • Townhouses -22.1%
  • Condos -26.0%.

The sales slowdown was particularly harsh at the higher end: Sales of homes costing C$2 million or more collapsed by 64%. The market is freezing up at the top.

Prices follow volume. Both types of prices the TREB publishes – the average price and its proprietary MLS Home Price Index based on a “composite benchmark home” – fell from April last year. This is a confusing experience for the real estate industry, sellers, and buyers, since prices have ballooned for 18 years, interrupted by only one brief dip during the Financial Crisis, and the rule has been that prices will always go up and that you cannot lose money in real estate.

The average price in April for the Greater Toronto Area (GTA) plunged 12.3% year-over-year to C$804,584. A drop of C$113,600. By market:

  • In Toronto itself: -8.2% (-C$76,860) to C$865,817.
  • In the rest of the GTA without Toronto: -15.2% (-C$137,070) to C$767,359.

Detached houses – which are generally more expensive than other home types – got hit the hardest:

  • Detached houses -14.4% to C$1,030,103 (down by C$175,000)
  • Semi-detached houses -6.4% to C$792,385
  • Townhouses -7.8% to C$645,172
  • Condos +3.2% to C$559,343

While Condo prices still gained 3.2%, that gain was down from a 6.1% gain in March, and down from double-digit gains earlier.

…click on the above link to read the rest of the article…

Canada Home Prices Fall from Year Ago for First Time since 2009

Canada Home Prices Fall from Year Ago for First Time since 2009

The magnificent house price bubble wheezes.

With 2017 mortgage pre-approvals having now expired, the first wave of buyers facing OSFI’s ground breaking mortgage regulations are being put to the test. The regulations, also known as B-20, require all borrowers to pass a stress test at an interest rate 2% higher than the qualifying rate.

Early symptoms appear rather obvious. National home sales slid for the month of March, falling 23% year over year, and pushing the average sales price down 10%. Overall, it was a bearish quarter for Canadian housing, first quarter sales fell 16% year over year.

Much of the declines were felt in the single family housing market in Vancouver & Toronto, with many buyers unable to qualify at the recently inflated prices. The average sales price of a single family home in Greater Vancouver now sits at C$1.6 million and C$1 million in the Greater Toronto Area (GTA).

Chief economist of the Canadian Real Estate Association, Gregory Klump, noted the squeeze as “tighter mortgage lending rules, which make it harder for home buyers to qualify for uninsured mortgages, are also shrinking the pool of qualified buyers for higher-priced homes.”

To little surprise this reflected in the national home prices across Canada. The Q1 2018 average sales price declined by 6.27% from Q1 2017. It was the first year-over-year percentage decline since Q1 2009.

The impact of the mortgage stress could become more apparent moving forward, particularly if borrowing rates continue to rise. As of today, a homebuyer hoping to purchase the typical home in Greater Vancouver (as per the MLS benchmark price of C$1.084M) would require a minimum down-payment of C$216,800 and a verified income of C$175,000, assuming a 5-year mortgage at a generous 2.99% interest rate.

…click on the above link to read the rest of the article…


Toronto’s Epic Housing Bubble Turns to Bust

Toronto’s Epic Housing Bubble Turns to Bust

Prices of detached houses plunge C$207,000 from a year ago as sales collapse.

After having ballooned for 18 years with barely a dip during the Financial Crisis, Toronto’s housing market, Canada’s largest, and among the most inflated in the world, is heading south with a vengeance, both in terms of sales volume and prices, particularly at the high end.

Home sales in the Greater Toronto Area (GTA) plunged 39.5% in March compared to a year ago, to 7,228 homes, according to the Toronto Real Estate Board (TREB), the local real estate lobbying group. This was spread across all types of homes, even the formerly red-hot condo sector:

  • Detached houses -46.3%
  • Semi-detached houses -30.6%
  • Townhouses -34.2%
  • Condos -32.7%.

While new listings of homes for sale fell 12.4% year-over-year, at 14,866, they’d surged 41% from the prior month, and added to the listings of homes already on the market. The total number of active listings – new listings plus the listings from prior months that hadn’t sold or been pulled without having sold – more than doubled year-over-year to 15,971 homes, and were up 20% from February.

At the current sales rate, total listings pencil out to a supply of 2.1 months. The average days-on-the-market before the home is sold or the listing is pulled without having sold doubled year-over-year to 20 days. Both data points show that the market is cooling from its red-hot phase, that potential sellers aren’t panicking just yet, and that potential buyers are taking their time and getting more reluctant, or losing their appetite altogether, with the fear of missing out (FOMO) having evaporated.

Sales volume has been plunging for months while listings of homes for sale have also surged for months. Prices follow volume, and prices have been backing off, but in February they actually fell on a year-over-year basis, the first since the Financial Crisis, and in March, they fell more steeply. This is what the report called a “change in market conditions.”

…click on the above link to read the rest of the article…

Home Prices Sink, Sales Plunge in Toronto

Home Prices Sink, Sales Plunge in Toronto

Homeowners who bought a year ago are down C$110,000 on average. 

Home sales in the Greater Toronto Area, Canada’s largest housing market, plunged 35% in February compared to a year ago, to 5,175 homes. The plunge in volume was spread across all types of homes. Even the previously white-hot condo sector froze over:

  • Detached houses -41.2%
  • Semi-detached houses -28.7%
  • Townhouses -26.8%
  • Condos -30.8%.

New listings of homes for sale rose 7% year-over-year to 10,520, according to the report by the Toronto Real Estate Board (TREB). The total number of active listings of homes for sale – which includes the new listings and the listings from prior months that hadn’t sold – skyrocketed 147% year-over-year to 13,362 homes.

At the current sales rate, total listings signify a supply of 2.5 months, which indicates that the housing market isn’t exactly drowning in listings, but the heat has burned out.

This is confirmed by the average days on the market before the home is sold or the listing is pulled: at 25 days, it was still relatively low, but it had nearly doubled from 13 days in February a year ago when the market was approaching its April apogee.

The plunge in sales volume, which has been going on for months, and the surge in listings signify that the market is in the process of changing direction. Housing markets move very slowly, over years, and not minutes. But prices are now following the decline in volume.

The average price for the Greater Toronto Area (GTA) plunged 12.4% overall to C$767,818. This represents a drop of about C$110,000 in the average home price over the 12-month period.

It split up this way:

  • City of Toronto: -6.1% to C$806,494.
  • Rest of the GTA without Toronto: -16.1% to C$743,196.

…click on the above link to read the rest of the article…

Real Estate Bubbles: These 8 Global Cities Are At Risk

If you had $1 billion to spend on safe real estate assets, where would you look to buy?

For many funds, financial institutions, and wealthy individuals, the perception is that the world’s financial centers are the places to be. After all, world-class cities like New York, London, and Hong Kong will never go out of style, and their extremely robust and high-density city centers limit the supply of quality assets to buy.

But, as Visual Capitalist’s Jeff Desjardins asks, what happens when too many people pile into a “safe” asset?

According to UBS, certain cities have seen prices rise at rates that are potentially not sustainable – and eight of these financial centers are at risk of having real estate bubbles that could eventually deflate.

Global Real Estate Bubble Index

Every year, UBS publishes the Global Real Estate Bubble Index, and the most recent edition shows several key markets in bubble territory.

The bank highlights Toronto as the biggest potential bubble risk, noting that real prices have doubled over 13 years, while real rents and real income have only increased 5% and 10% respectively.

However, the largest city in Canada was certainly not the only global financial center with real estate appreciating at rapid rates in the last year.

In Munich, Toronto, Amsterdam, Sydney and Hong Kong, prices rose more than 10% in the last year alone.

Annual increases at a 10% clip would lead to the doubling of prices every seven years, something the bank says is unsustainable.

In the last year, there were three key markets where prices did not rise: London, Milan, and Singapore.

London is particularly notable, since it holds more millionaires than any other city in the world and is rated as the #1 financial center globally.

Rate Squeeze in Vancouver & Toronto Housing Bubbles

Rate Squeeze in Vancouver & Toronto Housing Bubbles

Variable-rate mortgages, the HELOC phenomenon, and new stress tests meet higher rates.

The Bank of Canada raised interest rates another 25 basis points last week. It was the third time in the past six months. Rates have more than doubled in that time, going from 0.50% to 1.25%. This hike was baked into the economic data, and now it’s getting baked into the debt loads of Canadian households.

Following the announcement, Canadian banks hiked their prime lending rateby an equivalent 25 basis points. The prime lending rate is the annual interest rate Canada’s major banks use to set interest rates on variable-rate loans, lines of credit, variable-rate mortgages, and HELOCs (Home Equity Lines of credit).

This means nearly instantly higher interest payments for borrowers carrying variable-rate mortgages, HELOCs, and lines of credit.

This is critically important, considering the context of the current situation. Interest rates have been at historically low emergency levels since the Financial Crisis. This has allowed households to absorb elevated house prices and a record amount of debt. Each rate hike reduces the ability to service that debt.

Given the current size of the mortgages, for Vancouver households, a 1% rate increase in their variable mortgage rate would require an additional 9.2% of their income to make the payment, according to Better Dwelling, and for households in Toronto, it would require an additional 8.3% of their household income. In Montreal, it would require an additional 3.2% of their household income:

Further, the newly required stress tests for variable-rate mortgages require that applicants qualify at the minimum specified rate of the stress test, which just jumped from 4.99% to 5.14%, or at the actual rate they’re borrowing at PLUS 2%, whichever is greater.

…click on the above link to read the rest of the article…

Olduvai IV: Courage
Click on image to read excerpts

Olduvai II: Exodus
Click on image to purchase

Click on image to purchase @ FriesenPress