Home » Posts tagged 'rig count'

Tag Archives: rig count

Olduvai
Click on image to purchase

Olduvai III: Catacylsm
Click on image to purchase

Post categories

Post Archives by Category

Sharp Rise In Rig Count Pressures Oil Prices

Sharp Rise In Rig Count Pressures Oil Prices

Pioneer rig

The the number of active oil and gas rigs rose by 19 after two weeks of big losses in the United States this week according to Baker Hughes, in a sign that US production is still set for increases.

The total number of active oil and gas drilling rigs rose by 20 rigs­ according to the report with the number of active oil rigs gaining 15 to reach 831 and the number of gas rigs gaining 4 to reach 194.

The oil and gas rig count is now just 22 up from this time last year, with oil seeing just a 23-rig increase year on year, gas rigs holding flat, and miscellaneous rigs seeing a 1-rig decrease for the year.

Oil prices were trading up earlier on Friday leading up to the data release as early figures came in for OPEC’s March oil production from S&P Platts, which showed that its oil production had fallen by 570,000 barrels per day from February levels as Venezuela and Saudi Arabia saw steep declines in production levels.

WTI was trading up $0.49 (+0.79%) at $62.59—well above the psychologically important $60 per barrel mark. The Brent benchmark was trading up $0.48 (+0.69%) at $69.88 at 12:18pm EST, after easing off the $70 per barrel mark earlier this week. Prices for both represent a significant gain week on week. Related: Is This The End Of Colorado’s Shale Boom?

Despite the drop off in the number of active rigs, US crude oil production for week ending March 29 was 12.2 million barrels—another new all-time high.

Unlike in the United States, Canada saw a decline in the number of active rigs this week.

 …click on the above link to read the rest of the article…

Slipping Rig Count Can’t Keep Oil Prices From Falling

Slipping Rig Count Can’t Keep Oil Prices From Falling

BHGE rig

Baker Hughes reported a 4-rig decrease for oil and gas in the United States this week—a loss in rigs for the third week in a row. The four-rig decline was all on the oil-rig side, with gas rigs holding steady.

The total number of active oil and gas drilling rigs now stands at 1,071 according to the report, with the number of active oil rigs decreasing by 4 to reach 873 and the number of gas rigs holding steady at 198.

The oil and gas rig count is now 141 up from this time last year, 126 of which is in oil rigs.

Crude oil prices fell sharply near the close of the week on Friday despite production losses in OPEC’s Libya and an agreement within OPEC+ to cut 1.2 million bpd from the expanded cartel’s October production.

The WTI benchmark was trading down 2.26% (-$1.19) at $51.39—a loss of more than $2 per barrel week over week—at 11:39am EST. Brent crude was trading down 1.84% (-$1.13) at $60.32—also down more than $2 per barrel from last week

Canada’s oil and gas rigs for the week decreased by 12 rigs this week after losing 17 rigs last week, bringing its total oil and gas rig count to 174, which is 64 fewer rigs than this time last year, with a 7-rig decrease for oil rigs, and a 5-rig decrease for gas rigs.

The EIA’s estimates for US production for the week ending December 7 continues to weigh on prices, averaging 11.6 million bpd­—a drop off from the previous 11.7 million bpd for the previous four weeks.

By 1:07pm EDT, WTI had decreased by 2.68% (-$1.41) at $51.17 on the day. Brent crude was trading down 2.03% (-$1.25) at $60.20 per barrel.

Rig Count Drops As U.S. Crude Output Hit 11 Million Bpd

Rig Count Drops As U.S. Crude Output Hit 11 Million Bpd

Oil rig

Baker Hughes reported a decreased number of active oil and gas rigs in the United States on Friday. Oil and gas rigs decreased by 8 rigs, according to the report, with the number of active oil rigs falling by 5 to 858 this week, while the number of gas rigs dipped by 2, hitting 187.

The oil and gas rig count now stands at 1,046—up 96 from this time last year, with the number of oil rigs accounting for 94 of that 96.

Canada gained 14 oil and gas rigs for the week, 11 of which were gas rigs. Canada’s oil and gas rig count is now up just 5 year over year. Oil rigs are up by 24 year over year in Canada, while the number of gas rigs are down by 19.

The biggest loser by basin this week was Granite Wash, which lost 3 rigs. The only basin to gain rigs this week were Cana Woodford (+2), and Utica (+1). The Permian basin, which saw neither an increase or a decrease this week, and Cana Woodford, saw the biggest increases year over year. Cana Woodford now has 12 more rigs than this time last year, while the Permian has 102 rigs more than this time last year.

WTI crude was trading down on Friday afternoon while Brent crude was trading up—widening the WTI discount to Brent. WTI was trading down 0.18% (-$0.12) at $68.12 at 12:34 pm EDT. Brent crude was trading up 0.25% (+$0.18) at $72.76 per barrel.

Both benchmarks are trading significantly down week on week as the market treads carefully after OPEC committed to increasing production in order to more closely stick to its production cut agreement after months of under producing, and despite US production that this week, for the first time, hit a new psychologically important high of 11 million bpd, after hovering at 10.9 million bpd for multiple weeks.

…click on the above link to read the rest of the article…

Rig Count Falters Amid Oil Price Correction

Rig Count Falters Amid Oil Price Correction

Oil rigs

Baker Hughes reported a dip in the number of active oil and gas rigs in the United States today. Oil and gas rigs decreased by 3 rigs, according to the report, with the number of oil rigs increasing by 1, and the number of gas rigs decreasing by 4.

The oil and gas rig count now stands at 1,059—up 126 from this time last year.

Canada, for its part, gained 27 oil rigs for the week—after last week’s gain of 13 oil and gas rigs. Despite weeks of significant gains, Canada’s oil and gas rig count is still down by 20 year over year.

Oil benchmarks experienced a huge slide on Friday as Russia and Saudi Arabia proclaimed their willingness to increase output ahead of the June 22 OPEC/NOPEC meeting in Vienna, even if the oil production cut deal were to fall apart. The loose commitment by two of the largest signees to the production cut deal was enough to drag down prices that were earlier being pulled upwards by Venezuela’s freefalling oil production that some think will fall below 1 million barrels per day, and continuing reports that Iran may face multiple obstacles on the road to exporting its oil in the wake of renewed sanctions levied by the United States. Related: The Permian Faces A Long Term Natural Gas Crisis

At 12:07pm EDT, the WTI benchmark was trading down a massive 3.36% (-$2.25) to $64.64, with Brent down 3.48% (-$2.64) to $73.30. Both benchmarks are down week on week as well as on the day.

US oil production continues putting downward pressure on oil prices, and for the week ending June 08, production reached 10.900 million bpd—just a hair shy of the 11 million bpd production that many had forecast for the year.

At 7 minutes after the hour, WTI was trading down 2.93% at $64.93, with Brent trading down 3.29% at $73.44.

U.S. Rig Count Falls Slightly As Canada’s Rig Count Tanks

U.S. Rig Count Falls Slightly As Canada’s Rig Count Tanks

Eagle ford rig

The number of active oil and gas rigs dipped this week, according to Baker Hughes data, decreasing by 2 rigs, bringing the total rigs to 929 rigs, which is an addition of 271 rigs for the 2017 calendar year.

The number of oil rigs in the US stayed the same for the second week in a row, while the number of gas rigs decreased by 2. The number of oil rigs stands at 747 versus 525 a year ago. The number of gas rigs in the US now stands at 182, up from 132 a year ago.

At 10:04pm EST, the price of a WTI barrel was down $0.20 (+0.33%) to $60.04—a 2.5-year high, while the Brent barrel was trading up $0.18 (+0.27%) to $66.34, largely on the back of weeks of falling US crude oil inventory, and a surprise decrease in US crude oil production.

US crude oil production has been on a steady upward trajectory for nearly a quarter, which has previous limited price spikes that came on the back of the Forties shutdown and a pipeline bombing in Libya. But US crude oil production for the week ending December 22 came in at 9.754 million barrels per day—a hair off the previous week’s high, and breaking a nine-week production increase in the US. While the 9.754-million-barrel-per-day production level is still the second highest, the fact that production didn’t increase for a tenth week bolstered confidence.

The most alarming news this week is Canada’s rig count, which saw a decrease of 58 oil rigs and 16 gas rigs.

The Permian basin rig count stayed flat this week, but stands at 134 rigs above this same week last year. Williston and Haynesville basins lost rigs this week, with DJ-Niobrara gained 3.

At 1:09pm EST, WTI was trading at $60.36 (+$0.52) with Brent trading at $66.82 (+$0.66).

Oil Production Vital Statistics March 2016

Oil Production Vital Statistics March 2016

Since the possible double bottom at $26 formed on February 11th the oil price has staged a rally to $40 (WTI). Traders lucky enough to buy at $26 and sell at $40 have pocketed a tidy 54% profit. Very few will have been this lucky. The trade was stimulated by news that Saudi Arabia and Russia had agreed to not increase production this year which is hollow news since neither country could significantly increase production no matter how hard they tried. Profit taking has now driven WTI back towards $37 as of 1 April.

What next? There is precious little sign of significant production falls anywhere. US and international rig counts continue to plunge. And there is little sign of global demand recovering as OECD economies buckle under the weight of misguided energy policy and debt. There is a risk of the plunge in oil price resuming.

The following totals compare Feb 2016 with Jan 2016:

  • World Total Liquids down 180,000 bpd
  • USA down 60,000 bpd
  • North America down 100,000 bpd (includes USA)
  • OPEC up 100,000 bpd
  • Saudi Arabia up 20,000 bpd
  • Iran up 220,000 bpd
  • Russia + FSU down 10,000 bpd
  • Europe up 220,000 bpd (YOY)
  • Asia up 60,000 bpd

This article first appeared on Energy Matters.

EIA oil price and Baker Hughes rig count charts are updated to the end of March 2016, the remaining oil production charts are updated to February 2015 using the IEA OMR data.

Figure 1 WTI tested the $26.68 low set on Jan 20 by returning to $26.19 on Feb 11. Since then a rally to $40 has been staged and the price has moved above the near term downwards trend line. Charts have limited value in prediction and must be used in conjunction with fundamentals. For now I don’t believe this chart is providing clear direction. Fundamentals remain chronically weak and the next chart points to an on-going plunge in price. But only time will tell.

…click on the above link to read the rest of the article…

Shale Gas Rig Count Could Implode Here If Prices Don’t Rebound

Shale Gas Rig Count Could Implode Here If Prices Don’t Rebound

The Haynesville Shale play needs $6.50 gas prices to break even. With natural gas prices just above $2/Mcf (thousand cubic feet), we question the shale gas business model that has 31 rigs drilling wells in that play that cost $8-10 million each to sell gas at a loss into an over-supplied market.

We first evaluated the Haynesville Shale in 2009 and the conclusion then was the same as it is today: the average well by top operators will produce about 4 Bcf and is not commercial at gas prices below $6 or $7 per Mcf. The play has two insurmountable geological problems. First, the shale is not brittle and, therefore, does not respond well to hydraulic fracturing. Second, the reservoir is over-pressured and compacts when gas is produced.

We have heard fairy tales from operators over the years about how they will improve the miserable performance of Haynesville Shale wells. These included choking back production, re-fracking old wells and, recently, drilling 10,000 foot laterals. None of these approaches worked because bad geology cannot be improved with expensive technology.
We evaluated well performance for the 5 biggest producers in the play based on cumulative gas production and the number of producing wells
(Table 1).

Table 1. Key operators in the Haynesville Shale play based on number of producing wells and cumulative gas production. Source: Drilling Info and Labyrinth Consulting Services, Inc. 

Related: Oil Jobs Lost: 250.000 And Counting, Texas Likely To See Massive Layoffs Soon

We did standard rate vs. time decline-curve analysis by operator and by year of first production to forecast average well reserves (an example is shown in Figure 1).

Figure 1. Example of Haynesville Shale decline-curve analysis showing standard log of rate vs. time, rate vs. cumulative production and log of rate vs. log of time plots for a group of XTO Energy wells with first production in 2011. Source: Drilling Info and Labyrinth Consulting Services, Inc. (click image to enlarge)

…click on the above link to read the rest of the article…

International Rig Count Still Falling

International Rig Count Still Falling

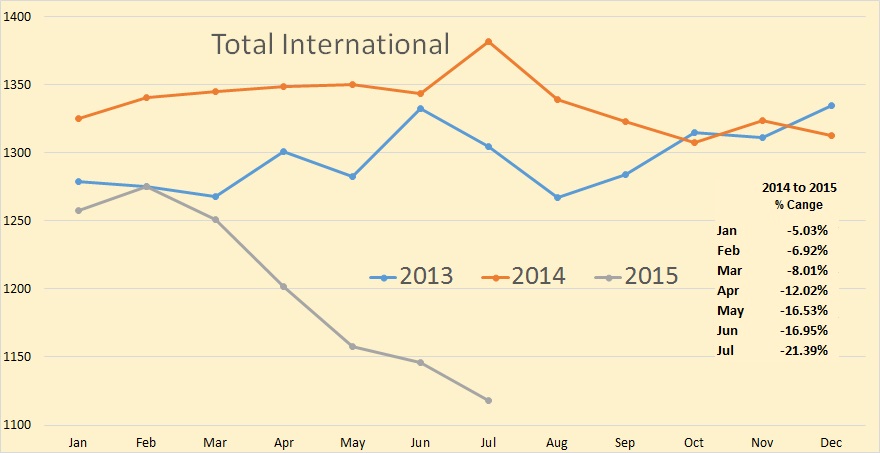
July usually sees a big jump in rig counts. This year there was a very tiny July increase, only a fraction of the increase we usually see for July.

Rig Count Total International

*The Total International rig counts does not include the USA, Canada or the FSU. The Total International rig count was down 28 in July to 1118. Last July it was up3 to 1344.


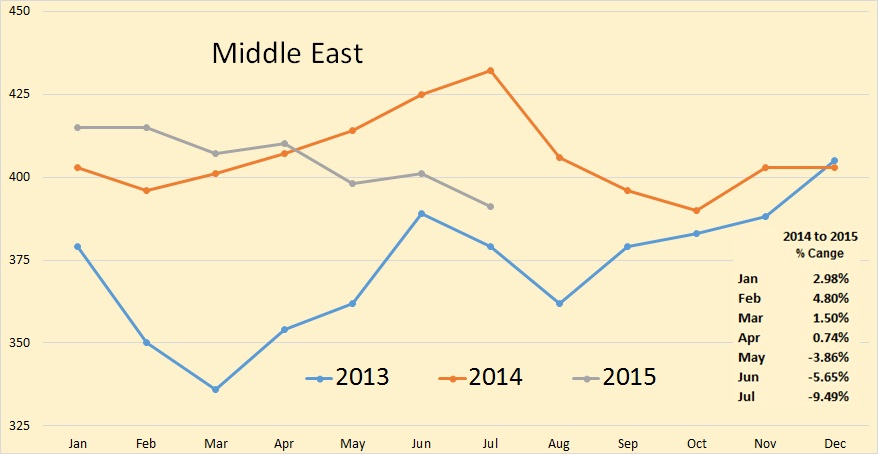
Rig Count Middle East

The Middle East is the only place that rig counts are holding up. Rig counts for July are down 32 to 391 but they are still above their 2013 levels.

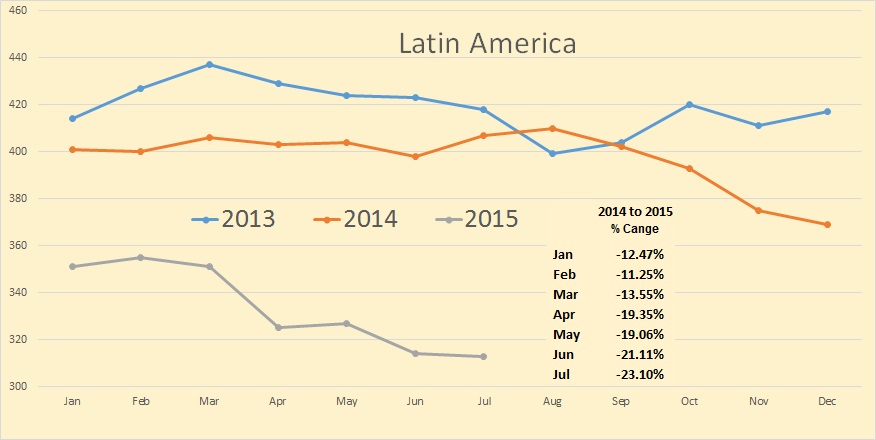
Rig Count Latin America

Latin American rigs fell 1 to 313 and are 23% below their 2014 level of 410.

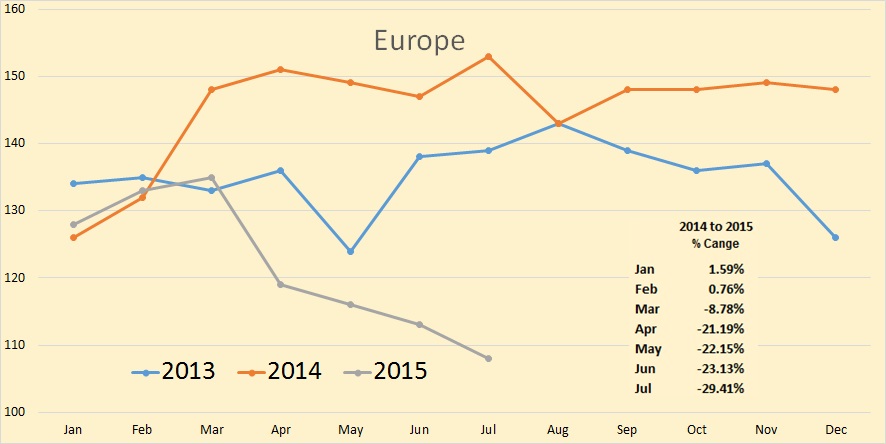
Rig Count Europe

Europe’s rig counts fell in July to 108. That is 45 rigs below last July’s count of 153.


Has The E&P Industry Lost Touch With Reality?

Has The E&P Industry Lost Touch With Reality?

The U.S. rig count increased by 19 this week as oil prices dropped below $48 per barrel–the latest sign that the E&P industry is out of touch with reality.

Getty Images from The New York Times (July 26, 2015)

The last time the rig count increased this much was the week ending August 8, 2014 when WTI was $98 and Brent was $103 per barrel.

What are they thinking?

In fairness, the contracts to add more rigs were probably signed in May and June when WTI prices were around $60 per barrel (Figure 1) and some felt that a bottom had been found, left behind in January through March, and that prices would continue to increase.

Related: Oil Price Rout Set To Inflict Real Pain On Russia

Figure 1. Daily WTI crude oil prices, January 2-July 24, 2015. Source: EIA and NYMEX futures prices (July 21-24).

(click image to enlarge)

Even then, however, the fundamentals of supply, demand and inventories pointed toward lower prices–and still, companies decided to add rigs.

In mid-May, I wrote in a post called “Oil Prices Will Fall: A Lesson in Gravity”,
“The data so far says that the problem that moved prices to almost $40 per barrel in January has only gotten worse. That means that recent gains may vanish and old lows might be replaced by lower lows.”

In mid-June, I wrote in a post called “For Oil Price, Bad Is The New Good”,
“Right now, oil prices are profoundly out of balance with fundamentals. Look for a correction.”

Oil prices began falling in early July and fell another 6% last week. Some of that was because of the Iran nuclear deal, the Greek debt crisis and the drop in Chinese stock markets. But everyone knew that the first two were coming, and there were plenty of warnings about the Chinese stock exchanges long before July.


…click on the above link to read the rest of the article…

Don’t Believe The Hype On U.S. Shale Growth

Don’t Believe The Hype On U.S. Shale Growth

The OPEC Free Fall

There is a popular narrative going around that I want to address in today’s article. Last November, after several months of plummeting crude oil prices, the Organization of the Petroleum Exporting Countries (OPEC) met to discuss the oil production quotas for each country in the months ahead. Many expected OPEC to cut production in order to shore up crude prices that had been falling since summer. This was the strategy favored by OPEC’s poorer members, as many require oil prices at $100/barrel (bbl) in order to balance government budgets.

Instead, OPEC announced that they would continue pumping at the same rate. They chose to defend market share against the surge of supply from U.S. shale producers, and in doing so the fall in the price of crude oil accelerated. A look at the U.S. rig count shows the swift impact to U.S. shale drillers in the aftermath of that meeting:

USRigCountDrop

Rig counts went into free-fall after it became clear that OPEC was not interested in propping up the price of oil for the benefit of rapidly expanding shale oil producers. While that approach hurt OPEC’s income in the short term, it also immediately impacted rig counts in the shale oil fields. But — and here is the narrative — shale oil producers continue to make gains in production even as rig counts have been slashed because they are becoming more and more efficient

Dissecting the Narrative

There is some truth to the narrative. Yes, oil production has continued to grow even though rig counts have plummeted. The week before OPEC’s meeting last November, the number of rigs drilling for oil stood at 1,574. Oil production that week was 9.1 million bpd. Today, with the rig count at 642, production is 9.6 million bpd — a gain of just over half a million bpd.


…click on the above link to read the rest of the article…

Oil Price Recovery May Be Too Much Too Soon

Oil Price Recovery May Be Too Much Too Soon

Oil prices have hit their highest levels in 2015, with WTI surging above $60 per barrel. Crude oil inventories in the U.S. declined for the first time since December 2014, perhaps indicating that the glut could be easing.

The EIA reported that oil stockpiles fell by 3.9 million barrels for the week ending on May 1, a larger drop than expected. With rig counts falling by more than half since last year, this could be the beginning of a longer contraction. Both weekly production figures and the stock build appeared to have peaked, suggesting that supplies are adjusting lower and demand is rising.

USCrudeOilStocks

That has oil prices surging from their March lows, with WTI jumping over $15 per barrel, and Brent about $20 per barrel.

Related: Oil Sector May Not Cause Financial Apocalypse After All

WTIPrices

But have the markets overreacted? The rise in oil prices over the last few weeks has been so rapid that few predicted it. Speculators have raised their bullish betsto the highest level in years. The optimism may not be justified. In the past, bets to such a degree have often been followed by a fallback in prices, the head of commodity strategy at Saxo Bank told Reuters in an interview. Similarly, the top commodities official at Commerzbank told CNBC that the price rise was “premature,” and oil prices could dip back below $50 per barrel once the markets come to their senses.

In other words, the markets may have overshot, rising beyond levels warranted by the underlying fundamentals. Oil inventories are still at 80 year highs. The 487 million barrels of oil sitting in storage will take quite a while to drawdown. Crucially, oil production is still exceeding demand, leaving oil markets well-supplied.


…click on the above link to read the rest of the article…

Deciphering The Latest Rig Count Data

Deciphering The Latest Rig Count Data

The main take-away from this week’s rig count is that everything is on track for lower U.S. oil production by mid-year. The weekly changes vary but the overall trend since October is down and that is positive for achieving a better balance between supply and demand.

Please remember the following points and read my previous post “Oil Prices Don’t Change Because of Rig Count” if you haven’t already:

• Rig count is only one indicator of future production trends. 
• Week-to-week changes are not critical but trends may become important.
• Horizontal rigs are more important than vertical rigs.
• Bakken, Eagle Ford and Permian basin are the most important plays for tight oil production in the U.S.

This week, the overall rig count was down 75 compared with 43 rigs last week. The horizontal rig count was down 51 compared with 33 rigs last week.

The Eagle Ford Shale play lost 9 horizontal rigs this week, the Permian lost 15 and the Bakken lost 3 rigs.

RigCountChangeTable

Rig Count Change Table. Source: Baker-Hughes, Labyrinth Consulting Services, Inc.

(Click to enlarge)

Related: Oil Price Crash A Blessing In Disguise For US Shale

The Bakken horizontal rig count is down 40% from its maximum in 2014. The Permian basin horizontal rig count is down 33% and the Eagle Ford is down 30%.


…click on the above link to read the rest of the article…

This Chart Shows the True Collapse of Fracking in the US

This Chart Shows the True Collapse of Fracking in the US

“People need to kinda settle in for a while.” That’s what Exxon Mobil CEO Rex Tillersonsaid about the low price of oil at the company’s investor conference. “I see a lot of supply out there.”

So Exxon is going to do its darnedest to add to this supply: 16 new production projects will start pumping oil and gas through 2017. Production will rise from 4 million barrels per day to 4.3 million. But it will spend less money to get there, largely because suppliers have had to cut their prices.

That’s the global oil story. In the US, a similar scenario is playing out. Drillers are laying some people off, not massive numbers yet. Like Exxon, they’re shoving big price cuts down the throats of their suppliers. They’re cutting back on drilling by idling the least efficient rigs in the least productive plays – and they’re not kidding about that.

In the latest week, they idled a 64 rigs drilling for oil, according to Baker Hughes, which publishes the data every Friday. Only 922 rigs were still active, down 42.7% from October, when they’d peaked. Within 21 weeks, they’ve taken out 687 rigs, the most terrific, vertigo-inducing oil-rig nose dive in the data series, and possibly in history:

US-rig-count_1988_2015-03-06=oil

As Exxon and other drillers are overeager to explain: just because we’re cutting capex, and just because the rig count plunges, doesn’t mean our production is going down. And it may not for a long time. Drillers, loaded up with debt, must have the cash flow from production to survive.


…click on the above link to read the rest of the article…

Rig Count Decline Re-Accelerates To 2nd Biggest Drop In 22 Years

Rig Count Decline Re-Accelerates To 2nd Biggest Drop In 22 Years

Following last week’s slowing in the pace of rig count, crude prices dropped and then spiked, and it makes today’s data under more scrutiny. At around $49.50, WTI prices have round-tripped back almost perfectly to the scene of the crime before today’s rig count data hit. The total oil rig count dropped almost 6%, down 75 to 1,192 meaning a re-acceleration of the rig count decline and the 2nd biggest drop since 1993.

  • *U.S. TOTAL RIG COUNT -75 To 1,192 , BAKER HUGHES SAYS
  • *U.S. OIL RIG COUNT -64 TO 922, BAKER HUGHES SAYS

2nd biggest rig count decline since 1993

Total rig count has now dropped 38% in the last 13 weeks – just shy of the move in 2009…


…click on the above link to read the rest of the article…

Fracking Bust Deepens, Sets Records

Fracking Bust Deepens, Sets Records

The fracking bust that is following the phenomenal fracking boom is deepening relentlessly, week after week, and there is still no respite in sight.

Drilling activity peaked in October last year, when 1,606 rigs were drilling for oil, with a four-month lag behind oil prices. But by October it was clear that the oil-price plunge wasn’t a blip, and in November oil fell off the chart. It was then that the industry reacted with vertigo-inducing rapidity. And the number of rigs drilling for oil, which Baker Hughes publishes every Friday, began to plummet.

In the latest reporting week reported Friday, drillers idled an additional 34 oil rigs. Now only 1,019 rigs are still drilling for oil, down 590 rigs from the October peak, a 37% plunge in 19 weeks. The steepest rig-count plunge in the data series.

US-rig-count_1988_2015-02-20=oil

But drillers have to service their mountain of debt with which the fracking boom was funded. They can’t afford to cut production. To stay alive, they cut operating cost and capital expenditures, and they’re laying people off. But they focus their remaining resources on the most productive plays, using the most efficient technologies, with a single-minded focus on raising production while spending less.

The hope is that this strategy will get them through the oil bust if it doesn’t last too long. But because everyone is thinking in those terms, US production overall continues to rise – it averaged an estimated 9.2 million barrels per day in January.

…click on the above link to read the rest of the article…


Olduvai IV: Courage
Click on image to read excerpts

Olduvai II: Exodus
Click on image to purchase

Click on image to purchase @ FriesenPress