Home » Posts tagged 'peak oil barrel'

Tag Archives: peak oil barrel

Olduvai
Click on image to purchase

Olduvai III: Catacylsm
Click on image to purchase

Post categories

Post Archives by Category

July Non-OPEC and World Oil Production

July Non-OPEC and World Oil Production

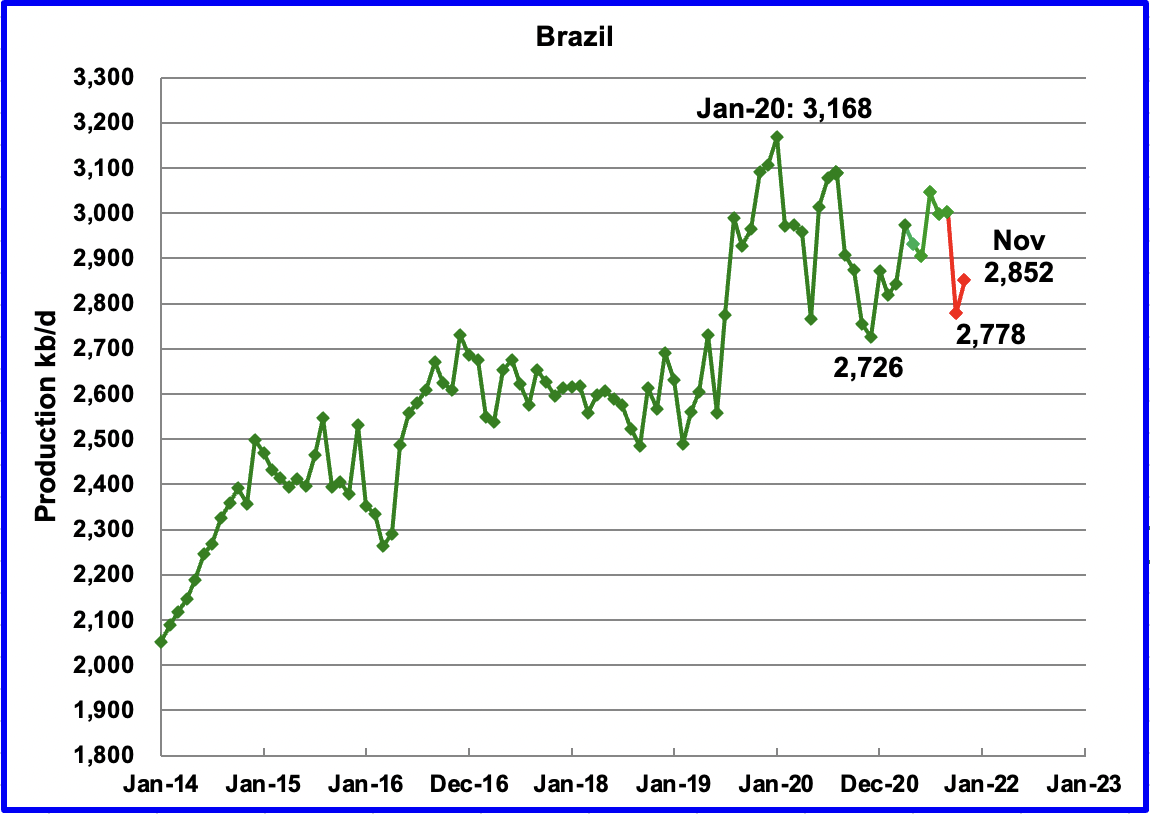
The EIA continues to have problems with updating its World oil production website. Consequently, this month’s report is again a shorter version of previous posts because the EIA’s International Energy Statistics update for June and July is not available. Information from other sources such as OPEC, the STEO and country specific sites such as Brazil, Norway and China are used to provide a short term outlook for future output and direction for a few of these countries and the world.

Where STEO data was used, the ratio of C + C to All Liquids was calculated. The average for the last six months up to May was used to project June and July production and in a few cases August production.

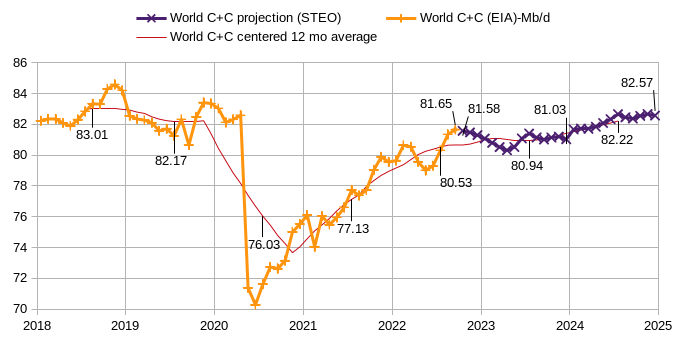
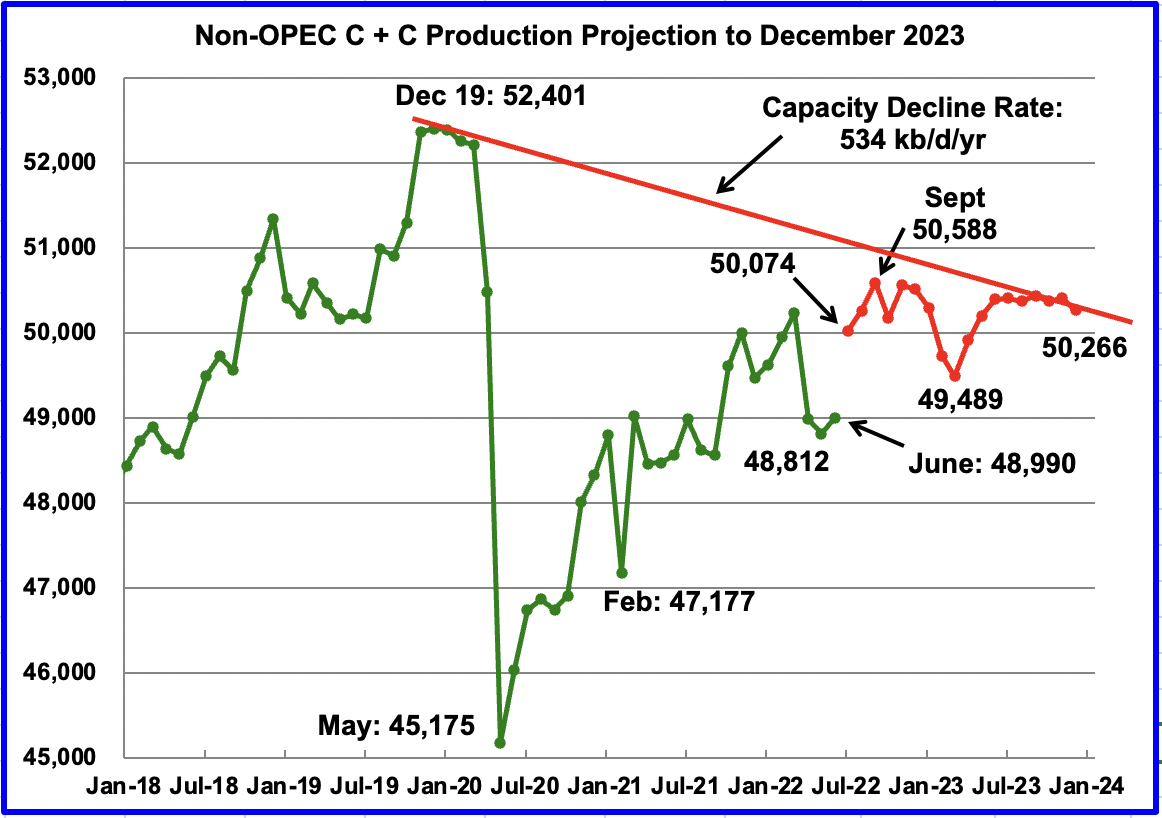
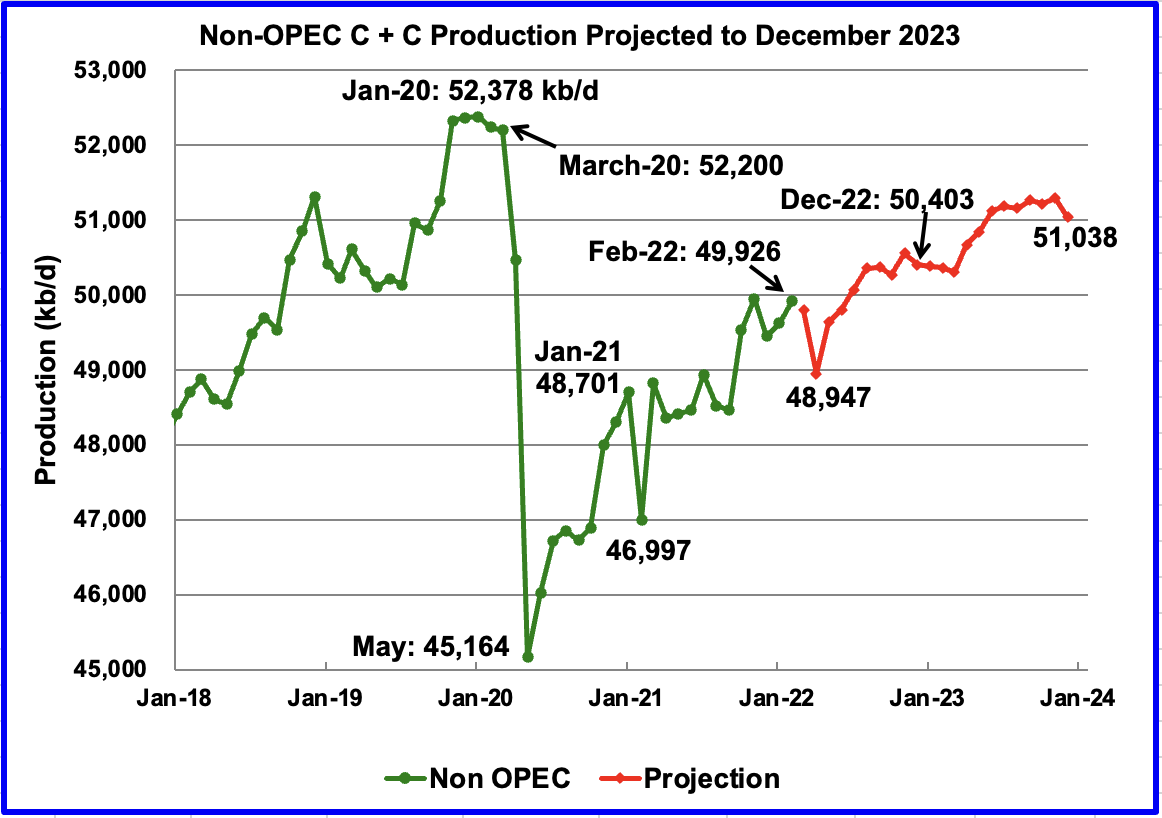
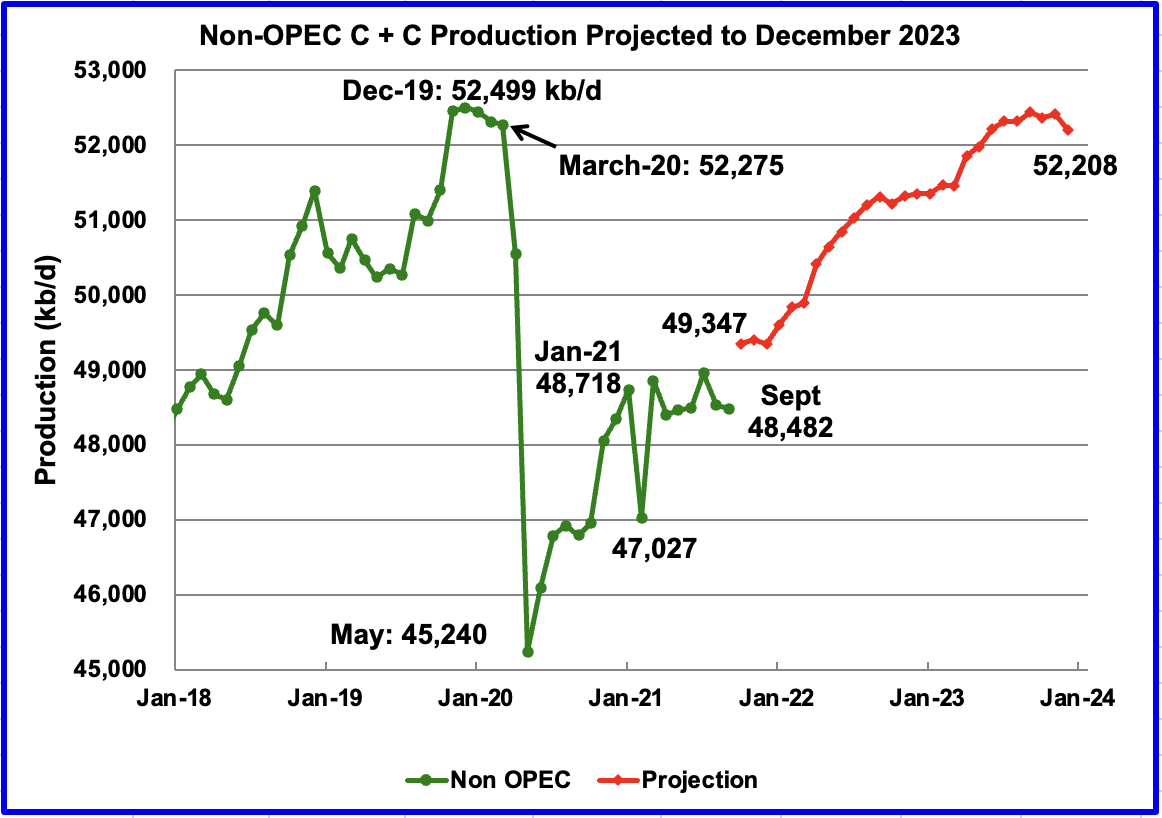
World oil production and projection charts are presented at the end of this post.

The current May International Energy Statistics has been updated to correct for the missing condensate production in the previous Russian file and is used for this report.

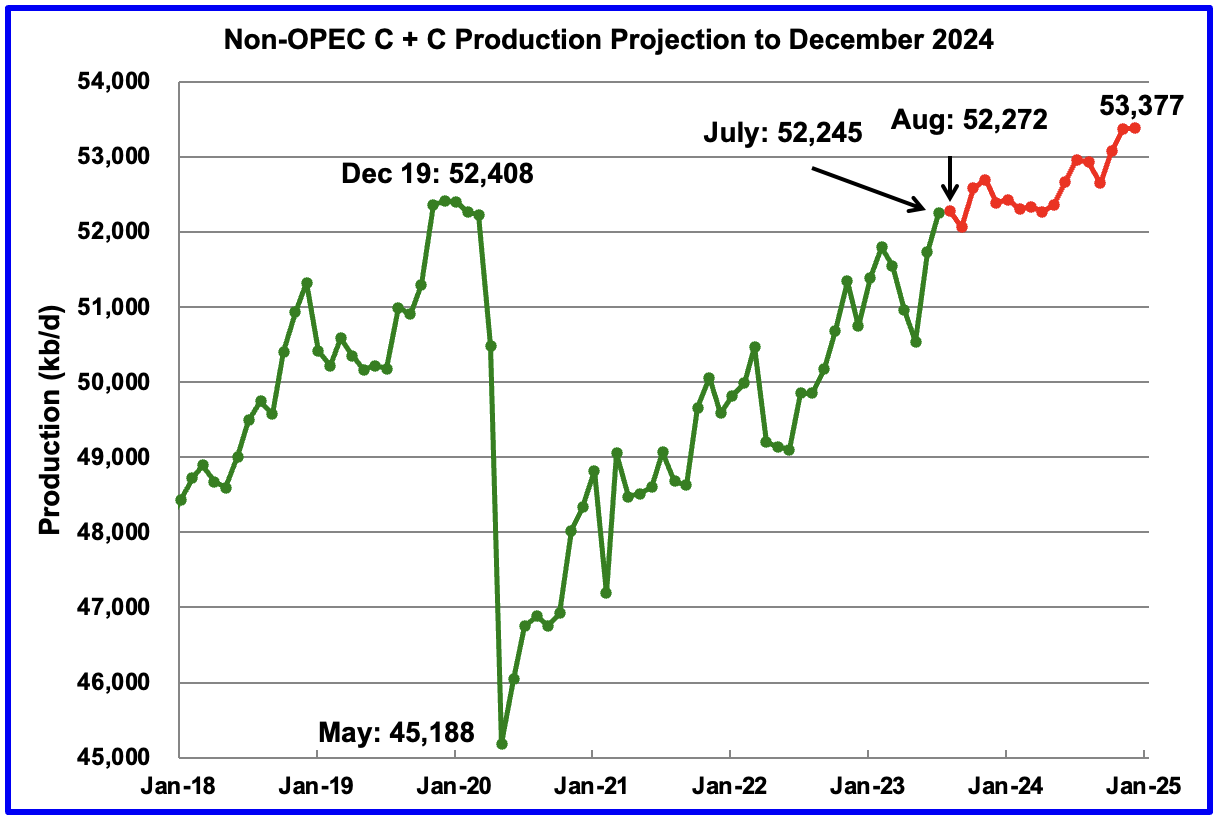
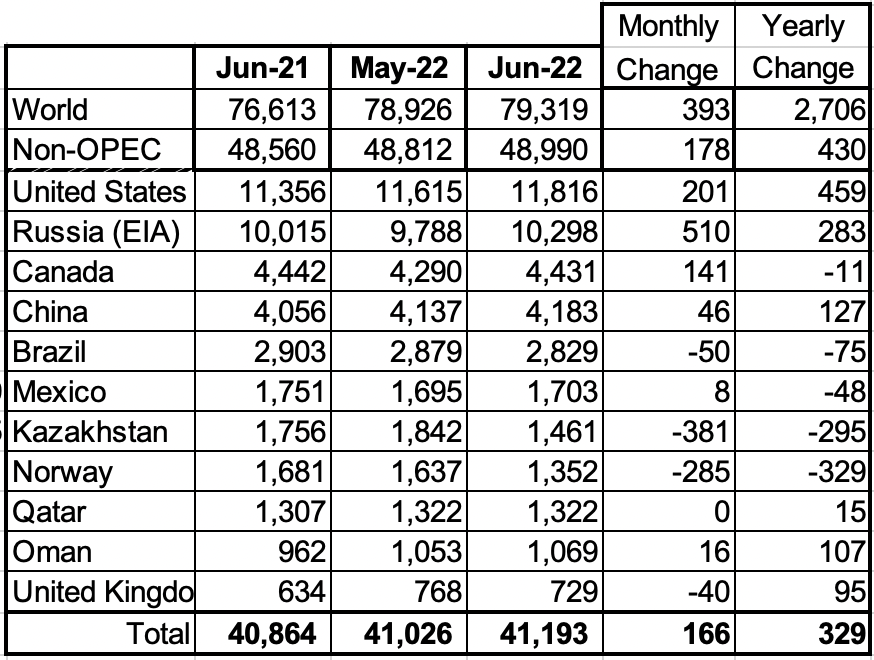
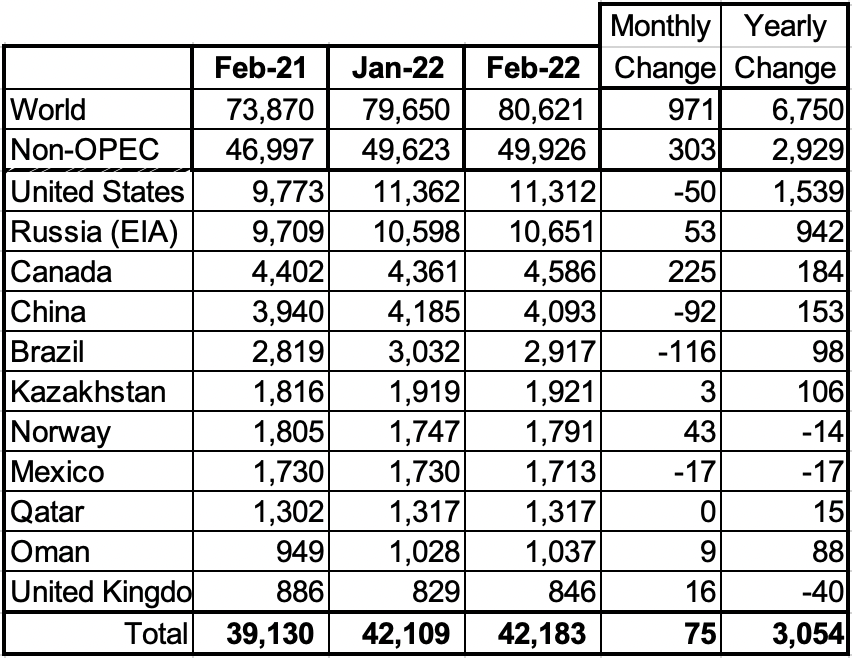
July Non-OPEC oil production increased by 520 kb/d to 52,245 kb/d and is up 1,706 kb/d from May. Close to 500 kb/d of the June increase is related to the EIA’s condensate correction for Russia in the EIA’s updated May International Energy Statistics. In the previous EIA May report, Russian condensate was not included in Russian production.

Using production data from the November 2023 STEO and the updated May EIA International Energy Statistics, a projection for Non-OPEC oil output was made for the period August 2023 to December 2024. (Red graph).  Output is expected to reach 53,377 kb/d in December 2024, which is 969 kb/d higher than the December 2019 peak of 52,408 kb/d. August production is expected to increase by 27 kb/d.

From August 2023 to December 2024, oil production in Non-OPEC countries is expected to increase by 1,105. Note that production is expected to be relatively flat till May 2024.

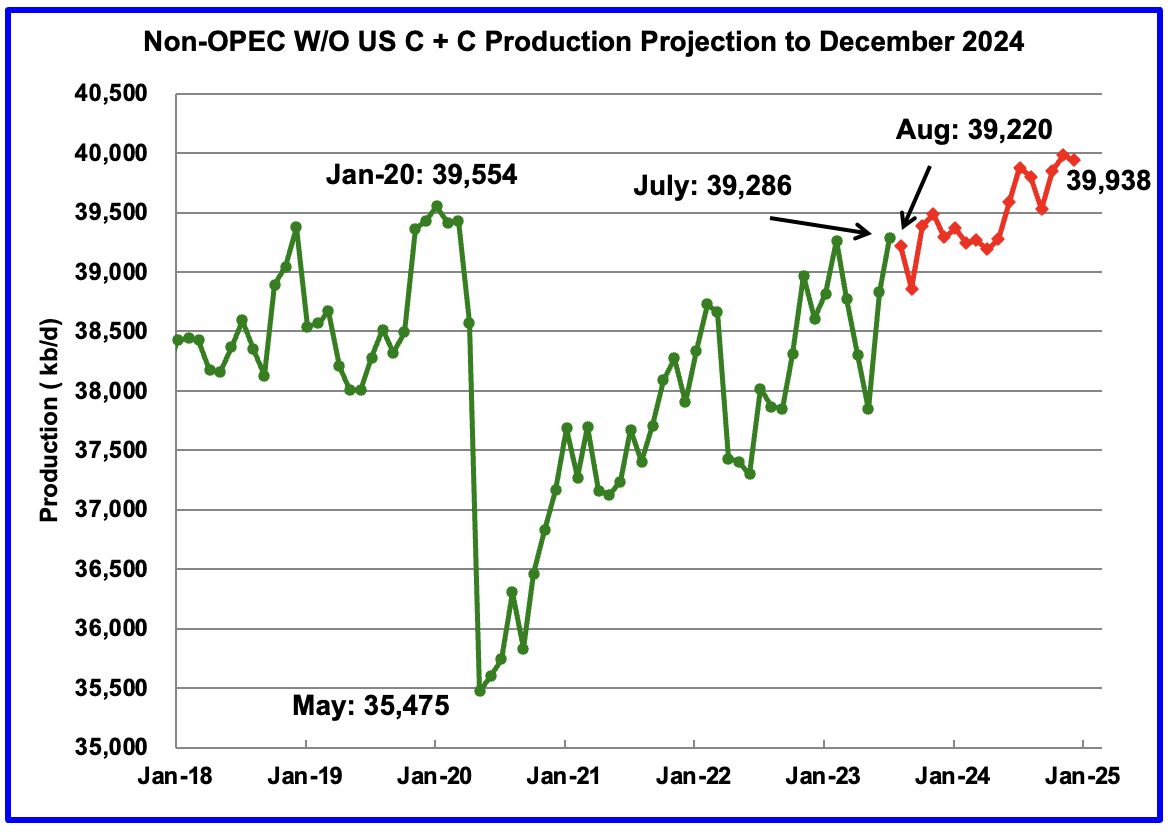
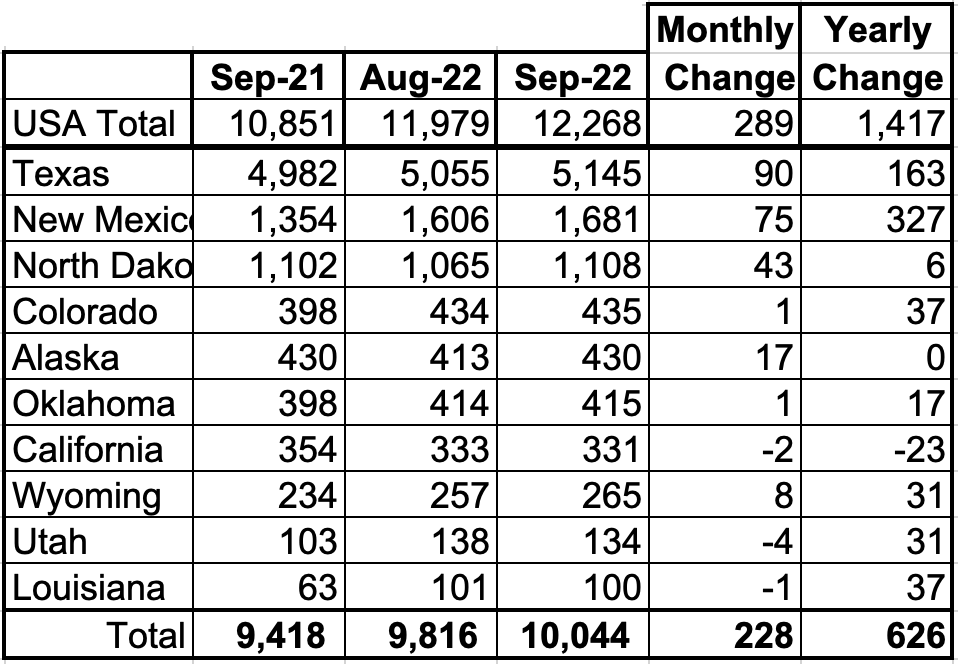
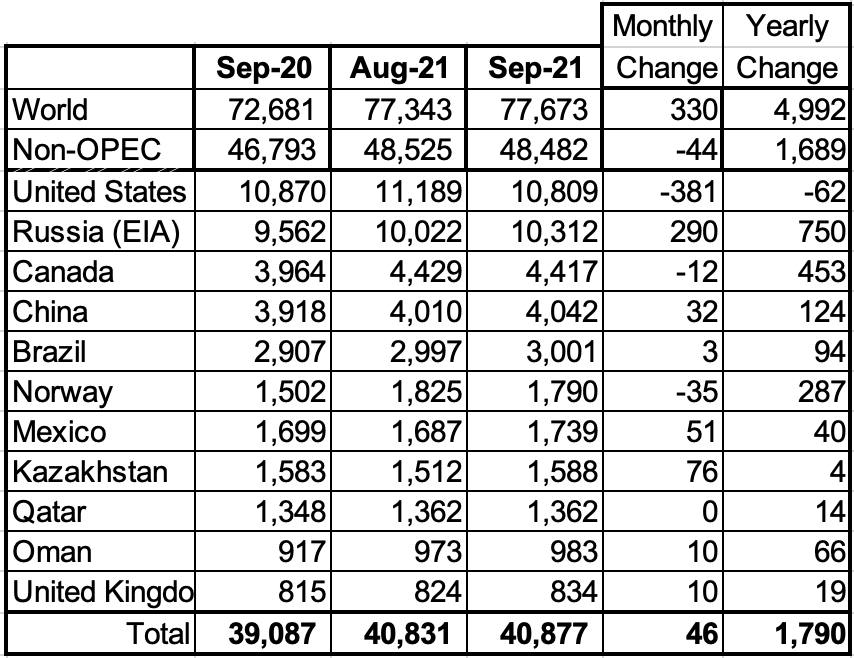
July Non-OPEC W/O US production increased by 455 kb/d to 39,286 kb/d.

…click on the above link to read the rest…

US EIA Short Term Energy Outlook, Jan 2023

US EIA Short Term Energy Outlook, Jan 2023

The US EIA Short Term Energy Outlook (STEO) was published on January 10, 2023. This report generally provides forecasts for Total Liquids production for non-OPEC nations, crude only output for OPEC nations, and both C+C and Total Liquids forecasts for the US. At Peak Oil Barrel we focus on crude plus condensate (C+C) output as this is the critical input that provides most of the World’s liquid fuels used for land, air and water transportation. The STEO also provides forecasts for natural gas and electricity output as well as price forecasts for oil, natural gas, and electricity. This post will focus on oil (both total liquids and C+C).

We find the OLS trend in the ratio of C+C divided by total liquids for non-OPEC minus the US over the period from October 2014 to September 2022 (it has been decreasing at an annual rate of 0.267% over that period) and we assume the trend continues from October 2022 to December 2024 (the end of the STEO forecast). This allows us to estimate non-OPEC minus US C+C. Likewise we find the ratio of OPEC crude to C+C which was relatively flat at about 93.7% from Jan 2010 to December 2019 and seems to be returning to this level since the depths of the pandemic. By assuming the ratio is 93.7% crude to C+C for OPEC we can estimate OPEC C+C from October 2022 to December 2022 using the STEO crude only estimate. The non-OPEC minus US C+C estimate is added to the STEO US C+C estimate and this is combined with the OPEC C+C estimate to find the World C+C STEO forecast.

Figure 1

…click on the above link to read the rest…

US October Oil Production Pushed Higher by New Mexico

US October Oil Production Pushed Higher by New Mexico

All of the Crude plus Condensate (C + C) production data for the US state charts comes from the EIAʼs December Petroleum Supply monthly PSM which provides updated information up to October 2022.

U.S. October production increased by 69 kb/d to 12,381 kb/d to a New post pandemic high.  It should be noted that September’s oil production increase of 289 kb/d to 12,268 kb/d which was reported last month and was considered high, was revised further up by 44 kb/d to 12,312 kb/d in the current October report. For September, the state with the largest increase was New Mexico 41 kb/d, along with a number of small increases from the smaller producing states.

While overall US oil production increased, a clearer indication of the health of US production can be gleaned by looking more closely at the Onshore L48 states.  In the Onshore L48, October production increased by 69 kb/d to 10,104 kb/d. This means that 100% of the increase in US production came from the Onshore L48.

The blue graph, taken from the December 2022 STEO, is the production forecast for the U.S. from November 2022 to December 2023. Output for December 2023 is expected to be 12,614 kb/d, 34 kb/d higher than reported last month.

Note that production in October 2023 is forecast to be lower than in October 2022. The flatness in overall US output up to October 2023 is because the production increase in the Onshore L48 of 506 kb/d from December 2022 to December 2023 is offset by declining production in the GOM. See GOM chart further down.

The red OLS line from June 2020 to October 2022 indicates a monthly production increase of 53.2 kb/d/mth over that period. The first portion of red line stops at October because that is the range covered by the OLS analysis. The second portion is the same OLS line extended to see how well it fits the STEO forecast.

Oil Production Ranked by State

…click on the above link to read the rest…

Permian Pushes US December Oil Production to Post Pandemic High

Permian Pushes US December Oil Production to Post Pandemic High

All of the Crude plus Condensate (C + C) production data for the US state charts comes from the EIAʼs November Petroleum Supply monthly PSM which provides updated information up to September 2022.

U.S. September production increased by 289 kb/d to 12,268 kb/d.  It should be noted that August’s oil production was revised up by only 4 kb/d in the current September report. The large increase over the August update is real. For September, the states with the largest increase were Texas 90 kb/d, New Mexico 75 kb/d and North Dakota 43 kb/d. The Gulf of Mexico added 64 kb/d.

September’s production was at a new post pandemic high and crossed 12,000 kb/d. It is now 732 kb/d below the pre-pandemic high of 13,000 kb/d 

While overall US oil production increased, a clearer indication of the health of US production can be gleaned by looking more closely at the Onshore L48 states.  In the Onshore L48, September production increased by 208 kb/d to 9,989 kb/d. This means that 72% of the increase in US production came from the Onshore L48.

The blue graph, taken from the November 2022 STEO, is the production forecast for the U.S. from October 2022 to December 2023. Output for December 2023 is expected to be 12,580 kb/d.

The red OLS line from June 2020 to September 2022 indicates a monthly production increase of 50.5 kb/d/mth over that period. The first portion of red line stops at September because that is the range covered by the OLS analysis. The second portion is the same OLS line extended to see how well it fits the STEO forecast.

Oil Production Ranked by State

Listed above are the 10 states with the largest US production. These 10 accounted for 81.9% of all U.S. oil production out of a total production of 12,268 kb/d in September 2022. 

…click on the above link to read the rest…

June Non-OPEC Oil Production Rises from U.S. and Russia Boost

June Non-OPEC Oil Production Rises from U.S. and Russia Boost

Below are a number of Crude oil plus Condensate (C + C ) production charts for Non-OPEC countries created from data provided by the EIA’s International Energy Statistics and updated to June 2022. This is the latest and most detailed world oil production information available. Information from other sources such as OPEC, the STEO and country specific sites such as Russia, Brazil, Norway and China is used to provide a short term outlook for future output and direction for a few countries and the world. The US report has an expanded view beyond production by adding rig and frac charts.

June Non-OPEC production increased by 178 kb/d to 48,990 kb/d. The largest increases came from Russia, 510 kb/d and the U.S., 201 kb/d. The largest offsetting decreases came from Kazakhstan, 381 kb/d and Norway, 285 kb/d. 

Using data from the October 2022 STEO, a projection for Non-OPEC oil output was made for the time period July 2022 to December 2023. (Red graph).  Output is expected to be 50,266 kb/d in December 2023. This forecast is 608 kb/d lower than predicted in the September report due to significant downward changes in the October STEO.

The large increase in July is due to a 1,600 kb/d increase in all liquids over June forecast in the October STEO. The C + C projection reduces the 1,600 kb/d increase to 1,084 kb/d.

Note that the September 2022 high of 50,588 kb/d is the high for all of 2022 and 2023.

The red capacity decline line represents an average decline rate for Non-OPEC countries over the four years since December 2019 and is combination of the natural decline rate plus possible reduction in exploration and production capacity/investment.

Non-OPEC Oil Production Ranked by Country

…click on the above link to read the rest…

OPEC Update, September 18, 2022

OPEC Update, September 18, 2022

The OPEC Monthly Oil Market Report (MOMR) for September 2022 was published recently. The last month reported in most of the OPEC charts that follow is August 2022 and output reported for OPEC nations is crude oil output in thousands of barrels per day (kb/d). In most of the OPEC charts that follow the blue line is monthly output and the red line is the centered twelve month average (CTMA) output.

Figure 1
Figure 2

OPEC output increased by 618 kb/d in August after being revised higher in July 2022 by 37 kb/d and June 2022 output was revised up by 5 kb/d compared to last month’s MOMR. The bulk of the August increase in OPEC output (69%) was from Libya(426), with smaller increases from Saudi Arabia(160), Kuwait(37), and UAE(33). Nigeria had a decrease of 65 kb/d. The rest of the OPEC producers had small increases or decreases of less than 20 kb/d with a total increase of 25 kb/d for all 8 nations.

…click on the above link to read the rest of the article…

February Non-OPEC Oil Production Climbs

February Non-OPEC Oil Production Climbs

Below are a number of crude oil plus condensate (C + C ) production charts for Non-OPEC countries created from data provided by the EIA’s International Energy Statistics and updated to February 2022. This is the latest and most detailed world oil production information available. Information from other sources such as OPEC, the STEO and country specific sites such as Russia, Brazil, Norway and China is used to provide a short term outlook for future output and direction for a few countries and the world.

February Non-OPEC production increased by 303 kb/d to 49,926 kb/d. Of the 303 kb/d increase, the biggest increase came from Canada 225 kb/d. Offsetting the increase were decreases from Brazil 116 kb/d and China 92 kb/d. The Febuary 2022 output of 49,926 kb/d is 2,274 kb/d lower than the March pre-covid rate of 52,200 kb/d.

Using data from the June 2022 STEO, a projection for Non-OPEC oil output was made for the time period March 2022 to December 2023. (Red graph).  Output is expected to reach 51,038 kb/d in December 2023. This is a 536 kb/d increase over the level reported in the previous report. Note the production drop of 848 kb/d to 48,947 kb/d in April in the red graph is associated with a production drop in the former Soviet Union.

Above are listed the world’s 11th largest Non-OPEC producers. The original criteria for inclusion in the table was that all of the countries produced more than 1,000 kb/d. The UK has been below 1,000 kb/d since January 2021. 

In February 2022, these 11 countries produced 84.5% of the Non-OPEC oil. On a YoY basis, Non-OPEC production increased by 2,929 kb/d while on a MoM basis production, it increased by 303 kb/d. World YoY February output increased by 6,750 kb/d. 

Production by Country

The EIA reported Brazil’s February production decreased by 116 kb/d to 2,917 kb/d. Brazil’s National Petroleum Association reported that April’s output increased by 18 kb/d to 2,999 kb/d, reversing February’s decline. (Red Markers). 

…click on the above link to read the rest of the article…

Collapse: a Decadal Scenario

Collapse: a Decadal Scenario

The “Nineties”

Three generations after the collapse, most folks are illiterate and animistic.  They gaze in wonder at the vast ruins of dead and decaying cities:  “Who built these places?  How did they do it?  Where did they go?  We hear stories, but truly, they must be gods.”

Food and energy remain scarce in 2090, but with reduced threat of armed conflict, communities are finally able to settle peacefully in agricultural lands around the world.  With scavenged materials they build self-sufficient towns, villages, and hamlets near waterways and important crossroads.

Settlements are resource limited, and socially cautious, averaging 150 people – “Dunbar’s number”.  For survival requires reliable families, dependable friends, and trustworthy neighbors.  These bonds minimize conflict and allow consensus to guide group action.

With careful and intensive community management, healthy soils slowly return.  Cover crop, rotation, fallow, and herd grazing practices are strictly followed.  Old cultivars when found are highly prized, while new ones are developed and exchanged with other regional growers.


Forest and woodlot management is rigorously enforced and culturally defined and imprinted.  The “woods” are a valued resource, heavily guarded and protected to insure future energy supplies, provide construction material, and create habitat for remaining biodiversity.

Communities are proud of their forests and woodlots, land and soil, seeds and crops.  They are proud of their people who with determination and against all odds, survived the “dark passage” of war and brutal hardship.  And they are proud of their strong children who will replace them in the home, shop, and field.  And so they hold yearly spring rituals to encourage good growth, summer celebrations to bring good weather, and fall festivals to show thanks for a good harvest.

Farmers and craftsmen from these communities provide surplus grain and goods to hub cities – some with several thousand citizens – all dependent on the productivity of rural agriculture…

…click on the above link to read the rest of the article…

OPEC Update, March 2022

OPEC Update, March 2022

The OPEC Monthly Oil Market Report (MOMR) for March 2022 was published this week. The last month reported in each of the charts that follow is February 2022 and output reported for OPEC nations is crude oil output in thousands of barrels per day (kb/d). In most of the charts that follow the blue line is monthly output and the red line is the centered twelve month average (CTMA) output.

Figure 1
Figure 2

OPEC output increased by 440 kb/d according to secondary souces in February. January 2022 output was revised higher by 52 kb/d from what was reported last month and December 2021 output was revised lower by 35 kb/d compared to the February 2022 MOMR. Most of the increase in OPEC output was from Saudi Arabia(141 kb/d) followed by Libya (105 kb/d), Iran (44 kb/d), Iraq (36 kb/d), and Kuwait (32 kb/d). Six OPEC members saw increases of less than 27 kb/d (total of 101 kb/d for that group of 6 nations). Only two OPEC nations had lower output in February with a total decrease of 19 kb/d.

In the chart below OPEC 13 crude and Russian C+C are shown, I expect that OPEC 13 crude plus Russian C + C will likely top out at about 40500 kb/d, if sanctions are not removed from Iran and Venezuela, potential future increase for OPEC 13 and Russia is about 1000 kb/d without Iranian sanctions relief. If Russia falters due to ongoing sanctions and cannot increase output from the February 2022 level, potential OPEC capacity is reduced to about 700 kb/d.

…click on the above link to read the rest of the article…

September Non-OPEC Oil Production Slips

September Non-OPEC Oil Production Slips

Below are a number of oil, crude plus condensate (C + C ), production charts for Non-OPEC countries created from data provided by the EIA’s International Energy Statistics and updated to September 2021. Information from other sources such as OPEC, the STEO and country specific sites such as Russia, Brazil, Norway and China is used to provide a short term outlook for future output and direction for a few countries and the world.

September Non-OPEC production declined by 44 kb/d to 48,482 kb/d. The biggest changes in production occurred in the US, -381 kb/d and Russia, +290 kb/d.

Using data from the January 2022 STEO, a projection for Non-OPEC oil output was made for the time period October 2021 to December 2023 (Red graph).  Output is expected to reach 52,208 kb/d in December 2023, which is 291 kb/d lower than the December 2019 pre-covid peak of 52,499 kb/d. 

Output in October is expected to rebound to 49,347 kb/d, an increase of 865 kb/d. The majority of the 865 kb/d increase will come from the recovery of US production in October, 651 kb/d, and close to 250 kb/d from OPEC.

Above are listed the world’s 11th largest Non-OPEC producers. The original criteria for inclusion in the table was that all of the countries produced more than 1,000 kb/d. The last two have currently fallen below 1,000 kb/d. 

In September, these 11 countries produced 84.3% of the Non-OPEC output. On a YoY basis, Non-OPEC production increased by 1,689 kb/d while on a MoM basis production decreased by 44 kb/d to 48,482 kb/d.  World YoY September output was up by 4,992 kb/d. 

Production by Country

The EIA reported Brazil’s September production increased by 3 kb/d to 3,001 kb/d. According to this source, October output dropped by 223 kb/d to 2,778 kb/d in October and then rebounded to 2,852 kb/d in November. (Red Markers). 

…click on the above link to read the rest of the article…

Bakken Summary

Bakken Summary

The North Dakota area of the Bakken LTO basin has accessible data from the ND Department of Natural Resources, Oil and Gas Division. Production here seems to be past peak and in general decline. The data presented here is therefore more a historical perspective than of much interest in predicting issues that may have significant impact for the future. However it may give some indication on what to expect in the Permian basins, the only ones left in the US that may have capacity to increase production. The Texas RRC does also produce good data but a global data dump produces files that are too big for my computer to handle and splitting into smaller subsets is too man-hour intensive for me to pursue.

Production Across the Area

These charts show how the oil production has changed every three years by range (almost equivalent to lines of longitudes) and township lines (latitudes). These lines run every six miles and the area they contain is called a township, consisting of 36 square mile sections (that’s the simplified explanation, earth’s curvature and irregular land features make things a bit more complicated).

The production shapes indicate that there aren’t core (tier 1) areas with surrounding poorer quality areas. There is a single, small central peak area (I think geologists might call this a bright spot) and the reservoir quality declines steadily to the edges of the basin, outside of which there is no meaningful production and never will be no matter what oil prices, technology improvements or USGS fantasies come along.

The chart below shows the production over the whole area for April 2021, looking towards the north-west…

…click on the above link to read the rest of the article…

US April Oil Production Flat

US April Oil Production Flat

All of the oil (C + C) production data for the US state charts comes from the EIAʼs Petroleum Supply monthly PSM. After the production charts, an analysis of three EIA monthly reports that project future production is provided. The charts below are updated to April 2021 for the 10 largest US oil producing states.

U.S. April production was essentially flat. It decreased by 19 kb/d to 11,169 kb/d from Marchʼs output of 11,188 kb/d. It was also 113 kb/d higher than January’s.

The June STEO report forecasted US April output would be 11,082 kb/d vs the reported actual output for April of 11,169 kb/d, an under estimate of 87 kb/d. 

In the onshore lower 48, April production increased by 80 kb/d, red graph. The 99 kb/d difference between the US’ decrease and the On-shore L48’s increase was largely due to the 92 kb/d decrease from the GOM.

Ranking Production from US States

Listed above are the 10 states with the largest US production. These 10 accounted for 80.8% of US production out of a total production of 11,169 kb/d in April 2021. 

On a MoM basis, the largest barrel increases came from Colorado, Texas and New Mexico. On a YoY basis, all states except New Mexico and Utah had a lower output than last year. Note also that New Mexico’s output surpassed North Dakota and moved into second place.

Production by State

Texas production increased by 28 kb/d in April to 4,791 kb/d.  In the EIA’s June report, March’s output was revised up by 18 kb/d from 4,745 kb/d to 4,763 kb/d.

In April there were close to 194 oil rigs operation in Texas. By the fourth week of June 25, 201 were operating. From the end of April to the week of June 25, Texas added 7 oil rigs. It appears that the rate of adding rigs in Texas has slowed. See Rig chart in Section 4 further down.

April’s New Mexico production increased by 17 kb/d to 1,172 kb/d. April’s output is a new record.

…click on the above link to read the rest of the article…

Annual Reserve Revisions Part IV: Shale Producers

Annual Reserve Revisions Part IV: Shale Producers

EIA Liquids Reserve Estimates

This follows on from Part I, which looked at EIA reserves and revision estimates for US as a whole and the GoM, and concentrates on the on-shore tight oil and (below)gas producing regions.

The EIA issues revision data by whole states or state districts rather than by basin, so some of the reserves and production, but a small proportion, will be from conventional reservoirs. It does give total reserves for each shale basin but not the changes, and I didn’t go to the trouble of pro-rating everything against that. Its data only goes through 2019; the 2020 update will be out in December or January.

The regions for each basins used are Permian – Texas Districts 7C, 8 and 8A and East New Mexico; Bakken –  North Dakota and Montana; Eagle Ford – Texas Districts 1, 2, 3 and 4 Onshore; Niobara –  Colorado; Marcelus – Pennsylvania and West Virginia; Utica –  Ohio; Haynesville – Louisiana South Onshore and Texas District 6; Barnett – Texas Districts 5, 7B and 9; Woodford – Oklahoma ; Fayetteville – Arkansas.

Remaining reserves are for crude, condensate and NGL, which is easier to include here given the way EIA presents its data. Totalled for all the basins these may have peaked in 2019, they were levelling off from 2018 and will certainly fall significantly in 2020.

Production was aggressively increasing in 2019, coming mainly from the Permian, but will fall in 2020, and given shale dynamics, a concurrent peak with reserves is not unlikely.

Cumulative adjustments and revisions turned negative in 2019 and I expect will show a major decline for 2020, which may well not be fully recovered even if prices rise significantly. To me this indicates that estimates for recovery factors were over-estimated originally and are gradually being corrected…

…click on the above link to read the rest of the article…

Annual Reserve Revisions Part III: Larger Independents

Annual Reserve Revisions Part III: Larger Independents

The story here is of a gradual decline in the size and importance of most of these (once) large independents. Their combined reserves and production is not sizeable compared to the super majors and majors but their history may be indicative of what is coming the way of the larger companies. All but one of these companies is American owned. Most have or had holdings in shale or oil sands but many have sold off most of these and chosen to concentrate on a shrinking core business. There is probably a fuller picture to see if their financial performances, such as debt loads or share buy back schemes, were also considered but that’s a bigger job than I’m prepared for or capable of.

For the reserves charts the right hand axis shows liquid (green) and gas (red) replacement ratio with the organic ratios and their trend lines as solid lines and total ratios, including trades, as diamond markers.

On the the production charts I have not shown R/P for the oil sands production (nor the replacement ratio on the reserves chart) as for the small producers it tends to whizz about all over the place as prices change, but see the future post on Canada and oil sands for some more details.

On the revision summary charts I have not shown the cumulative trades (acquisitions/dispositions) or adjustments and revisions if they go negative, as the charts are complicated enough as they are, though really colourful, which is what I mostly go for. However, in such cases, I have shown the final figure in the legend.

ConocoPhilips (COP)

In the last fifteen years, pretty much since its inception in the merger of 2002, COP has lost over half of its reserves, averaged below 100% replacement ratio (and falling) and seen production half…

…click on the above link to read the rest of the article…

US March Oil Production Rebounds Strongly From Winter Storm Low

US March Oil Production Rebounds Strongly From Winter Storm Low

All of the oil (C + C) production data for the US state charts comes from the EIAʼs Petroleum Supply monthly PSM. The charts below are updated to March 2021 for the 10 largest US oil producing states.

U.S. March production increased by 1,401 kb/d to 11,184 kb/d from Februaryʼs output of 9,783 kb/d and was also 128 kb/d higher than January’s. The increase was due to the rebound from the severe winter storm that hit the four US southern states, Texas, New Mexico, Louisiana and Oklahoma. Note that February’s output of 9,862 kb/d in the previous report was revised down by 79 kb/d to 9,783 kb/d in the current report.

The May STEO report forecasted US March output would be 10,939 kb/d vs the reported actual output for March of 11,184, an under estimate of 245 kb/d. Note that March output was 57 kb/d higher than January.

In the onshore lower 48, March production increased by 1,298 kb/d, red graph. The 103 kb/d difference between the two was largely due to the 107 kb/d increase from the GOM.

Ranking Production from US States

Listed above are the 10 states with the largest US production. These 10 accounted for (79.8%) of US production out of a total production of 11,184 kb/d in March 2021. 

Of these 10 states, Texas, New Mexico and Oklahoma had the biggest percentage output increases relative to February. On a YoY basis, all states except New Mexico had a lower output than last year. Note also that New Mexico surpassed North Dakota in output and moved into second place.

Rig additions continued in the US from the August low of 172 to 359 in the last week of May. Over the last month there is a hint of slowing in rig additions in Texas and the Permian.

Frac spreads continue to increase at an average rate of close to 15.1/mth. 

…click on the above link to read the rest of the article…

  BakkenGulf of MexicoNon-OPEC productionTexasUS Oil Production, peak oil barrel, 

Olduvai IV: Courage
Click on image to read excerpts

Olduvai II: Exodus
Click on image to purchase

Click on image to purchase @ FriesenPress