Home » Posts tagged 'oil rig count'

Tag Archives: oil rig count

Olduvai
Click on image to purchase

Olduvai III: Catacylsm
Click on image to purchase

Post categories

Post Archives by Category

Shale Growth Is Nearing An Inflection Point

Shale Growth Is Nearing An Inflection Point

Pioneer drilling

Drilling activity has plateaued in much of the U.S., with the rig count zig-zagging well below the peak from last November.

The rig count often rises and falls in response to oil prices, but on a several-month lag. It takes some time before oil companies make drilling decisions in response to major price movements. As such, the price meltdown in the fourth quarter of 2018 is still working its way through the system.

But the U.S. shale industry has already begun to tap the brakes. Total U.S. oil rigs are stood at 853 for the week ending on February 22, down from a peak of 888 in November. In particular, the Permian – often held up as the most profitable and prolific shale basin – has seen the rig count decline to a nine-month low.

Production continues to rise, to be sure, but the growth rate could soon flatten out. “We estimate that the y/y change in US oil drilling will, for the first time since 2016, turn negative by late May, should the current trend of gentle declines continue,” Standard Chartered analysts led by Paul Horsnell wrote in a note.

(Click to enlarge)

At the same time, oil prices are rising again, and are up roughly 25 percent since the start of the year. If WTI tops $60, many shale drillers could find themselves feeling confident all over again, and could pour money and rigs back into the field.

That said, multiple drillers have laid out more conservative and restrained drilling programs, facing pressure from shareholders not to overspend. According to Bloomberg and RS Energy Group, U.S. E&Ps have trimmed their spending plans by 4 percent on average, while at the same time they still expect production to grow by 7 percent.

 …click on the above link to read the rest of the article…

U.S. Rig Count Continues To Rise As Canadian Rig Count Plunges

U.S. Rig Count Continues To Rise As Canadian Rig Count Plunges

Sunset oil rig

Baker Hughes reported another 5-rig increase to the number of oil and gas rigs this week.

The total number of oil and gas rigs now stands at 995, which is an addition of 186 rigs year over year.

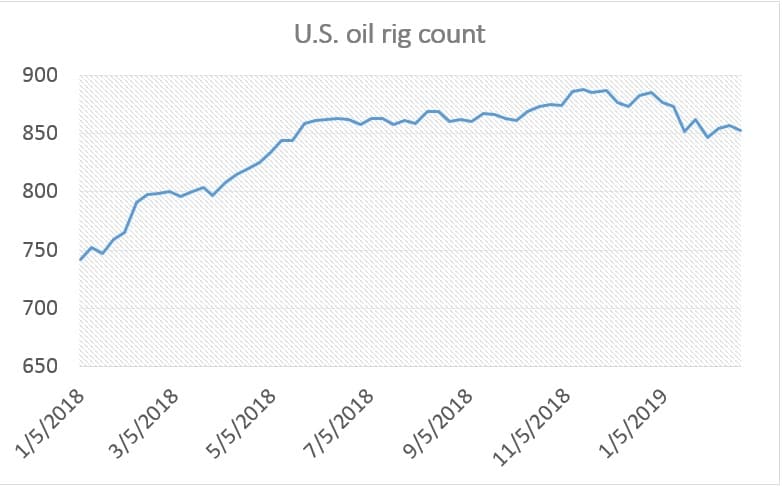
The number of oil rigs in the United States increased by 4 this week, for a total of 804 active oil wells in the U.S.—a figure that is 152 more rigs than this time last year. The number of gas rigs rose by 1 this week, and now stands at 190; 35 rigs above this week last year.

The oil and gas rig count in the United States has increased by 71 in 2018.

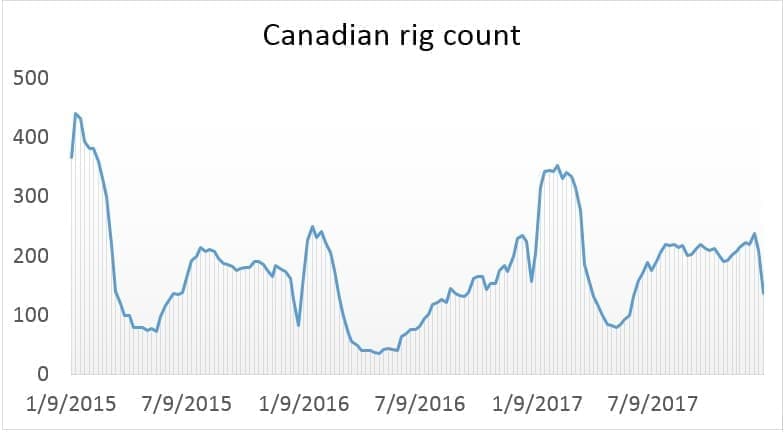
Canada continued its severe losing streak, with a decrease of 58 oil and gas rigs, after losing 54 rigs on top last week, and a 29-rig loss the week before. At 161 total rigs, Canada now has 84 fewer rigs than it did a year ago.

Oil prices managed to climb substantially this week and were up again today prior to data release as the Saudi Energy Minister, Khalid al-Falih, said that he expected the production cuts to last into 2019. Other factors buoying prices are tensions in the Middle East after Saudi Arabia insisted that it would pursue nuclear power plans with or without the support of the United States, and would even work on developing nuclear weapons should Iran do the same. Weighing on prices this week is U.S. crude oil production, which continued its uptick in the week ending March 16, reaching 10.407 million bpd.

…click on the above link to read the rest of the article…


What’s Behind The Canadian Rig Count Crash

What’s Behind The Canadian Rig Count Crash

oil rig

The U.S. rig count has been on the rise for months, despite some recent hiccups, but Canada’s rig count recently plunged amid low oil prices.

Canada’s rig count fell from 210 to 136 for the week ending on December 29, a massive drop off. That took the rig count to a six-month low. Obviously, the losses were concentrated in Alberta, where most of the rigs tend to be. Alberta’s rig count sank from 162 to 118 in the last week of 2017. But Saskatchewan also saw its rig count decimated—falling from 43 in mid-December to just three at the close of the year.

The losses can likely be chalked up to the meltdown in prices for Canadian oil. Western Canada Select (WCS), a benchmark that tracks heavy oil in Canada, often trades at a significant discount to oil prices in the United States. But the WCS-WTI discount became unusually large in November and December for a variety of reasons. The outage at the Keystone pipeline led to a rapid buildup in oil inventories in Canada, and storage hit a record high in December.

Also, Canada’s oil industry has been unable to build new pipelines to get the landlocked oil from Alberta to market. Alberta oil producers are essentially hostage to their buyers in the U.S., and with oil production now bumping up against a ceiling in terms of pipeline capacity, the glut is starting to weigh on WCS prices.

In December, Enbridge announced that it will ration the space on its Mainline oil pipeline system for January as Canada’s pipelines are essentially at full capacity. Enbridge said that it will apportion lines 4 and 67, which move heavy crude, by 36 percent. The term “apportionment” is a euphemism for rationing—essentially oil producers are unable to get all of their product onto the pipeline and are hit with restrictions. That means the oil has to be diverted into storage.

…click on the above link to read the rest of the article…

North Dakota Oil Production Declining But Slowly

North Dakota Oil Production Declining But Slowly

North Dakota BPD

Bakken crude oil production was down 7,743 bpd in March while all North Dakota production was down 9,846 barrels per day.

From the Director’s Cut:

Producing Wells 
February    13,017 
March       13,024 (preliminary) (all-time high was Oct 2015 13,190) 
Permitting
February    70 drilling and 1 seismic 
March       56 drilling and 4 seismic
April       66 drilling and 0 seismic (all time high was 370 in 10/2012) 

ND Sweet Crude Price
February    $18.07/barrel 
March       $26.62/barrel 
April       $26.87/barrel 
Today       $33.00/barrel (all-time high was $136.29 7/3/2008) 

Rig Count 
February    40 
March     32
April       29 
Today’s rig count is 27 (lowest since July 2005 when it was 27)(all-time high was 218 on 5/29/2012) 

Comments: 

The drilling rig count fell 8 from February to March, 3 from March to April, and 2 more from April to today.  Operators remain committed to running the minimum number of rigs while oil prices remain below $60/barrel WTI.  The number of well completions fell from 64(final) in February to 59(preliminary) in March.  Oil price weakness is the primary reason for the slow-down and is now anticipated to last into at least the third quarter of this year and perhaps into the second quarter of 2017.  There were no significant precipitation events, 4 days with wind speeds in excess of 35 mph (too high for completion work), and no days with temperatures below -10F.

Over 98% of drilling now targets the Bakken and Three Forks formations.

Estimated wells waiting on completion services is 920, up 13 from the end of February to the end of March. Estimated inactive well count is 1,523, up 84 from the end of February to the end of March. 

Bakken Bpd 2

Looking at the longer term chart we can see that the increase in production beginning in around 2011 was very steep while the decline has been less dramatic.
Bakken Change

…click on the above link to read the rest of the article…


International Rig Counts Still Falling

International Rig Counts Still Falling

BH Total Intl.

Total international rig count was down 14 rigs from November to December. From December 2014 to December 2015 rig count was down 218 rigs or 16.6 percent.

BH Latin America

Latin America was down 14 rigs from November and down 99 rigs or 26.8 percent since December of 2014.

BH Europe

Europe was up 6 rigs in December but down 34 rigs from December or 23 percent from December 2014.

BH Africa

Africa was up 1 rig in December but down 47 rigs or 34.1 percent since December 2014.

BH Middle East

The Middle East was up 3 rigs in December and up 19 rigs or 19 percent since December 2014.

BH Asia Pacific

Asia Pacific was down 10 rigs in December and down 57 rigs or 22.4 percent since December 2014.

BH Total World

Baker Hughes Total World is just Total International plus the US and Canada. It still does not include any FSU nation or on shore China.

…click on the above link to read the rest of the article…

Oil Rigs Down Almost Universally

Oil Rigs Down Almost Universally

All rig count data is provided by Baker Hughes. All monthly charts are oil rigs only. Gas rigs are not included in the count. The last data point for all monthly charts is April 2015.

When I talk about “peaks” in this post I am only speaking of the peak since 2011 and am not suggesting that there were not higher peaks in previous years.

(Click all charts for larger version)

InternationalRigCount

The International Rig Count has fallen by 150 rigs, from 1,080 in July 2014 to 930 in April 2015. This count does not include the USA, Canada or any of the FSU countries.

EuropeanRigCount

The European Oil Rig Count dropped from 96 in October and November to 65 in April.

AfricanRigCount

The African Rig count peaked at 123 in February and dropped to 88 in April.

…click on the above link to read the rest of the article…


Saudi Arabia’s Oil-Price War Is With Stupid Money

Saudi Arabia’s Oil-Price War Is With Stupid Money

Saudi Arabia is not trying to crush U.S. shale plays. Its oil-price war is with the investment banks and the stupid money they directed to fund the plays. It is also with the zero-interest rate economic conditions that made this possible.

Saudi Arabia intends to keep oil prices low for as long as possible. Its oil production increased to 10.3 million barrels per day in March 2015. That is 700,000 barrels per day more than in December 2014 and the highest level since the Joint Organizations Data Initiative began compiling production data in 2002 (Figure 1 below). And Saudi Arabia’s rig count has never been higher.

Chart_Saudi Prod & Brent Ap 2015

Figure 1. Saudi Arabian crude oil production and Brent crude oil price in 2015 U.S. dollars. Source: U.S. Bureau of Labor Statistics, EIA and Labyrinth Consulting Services, Inc.

Market share is an important part of the motive but Saudi Minister of Petroleum and Mineral Resources Ali al-Naimi recently emphasized that “The challenge is to restore the supply-demand balance and reach price stability.” Saudi Arabia’s need for market share and long-term demand is best met with a growing global economy and lower oil prices.

That means ending the over-production from tight oil and other expensive plays (oil sands and ultra-deep water) and reviving global demand by keeping oil prices low for some extended period of time. Demand has been weak since the run-up in debt and oil prices that culminated in the Financial Collapse of 2008 (Figure 2 below).


…click on the above link to read the rest of the article…

Total Rig Count Decline Fastest Since 1986 As Weekly Rig Count Drop Re-Accelerates

Total Rig Count Decline Fastest Since 1986 As Weekly Rig Count Drop Re-Accelerates

With crude production and inventories hitting record highs this week, it is likely no surprise that rig counts continued to decline – falling 40 to 988 total rigs  (and down 42 to 760 oil rigs). This is the 18th week in a row of total rig count declines – equal to the record series from 2008/9. At 48.5%, this is the biggest 18-week decline since 1986.

  • *U.S. TOTAL RIG COUNT DOWN 40 TO 988 , BAKER HUGHES SAYS
  • *U.S. OIL RIG COUNT DOWN 42 TO 760, BAKER HUGHES SAYS
  • Notably Arkansas and Kansas saw rig counts increase (8 to 9 and 12 to 13 respectively)

The weekly pace of decline has accelerated…


This is the biggest 18-week plunge since 1986…


And Production re-accelerates (US and Saudi oil production record high, Iraq and Libya also boosted production in March) even as rig count collapses…


And Crude’s initial response…Nothing


Charts: Bloomberg


Deciphering The Latest Rig Count Data

Deciphering The Latest Rig Count Data

The main take-away from this week’s rig count is that everything is on track for lower U.S. oil production by mid-year. The weekly changes vary but the overall trend since October is down and that is positive for achieving a better balance between supply and demand.

Please remember the following points and read my previous post “Oil Prices Don’t Change Because of Rig Count” if you haven’t already:

• Rig count is only one indicator of future production trends. 
• Week-to-week changes are not critical but trends may become important.
• Horizontal rigs are more important than vertical rigs.
• Bakken, Eagle Ford and Permian basin are the most important plays for tight oil production in the U.S.

This week, the overall rig count was down 75 compared with 43 rigs last week. The horizontal rig count was down 51 compared with 33 rigs last week.

The Eagle Ford Shale play lost 9 horizontal rigs this week, the Permian lost 15 and the Bakken lost 3 rigs.

RigCountChangeTable

Rig Count Change Table. Source: Baker-Hughes, Labyrinth Consulting Services, Inc.

(Click to enlarge)

Related: Oil Price Crash A Blessing In Disguise For US Shale

The Bakken horizontal rig count is down 40% from its maximum in 2014. The Permian basin horizontal rig count is down 33% and the Eagle Ford is down 30%.


…click on the above link to read the rest of the article…

Rig Count Decline Re-Accelerates To 2nd Biggest Drop In 22 Years

Rig Count Decline Re-Accelerates To 2nd Biggest Drop In 22 Years

Following last week’s slowing in the pace of rig count, crude prices dropped and then spiked, and it makes today’s data under more scrutiny. At around $49.50, WTI prices have round-tripped back almost perfectly to the scene of the crime before today’s rig count data hit. The total oil rig count dropped almost 6%, down 75 to 1,192 meaning a re-acceleration of the rig count decline and the 2nd biggest drop since 1993.

  • *U.S. TOTAL RIG COUNT -75 To 1,192 , BAKER HUGHES SAYS
  • *U.S. OIL RIG COUNT -64 TO 922, BAKER HUGHES SAYS

2nd biggest rig count decline since 1993

Total rig count has now dropped 38% in the last 13 weeks – just shy of the move in 2009…


…click on the above link to read the rest of the article…

Oil Prices Don’t Change Because of Rig Count

Oil Prices Don’t Change Because of Rig Count

Oil prices don’t change based on weekly rig count reports.

Yet every week, there are proclamations by analysts that oil prices are poised to recover because of some change in the Baker Hughes North American rig count. Others state that U.S. tight oil production will continue to rise despite falling rig counts because of the miracle of shale rig efficiency.

What this really means is that nobody has any idea about when oil prices will rebound. As I have previously written, that is because nothing has happened so far to cause a change in oil prices.

What can we learn from rig counts?  The weekly U.S. rig count is another data point that, along with other data points, can help us to see potential trends while we wait for something meaningful to happen that causes oil prices to rise…or to fall farther. But we have to do some work with the data before we can hope to get anything from the rig count and, even then, we must not read too much into it.

First, the total North American or U.S. rig count is a practically meaningless number. Rig counts rise and fall all the time whether prices are rising or falling.  In the chart below, the rig count shown in red changed weekly whether oil prices were rising or falling.


…click on the above link to read the rest of the article…

The Fracking Bust Exacts its Pound of Flesh

The Fracking Bust Exacts its Pound of Flesh

Breath-taking booms and obliterating busts have made the oil and gas business. Booms draw money, which begets more money, which allows for technologies to be invented or perfected, and it builds enthusiasm that turns into blind faith among investors, and they throw more money at it. The money gets drilled into the ground. The debt remains on the balance sheet. Production soars. Demand doesn’t keep up. Storage levels rise. The price begins to plunge. And all heck breaks loose.

The fracking bust didn’t start last summer when the price of oil began to skid. It started in October and has progressed with phenomenal rapidity. In the latest week, according to Baker Hughes, which publishes the data every Friday, drillers idled an additional 33 oil rigs. Only 986 rigs were still active, down 38.7% from October, when they’d peaked at 1,609. In a period of 20 weeks, drillers have cut the number of rigs drilling for oil by 623, the steepest, deepest rig-count nose dive in the data series:

US-rig-count_1988_2015-02-27=oil

The result should be lower oil production.

…click on the above link to read the rest of the article…


Oil Price Crash – What Next?

Oil Price Crash – What Next?

In the fast moving oil market much of the fundamental data only becomes available for general consumption at least one month in arrears. But EIA oil price data and Baker Hughes rig counts are available weekly and with much action going on it is worthwhile updating.

The price plunge seems to have reversed, at least for the time being (more on that below). But the most stunning data is the free fall in US oil drilling rigs shown in Figure 1, down 553 (34%) from the October top. The IEA also published their Oil Market Report early this month, on 10th February, reporting oil supplies were down 235,000 bpd in January, mainly in OPEC countries Iraq and Libya.

USOilRigCount

Figure 1 The US oil rig count is down to 1056 rigs from a peak of 1609 in October last year. The gas rig count continues to inch downwards slowly. The collapse in US shale oil drilling, that looks set to continue, must lead to US oil production decline in the months ahead.

DailyOilPrice

Figure 2 The bounce in the oil price is as sharp as the crash and is difficult to see at this scale. Hence, move on to Figure 3.

…click on the above link to read the rest of the article…


Essential Oil Production Statistics – February 2015

Essential Oil Production Statistics – February 2015

This is the second in a monthly series of posts chronicling the action in the global oil market in 12 key charts. The January 2015 post is hereEIA oil price and Baker Hughes rig count charts are updated to end January 2015, the remaining oil production charts are updated to December 2014 using the IEA OMR data. The main oil production changes from November to December are:

  • World total liquids up 150,000 bpd
  • OPEC up 80,000 bpd
  • N America up 80,000 bpd
  • Russia and FSU up 180,000 bpd
  • Europe down 70,000 bpd (compared with December 2013)
  • Asia down 60,000 bpd

1. The continued growth in production into December shows that global production growth had significant momentum that has not yet been curtailed by the price rout.
2. The fall in the oil price continued throughout January, WTI hitting a low of $44.80 on January 26th and Brent hitting a low of $45.13 on January 13th.
3. The main dynamic statistic has been the plunge in US oil rig count down to 1223 rigs on January 30th from a recent high of 1609 rigs on October 10th 2014.
4. The rig count news led to a strong rally in oil price on 30th January.
5. I anticipate that the price rout is not yet over and it will require significant falls in production to take root before a real price recovery gets underway.

…click on the above link to read the rest of the article…


What The Rig Plunge Really Means For The Price Of Oil

What The Rig Plunge Really Means For The Price Of Oil

Arguably the biggest catalyst for the surge in crude, in addition to the technical move which started off with a vicious short squeeze into the NYMEX close last Friday, was last week’s record drop in the Baker Hughes rig count to 1,223, down from 1,609 just three months earlier. That, coupled with the ever louder reports of majors and all other energy companies cutting CapEx, has led some to believe that the supply imbalance is finally starting to normalize, and that production in the coming months will sharply drop off. However, as Morgan Stanley’s Adam Longson explains, that is not nearly the case.

Here are his big picture thoughts on what the recent rig count drop relaly means:

…click on the above link to read the rest of the article…


Olduvai IV: Courage
Click on image to read excerpts

Olduvai II: Exodus
Click on image to purchase

Click on image to purchase @ FriesenPress