Home » Posts tagged 'Global'

Tag Archives: Global

Olduvai
Click on image to purchase

Olduvai III: Catacylsm
Click on image to purchase

Post categories

Post Archives by Category

What happened to crude oil production after the first peak in 2005?

What happened to crude oil production after the first peak in 2005?

The IEA (in Paris) proudly announced in its latest September 2018 Monthly Oil Market Report that global supplies (of liquids) have reached 100 mb/d in August, an impressive figure. What matters, however, is crude oil production, something the IEA does not show in its monthly reports (only OPEC’s crude oil production is given). We therefore look at data of the US Energy Information Administration EIA which go up to May 2018 at the time of writing this article.

As shown in Fig 1, it is clear that the world’s crude production had a distinctive kink in 2005 which looked like a peak at the time of the financial crisis 2008/09. So what has happened since then? How successful was money printing to rescue the oil production system?

World_crude_production_1994-May2018

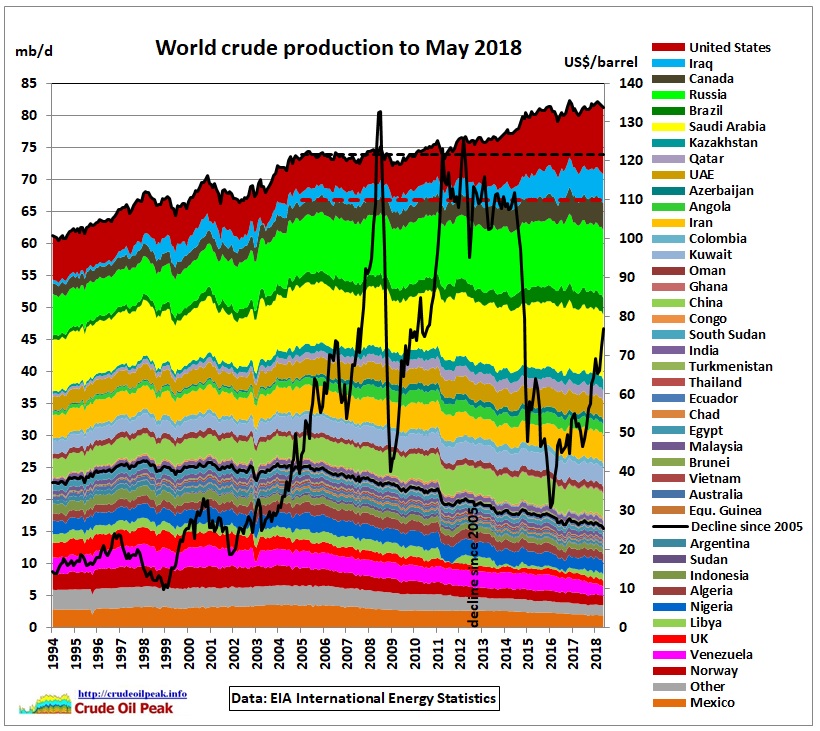
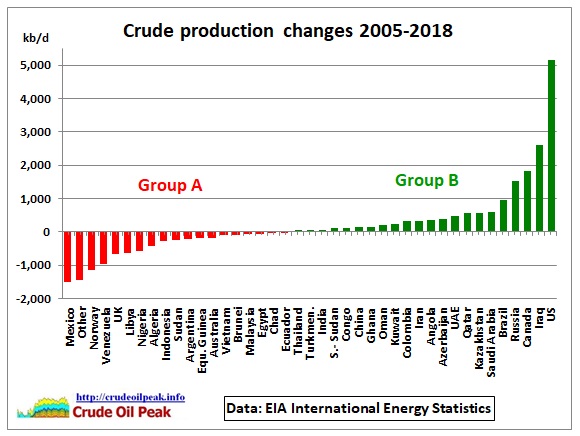
In Fig 1, countries are stacked in the order given in Fig 2 where on the left we have countries which have declined since 2005 (red columns group A) and on the right we have countries which increased production after 2005 (green columns group B)

Crude_prod_changes_2005-May_2018

Group A
Countries where average oil production Jan-May 2018 was lower than the average in 2005. At the bottom is Mexico with the highest rate of decline. This group started to peak in 1997, entering a long bumpy production plateau at around 25 mb/d, ending – you guessed it – in 2005. This is down now to 16 mb/d, a decline of 700 kb/d pa (-2.8% pa).
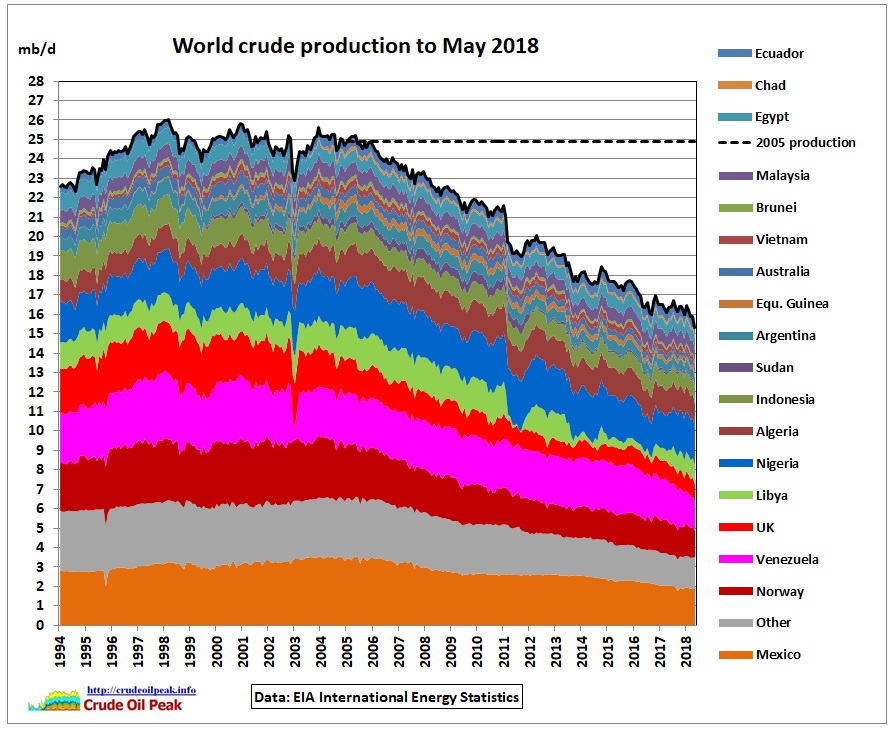
Decline-group_1994-May2018

Group B

Countries where average oil production Jan-May 2018 was higher than the average in 2005. At the top of the stack are Iraq and the US, where growth was highest. Group B compensated for the decline in group A and provided for growth above the red dashed line in Fig 1.
The 2018 data have not been seasonally adjusted.

In group B we have a subgroup of countries which peaked after 2005

…click on the above link to read the rest of the article…


Economic Collapse Is Erupting All Over The Planet As Global Leaders Begin To Panic

Economic Collapse Is Erupting All Over The Planet As Global Leaders Begin To Panic

Earth Ready To Explode - Public DomainMainstream news outlets are already starting to use the phrase “economic collapse” to describe what is going on in some areas of our world right now.  For many Americans this may seem a bit strange, but the truth is that the worldwide economic slowdown that began during the second half of last year is starting to get a lot worse.  In this article, we are going to examine evidence of this from South America, Europe, Asia and North America.  Once we are done, it should be obvious that there is absolutely no reason to be optimistic about the direction of the global economy right now.  The warnings of so many prominent experts are now becoming a reality, and what we have witnessed so far are just the early chapters of a crushing economic crisis that will affect every man, woman and child in the entire world.

Let’s start with Brazil.  It has the 7th largest economy on the entire planet, and it is already enduring its worst recession in 25 years.  In fact, at the end of last year Goldman Sachs said that what was going on down there was actually a “depression“.

But now the crisis in Brazil has escalated significantly.

I want to share with you an excerpt from a recent article entitled “Brazil: Economic collapse worse than feared“.  I know, that title sounds like it comes directly from The Economic Collapse Blog, but I didn’t write it.

It actually comes from CNN

Amid political chaos, Brazil’s economic collapse is worse than its government once believed.

In the midst of rising calls to impeach President Dilma Rousseff, Brazil’s central bank announced Thursday that it now expects the country’s economy to shrink 3.5% this year.

…click on the above link to read the rest of the article…

21 New Numbers That Show That The Global Economy Is Absolutely Imploding

21 New Numbers That Show That The Global Economy Is Absolutely Imploding 

Earth At Night - Public DomainAfter a series of stunning declines through the month of January and the first half of February, global financial markets seem to have found a patch of relative stability at least for the moment.  But that does not mean that the crisis is over.  On the contrary, all of the hard economic numbers that are coming in from around the world tell us that the global economy is coming apart at the seams.  This is especially true when you look at global trade numbers.  The amount of stuff that is being bought, sold and shipped around the planet is falling precipitously.  So don’t be fooled if stocks go up one day or down the next.  The truth is that we are in the early chapters of a brand new economic meltdown, and I believe that all of the signs indicate that it will continue to get worse in the months ahead.  The following are 21 new numbers that show that the global economy is absolutely imploding…

#1 Chinese exports fell by 11.2 percent year over year in January.

#2 Chinese imports were even worse in January.  On a year over year basis, they declined a whopping 18.8 percent.

#3 It may be hard to believe, but Chinese imports have now plunged for 15 months in a row.

#4 In India, exports were down 13.6 percent on a year over year basis in January.

#5 In Japan, exports declined 8 percent in December on a year over year basis, while imports plummeted 18 percent.

#6 For the sixth time in six years, Japanese GDP growth has gone negative.

#7 In the United States, exports were down 7 percent on a year over year basis in December.

#8 U.S. factory orders have fallen for 14 months in a row.

#9 The Restaurant Performance Index in the United States has dropped to the lowest level that we have seen since 2008.

…click on the above link to read the rest of the article…

World outside US and Canada doesn’t produce more crude oil than in 2005

World outside US and Canada doesn’t produce more crude oil than in 2005

After a delay of several months the US Energy Information Administration has published the latest international energy statistics for October 2015

This is an opportunity to update crude oil graphs
http://crudeoilpeak.info/latest-graphs

Fig 1: World’s incremental crude oil production

How Fig 1 is created: for each country, the minimum production in the period Jan 2001 (original IPS start month) to October 2015 is taken (=base production) and deducted from the country’s total production, giving the incremental production which is then stacked in a way that allows to interpret which changes occurred. The stacking order is:

(a)    Base production
(b)   Countries with growing production
(c)    Countries with flat, peaking or declining production
(d)   OPEC and Middle East countries
(e)    Canada (mainly tar sands)
(f)    United States (mainly shale oil)

The numbers denote following events:

(1)   Venezuela strike
(2)   Iraq peak oil war
(3)   Saudi production declines
(4)   High demand for China Olympic Games
(5)   Iran sanctions introduced
(6)   Iraq reaches pre-war production level
(7)   US shale oil boom takes off

The red horizontal line is the maximum crude oil production level in May 2005 (the Katrina year). We can see that almost all additional oil produced now above that level is US shale oil. In other words: without US shale oil (which required cheap money from quantitative easing), the world would be in a deep oil crisis.

The grey line shows the September 2005 production level outside the US and Canada. The graph shows that the October 2015 production level is only slightly higher than in 2005, possibly within the accuracy of statistics.

We can therefore confidently say that growth of the world economy managed to make itself completely dependent on unconventional oil from the US and Canada.

…click on the above link to read the rest of the article…

Global Stocks Continue To Crash As Oil Plummets And Gold Skyrockets

Global Stocks Continue To Crash As Oil Plummets And Gold Skyrockets

Clock Image - Public DomainStock markets around the world continue to collapse as this new global financial crisis picks up more steam.  In the U.S., the Dow lost 254 more points on Thursday, and it has now fallen for five days in a row.  European stocks continued to get obliterated, and financial institutions are leading the way.  But this week what is happening in Japan has been the most sobering.  After falling 918 pointsthe other day, the Nikkei plunged another 760 points early on Friday.  The Nikkei has now fallen for seven of the past eight days, and investors in Japan are in full panic mode.  Overall, global stocks are well into bear market territory, and nearly 17 trillion dollars of global stock market wealth has already been wiped out.

As panic rises, investors are seeking alternative investments.  On Thursday, the price of gold hit $1,260 an ounce at one point before settling back a bit.  But even with the fade at the end of the day, it was still the biggest daily gain in more than two years.  Overall, gold is having its best quarterly performance in 30 years.

Whenever a financial crisis happens, investors seek out safe havens such as gold that can help them weather the storm.  In particular, demand for physical gold is going through the roof all over the planet.  Just check out the following excerpt from a Telegraph article entitled “Investors ‘go bananas’ for gold bars as global stock markets tumble“…

BullionByPost, Britain’s biggest online gold dealer, said it has already taken record-day sales of £5.6m as traders pile into gold following fears the world is on the brink of another financial crisis.

Rob Halliday-Stein, founder and managing director of the Birmingham-based company, said takings today had already surpassed the firm’s previous one-day record of £4.4m in October 2014.

…click on the above link to read the rest of the article…

Lowest Ever: The Baltic Dry Index Plunges To 394 As Global Trade Grinds To A Standstill

Lowest Ever: The Baltic Dry Index Plunges To 394 As Global Trade Grinds To A Standstill

Container Ship - Public DomainFor the first time ever, the Baltic Dry Index has fallen under 400.  As I write this article, it is sitting at 394.  To be honest, I never even imagined that it could go this low.  Back in early August, the Baltic Dry Index was sitting at 1,222, and since then it has been on a steady decline.  Of course the Baltic Dry Index crashed hard just before the great stock market crash of 2008 too, but at this point it is already lower than it was during that entire crisis.  This is just more evidence that global trade is grinding to a halt and that 2016 is going to be a “cataclysmic year” for the global economy.

If you are not familiar with the Baltic Dry Index, here is a helpful definition from Wikipedia

The Baltic Dry Index (BDI) is an economic indicator issued daily by the London-based Baltic Exchange. Not restricted to Baltic Sea countries, the index provides “an assessment of the price of moving the major raw materials by sea. Taking in 23 shipping routes measured on a timecharter basis, the index covers HandysizeSupramaxPanamax, and Capesize dry bulk carriers carrying a range of commodities including coaliron ore and grain.”

The BDI is one of the key indicators that experts look at when they are trying to determine where the global economy is heading.  And right now, it is telling us that we are heading into a major worldwide economic downturn.

Some people try to dismiss the recent drop in the Baltic Dry Index by claiming that shipping rates are down because there is simply too much capacity out there these days.  And I don’t dispute that.  Without a doubt, too many vessels were built during the “boom years”, and now shipbuilders are paying the price.

…click on the above link to read the rest of the article…

The Rate Hike Stock Market Crash Has Thrown Gasoline Onto An Already Raging Global Financial Inferno

The Rate Hike Stock Market Crash Has Thrown Gasoline Onto An Already Raging Global Financial Inferno

Inferno - Public DomainIf the stock market crash of last Thursday and Friday had all happened on one day, it would have been the 7th largest single day decline in U.S. history.  On Friday, the Dow Jones Industrial Average was down 367 points after finishing down 253 points on Thursday.  The overall decline of 620 points between the two days would have been the 7th largest single day stock market crash ever experienced in the United States if it had happened within just one trading day.  If you will remember, this is precisely what I warned would happen if the Federal Reserve raised interest rates.  But when news of the rate hike first came out on Wednesday, stocks initially jumped.  This didn’t make any sense at all, and personally I was absolutely stunned that the markets had behaved so irrationally.  But then we saw that on Thursday and Friday the markets did exactly what we thought they would do.  The chief economist at Gluskin Sheff, David Rosenberg, is calling the brief rally on Wednesday “a head-fake of enormous proportions“, and analysts all over Wall Street are bracing for what could be another very challenging week ahead.

When the Federal Reserve decided to lift interest rates, they made a colossal error.  You don’t raise interest rates when a global financial crisis has already started.  That is absolutely suicidal.  It is the kind of thing that you would do if you were trying to bring down the global financial system on purpose.

…click on the above link to read the rest of the article…

Guess What Happened The Last Time The Price Of Oil Plunged Below 38 Dollars A Barrel?

Guess What Happened The Last Time The Price Of Oil Plunged Below 38 Dollars A Barrel?

Question Mark Burning - Public DomainOn Monday, the price of U.S. oil dropped below 38 dollars a barrel for the first time in six years.  The last time the price of oil was this low, the global financial system was melting down and the U.S. economy was experiencing the worst recession that it had seen since the Great Depression of the 1930s.  As I write this article, the price of U.S. oil is sitting at $37.65.  For months, I have been warning that the crash in the price of oil would be extremely deflationary and would have severe consequences for the global economy.  Nations such as Japan, Canada, Brazil and Russia have already plunged into recession, and more than half of all major global stock market indexes are down at least 10 percent year to date.  The first major global financial crisis since 2009 has begun, and things are only going to get worse as we head into 2016.

The global head of oil research at Societe Generale, Mike Wittner, says that his “head is spinning” after the stunning drop in the price of oil on Monday.  Just like during the last financial crisis, we have broken the psychologically important 40 dollar barrier, and there are concerns that we could go much lower from here…

Price Of Oil - Public Domain

One analyst told CNBC that he believes that we could soon see the price of U.S. oil go all the way down to 32 dollars a barrel…

“We’re in a tug-of-war between a heavily shorted market and a glut of oil in the U.S. and globally, as Saudi Arabia continues to produce oil at elevated levels to maintain market share,” said Chris Jarvis at Caprock Risk Management, an energy markets consultancy in Frederick, Maryland.

“Couple this with a strengthening dollar as the market anticipates a U.S. rate hike this month, oil is heading lower with a near term target of $32 for WTI.”

…click on the above link to read the rest of the article…

Alarm Bells Go Off As 11 Critical Indicators Scream The Global Economic Crisis Is Getting Deeper

Alarm Bells Go Off As 11 Critical Indicators Scream The Global Economic Crisis Is Getting Deeper

Alarm Clock - Public DomainEconomic activity is slowing down all over the planet, and a whole host of signs are indicating that we are essentially exactly where we were just prior to the great stock market crash of 2008.  Yesterday, I explained that the economies of Japan, Brazil, Canada and Russia are all in recession.  Today, I am mainly going to focus on the United States.  We are seeing so many things happen right now that we have not seen since 2008 and 2009.  In so many ways, it is almost as if we are watching an eerie replay of what happened the last time around, and yet most of the “experts” still appear to be oblivious to what is going on.  If you were to make up a checklist of all of the things that you would expect to see just before a major stock market crash, virtually all of them are happening right now.  The following are 11 critical indicators that are absolutely screaming that the global economic crisis is getting deeper…

#1 On Tuesday, the price of oil closed below 40 dollars a barrel.  Back in 2008, the price of oil crashed below 40 dollars a barrel just before the stock market collapsed, and now it has happened again.

#2 The price of copper has plunged all the way down to $2.04.  The last time it was this low was just before the stock market crash of 2008.

#3 The Business Roundtable’s forecast for business investment in 2016 has dropped to the lowest level that we have seen since the last recession.

#4 Corporate debt defaults have risen to the highest level that we have seen since the last recession.  This is a huge problem because corporate debt in the U.S. has approximately doubled since just before the last financial crisis.


…click on the above link to read the rest of the article…

20 Reasons Why All The People That Quit Prepping After September Are Dead Wrong

20 Reasons Why All The People That Quit Prepping After September Are Dead Wrong

Wrong Way - Public DomainMillions of Americans were gearing up for some huge event to happen in September, but the world didn’t end and now many of them have given up entirely on prepping.  Of course the truth is that some absolutely earth-shattering events did take place last month, but because September did not play out exactly as some were anticipating, a lot of people feel very let down.  My contacts in the emergency food industry tell me that sales have dropped off dramatically, and yesterday I was told by someone that I trust that the same is true for those that sell precious metals.  But this should not be happening.  What we witnessed in August and September was just the warm up act, and all of the numbers are absolutely screaming at us that we are right on track for a major global crisis.  In this article I am going to focus on economic and financial issues, but there are so many other things going on around the planet right now that threaten to throw our world into turmoil.  Anyone that thinks that it is safe to “relax” now is simply not paying attention.  The following are 20 reasons why all the people that quit prepping after September are dead wrong…

#1 U.S. exports are down 11 percent for the year so far.  The only other times they have fallen this dramatically since the turn of the century were during the last two recessions.

#2 Since March, the amount of stuff being shipped by truck, rail and air inside the United States has been falling every single month on a year over year basis.  This is a clear indication that economic activity is really slowing down.

#3 Wholesale sales in the U.S. have fallen to the lowest level since the last recession.

…click on the above link to read the rest of the article…

The Bankruptcy Of The Planet Accelerates – 24 Nations Are Currently Facing A Debt Crisis

The Bankruptcy Of The Planet Accelerates – 24 Nations Are Currently Facing A Debt Crisis

Dominoes - Public DomainThere has been so much attention on Greece in recent weeks, but the truth is that Greece represents only a very tiny fraction of an unprecedented global debt bomb which threatens to explode at any moment.  As you are about to see, there are 24 nations that are currently facing a full-blown debt crisis, and there are 14 more that are rapidly heading toward one.  Right now, the debt to GDP ratio for the entire planet is up to an all-time record high of 286 percent, and globally there is approximately 200 TRILLION dollars of debt on the books.  That breaks down to about $28,000 of debt for every man, woman and child on the entire planet.  And since close to half of the population of the world lives on less than 10 dollars a day, there is no way that all of this debt can ever be repaid.  The only “solution” under our current system is to kick the can down the road for as long as we can until this colossal debt pyramid finally collapses in upon itself.

As we are seeing in Greece, you can eventually accumulate so much debt that there is literally no way out.  The other European nations are attempting to find a way to give Greece a third bailout, but that is like paying one credit card with another credit card because virtually everyone in Europe is absolutely drowning in debt.

Even if some “permanent solution” could be crafted for Greece, that would only solve a very small fraction of the overall problem that we are facing.  The nations of the world have never been in this much debt before, and it gets worse with each passing day.

According to a new report from the Jubilee Debt Campaign, there are currently 24 countries in the world that are facing a full-blown debt crisis


…click on the above link to read the rest of the article…


Asia depends on Middle East for 66 % of its oil imports

Asia depends on Middle East for 66 % of its oil imports

This post uses data from the inter area oil movement section of the BP Statistical Review published in June 2015. It is a continuation of an earlier post on Asian oil consumption and production

Global trade and Asia’s share

Total global oil trade steadily increased by 4.7% pa up to the US recession year of 2007, stagnated through the financial crisis but resumed growth in 2010, albeit at a much lower rate of 1.4% pa. In 2014, growth was only 0.5% while the volume of trade reached a record high of 56.7 mb/d.

Fig 1: Global oil trade and Asian oil imports

22.9 mb/d (40% of the global total) were imports into Asia, a whopping 9.6 mb/d up from 13.4 mb/d (30%) in 2001. That is +740 kb/d pa. Where did this oil come from?

Fig 2: Asian oil imports as part of global oil trade

Out of these 22.9 mb/d of Asian imports some 15.1 mb/d or 66% came from the Middle East, making Asia absolutely vulnerable to what is happening there.

Fig3: Asia oil imports time series

After the financial crisis in 2009 Asia’s total imports increased by an average of 4.7% pa (2014: 3.4%) while  imports from the Middle East increased by only 2% (2014: 1%).  This means that Asia has diversified its imports into West Africa, the Former Soviet Union, South & Central America and others. The share of the Middle East of total imports has therefore decreased from 73% in 2010 to 66% in 2014.


…click on the above link to read the rest of the article…

16 Facts About The Tremendous Financial Devastation That We Are Seeing All Over The World

16 Facts About The Tremendous Financial Devastation That We Are Seeing All Over The World

Fireball - Devastation - Public DomainAs we enter the second half of 2015, financial panic has gripped most of the globe.  Stock prices are crashing in China, in Europe and in the United States.  Greece is on the verge of a historic default, and now Puerto Rico and Ukraine are both threatening to default on their debts if they do not receive concessions from their creditors.  Not since the financial crisis of 2008 has so much financial chaos been unleashed all at once.  Could it be possible that the great financial crisis of 2015 has begun?  The following are 16 facts about the tremendous financial devastation that is happening all over the world right now…

1. On Monday, the Dow fell by 350 points.  That was the biggest one day decline that we have seen in two years.

2. In Europe, stocks got absolutely smashed.  Germany’s DAX index dropped 3.6 percent, and France’s CAC 40 was down 3.7 percent.

3. After Greece, Italy is considered to be the most financially troubled nation in the eurozone, and on Monday Italian stocks were down more than 5 percent.

4. Greek stocks were down an astounding 18 percent on Monday.

5. As the week began, we witnessed the largest one day increase in European bond spreads that we have seen in seven years.

6. Chinese stocks have already met the official definition of being in a “bear market” – the Shanghai Composite is already down more than 20 percent from the high earlier this year.

7. Overall, this Chinese stock market crash is the worst that we have witnessed in 19 years.

8. On Monday, Standard & Poor’s slashed Greece’s credit rating once again and publicly stated that it believes that Greece now has a 50 percent chance of leaving the euro.

9. On Tuesday, Greece is scheduled to make a 1.6 billion euro loan repayment.  One Greek official has already stated that this is not going to happen.

…click on the above link to read the rest of the article…


Investors Start To Panic As A Global Bond Market Crash Begins

Investors Start To Panic As A Global Bond Market Crash Begins

Panic Keyboard - Public DomainIs the financial collapse that so many are expecting in the second half of 2015 already starting?  Many have believed that we would see bonds crash before the stock market crashes, and that is precisely what is happening right now.  Since mid-April, the yield on 10 year German bonds has shot up from 0.05 percent to 0.89 percent.  But much of that jump has come this week.  Just a couple of days ago, the yield on 10 year German bonds was sitting at just 0.54 percent.  And it isn’t just Germany – bond yields are going crazy all over Europe.  So far, it is being estimated that global investors have lost more than half a trillion dollars, and there is much more room for these bonds to fall.  In the end, the overall losses could be well into the trillionseven before the stock market collapses.

I know that for most average Americans, talk about “bond yields” is rather boring.  But it is important to understand these things, because we could very well be looking at the beginning of the next great financial crisis.  The following is an excerpt from an article by Wolf Richter in which he details the unprecedented carnage that we have witnessed over the past few days…

On Tuesday, ahead of the ECB’s policy announcement today, German Bunds sagged, and the 10-year yield soared from 0.54% to 0.72%, drawing a squiggly diagonal line across the chart. In just one day, yield increased by one-third!

Makes you wonder to which well-connected hedge funds the ECB had once again leaked its policy statement and the all-important speech by ECB President Mario Draghi that the rest of us got see today.

…click on the above link to read the rest of the article…

Olduvai IV: Courage
Click on image to read excerpts

Olduvai II: Exodus
Click on image to purchase

Click on image to purchase @ FriesenPress