Home » Posts tagged 'Financial'

Tag Archives: Financial

Olduvai
Click on image to purchase

Olduvai III: Catacylsm
Click on image to purchase

Post categories

Post Archives by Category

Preparing For A Financial Apocalypse: Insiders Are Selling “$600 Million Of Stock Per Day In August”

Preparing For A Financial Apocalypse: Insiders Are Selling “$600 Million Of Stock Per Day In August”

In the U.S., corporate insiders have been selling stocks at an average rate of 600 million dollars per day during the month of August.  This kind of wild selling indicates that there is a tremendous amount of fear among corporate insiders right now, and such selling would only make sense if a stock market crash is imminent.  And without a doubt, we have already seen volatility return to Wall Street in a major way as our trade war with China has dramatically escalated.  Many Americans are hoping that things will start to calm down and that our trade conflict with China can be resolved calmly, because if things take a bad turn many analysts are warning that we could soon be facing the worst financial crisis since 2008.  Here is one example

Remember the brutal sell-off last year when stocks suffered their worst December since the Great Depression? Something worse than that could happen in days, a Nomura analyst said.

Macro and quant strategist Masanari Takada turned heads earlier this month with his bold call for a “Lehman-like” plunge. He’s sticking with this prediction as market sentiment shows no signs of improving, leading him to believe a monster sell-off could arrive this week.

With chilling forecasts like that being thrown around on a regular basis these days, it is understandable that corporate insiders would be tempted to get out of the market, and right now they are racing for the exits at a pace that is absolutely breathtaking.  The following comes from CNN

Corporate insiders have sold an average of $600 million of stock per day in August, according to TrimTabs Investment Research, which tracks stock market liquidity.

 …click on the above link to read the rest of the article…

Stocks Crater – 3.5 Trillion Dollars In Global Market Cap Wiped Out – China Considers “Dumping U.S. Treasuries”

Stocks Crater – 3.5 Trillion Dollars In Global Market Cap Wiped Out – China Considers “Dumping U.S. Treasuries”

Wall Street responded to our escalating trade war with China by throwing a bit of a temper tantrum.  On Monday the Dow Jones Industrial Average was down 617 points, and that was the worst day for the Dow since January 3rd.  But things were even worse for the Nasdaq.  It had its worst day since December 4th, and overall the Nasdaq is now down 6.3 percent in just the last six trading sessions.  Of course it isn’t just in the United States that stocks are declining.  Since last Monday, a total of approximately $3.5 trillion in market cap has been wiped out on global stock markets.  And since it doesn’t look like we are going to get any sort of a trade deal any time soon, this could potentially be just the beginning of our problems.

China fired a shot that was heard around the world on Monday when they announced that they would be dramatically raising tariffs on U.S. goods

China will raise tariffs on $60 billion in U.S. goods in retaliation for the U.S. decision to hike duties on Chinese goods, the Chinese Finance Ministry said Monday.

Beijing will increase tariffs on more than 5,000 products to as high as 25%. Duties on some other goods will increase to 20%. Those rates will rise from either 10% or 5% previously.

According to CNBC, these new tariffs are going to be particularly damaging for U.S. farmers…

The duties in large part target U.S. farmers, who largely supported Trump in 2016 but suffered from previous shots in the Trump administration’s trade war with China. The thousands of products include peanuts, sugar, wheat, chicken and turkey.

 …click on the above link to read the rest of the article…

We Have Seen This Happen Before The Last 3 Recessions – And Now It Is The Worst It Has Ever Been

We Have Seen This Happen Before The Last 3 Recessions – And Now It Is The Worst It Has Ever Been

Since the last financial crisis, we have witnessed the greatest corporate debt binge in U.S. history.  Corporate debt has more than doubled since then, and it is now sitting at a grand total of more than 9 trillion dollars.  Of course there have been other colossal corporate debt binges throughout our history, and they all ended badly.  In fact, the ratio of corporate debt to U.S. GDP rose above 40 percent prior to each of the last three recessions, but this time around we have found a way to top that.  According to Forbes, the ratio of nonfinancial corporate debt to U.S. GDP is now nearly 50 percent…

Since the last recession, nonfinancial corporate debt has ballooned to more than $9 trillion as of November 2018, which is nearly half of U.S. GDP. As you can see below, each recession going back to the mid-1980s coincided with elevated debt-to-GDP levels—most notably the 2007-2008 financial crisis, the 2000 dot-com bubble and the early ’90s slowdown.

You can see the chart they are talking about right here, and it clearly shows that each of the last three recessions coincided with the bursting of an enormous corporate debt bubble.

This time around the corporate debt bubble is larger than it has ever been before, and risky corporate debt has been growing faster than any other category

Through 2023, as much as $4.88 trillion of this debt is scheduled to mature. And because of higher rates, many companies are increasingly having difficulty making interest payments on their debt, which is growing faster than the U.S. economy, according to the Institute of International Finance (IIF).

On top of that, the very fastest-growing type of debt is riskier BBB-rated bonds—just one step up from “junk.” This is literally the junkiest corporate bond environment we’ve ever seen.

 …click on the above link to read the rest of the article…

The True Size Of The U.S. National Debt, Including Unfunded Liabilities, Is 222 Trillion Dollars

The True Size Of The U.S. National Debt, Including Unfunded Liabilities, Is 222 Trillion Dollars

The United States is on a path to financial ruin, and everyone can see what is happening, but nobody can seem to come up with a way to stop it.  According to the U.S. Treasury, the federal government is currently 22 trillion dollars in debt, and that represents the single largest debt in the history of the planet.  Over the past decade, we have been adding to that debt at a rate of about 1.1 trillion dollars a year, and we will add more than a trillion dollars to that total once again this year.  But when you add in our unfunded liabilities, our long-term financial outlook as a nation looks downright apocalyptic.  According to Boston University economics professor Laurence Kotlikoff, the U.S. is currently facing 200 trillion dollars in unfunded liabilities, and when you add that number to our 22 trillion dollar debt, you get a grand total of 222 trillion dollars.

Of course we are never going to pay back all of this debt.

The truth is that we are just going to keep accumulating more debt until the system completely and utterly collapses.

And even though the federal government is the biggest offender, there are also others to blame for the mess that we find ourselves in.  State and local governments are more than 3 trillion dollars in debt, corporate debt has more than doubled since the last financial crisis, and U.S. consumers are more than 13 trillion dollars in debt.

When you add it all together, the total amount of debt in our society is well above 300 percent of GDP, and it keeps rising with each passing year.

 …click on the above link to read the rest of the article…

Just Before The Great Recession, Mountains Of Unsold Goods Piled Up In U.S. Warehouses – And Now It Is Happening Again

Just Before The Great Recession, Mountains Of Unsold Goods Piled Up In U.S. Warehouses – And Now It Is Happening Again

When economic conditions initially begin to slow down, businesses continue to order goods like they normally would but those goods don’t sell as quickly as they previously did.  As a result, inventory levels begin to rise, and that is precisely what is happening right now.  In fact, the U.S. inventory to sales ratio has risen sharply for five months in a row.  This is mirroring the pattern that we witnessed just prior to the financial crisis of 2008, and it is exactly what we would expect to see if a new recession was now beginning.  In recent weeks, I have been sharing number after number that indicates that a serious economic slowdown is upon us, and many believe that what is coming will eventually be even worse than what we experienced in 2008.

And even though I write about this stuff every day, I was stunned by how rapidly inventory levels have been rising recently.  The following numbers come from Peter Schiff’s website

This comes on the heels of the largest gain in wholesale inventories in more than five years in December.

Inventories rose 7.7% from a year ago in January. Meanwhile, sales only rose by 2.7%. Overall, total inventories were $669.9 billion at the end of January, up 1.2% from the revised December level.

The increase in durable goods inventories at the wholesale level was even starker. These inventories were up 11.7% from January a year ago, and are up 17% from January two years ago, hitting $415 billion, the highest ever.

Businesses don’t like to have excess inventory, because carrying excess inventory is expensive and cuts into profits.  So they try very hard to manage their inventories efficiently, but if the economy slows down unexpectedly that can catch them off guard

 …click on the above link to read the rest of the article…

FedEx Is Talking As If A Global Recession Has Already Begun – And The Numbers Back That Up

FedEx Is Talking As If A Global Recession Has Already Begun – And The Numbers Back That Up

“Slowing international macroeconomic conditions” is just a fancy way to say that the global economy is in big trouble.  For months, I have been warning that economic conditions are deteriorating, and we just keep getting more confirmation that we are facing the worst global downturn since the last financial crisis.  For the second time in three months, FedEx has slashed its revenue forecast for this year.  In an attempt to explain why revenue is declining, FedEx’s chief financial officer placed the blame squarely on the faltering global economy.  The following comes from CNBC

The multinational package delivery service reported declining international revenue as a result of unfavorable exchange rates and the negative effects of trade battles.

“Slowing international macroeconomic conditions and weaker global trade growth trends continue, as seen in the year-over-year decline in our FedEx Express international revenue,” Alan B. Graf, Jr., FedEx Corp. executive vice president and chief financial officer, said in statement.

The use of the word “trends” implies something that has been going on for an extended period of time, and obviously FedEx doesn’t expect things to get better any time soon if they have cut profit projections twice in just the last three months.

And FedEx certainly has a lot of company when it comes to having a gloomy outlook for the global economy.  In one recent article, Bloomberg boldly declared that the global economy is in the worst shape it has been “since the financial crisis a decade ago”

 …click on the above link to read the rest of the article…

As The Economy Teeters On The Brink Of A Recession, U.S. Debt Levels Are Absolutely Exploding

As The Economy Teeters On The Brink Of A Recession, U.S. Debt Levels Are Absolutely Exploding

We now have official confirmation that the U.S. economy has dramatically slowed down.  In recent days I have shared a whole bunch of numbers with my readers that clearly demonstrate that a new economic downturn has begun.  And even though stock prices have been rising, the numbers for the “real economy” have been depressingly bad lately.  But what we didn’t have was official confirmation from the Federal Reserve that the economy is really slowing down, but now we do.  According to the Atlanta Fed’s GDPNow model, the economy is growing “at a 0.3 percent annualized rate in the first quarter”

The U.S. economy is growing at a 0.3 percent annualized rate in the first quarter, based on data on domestic construction spending in December released on Monday, the Atlanta Federal Reserve’s GDPNow forecast model showed.

For years, the goal has been to get U.S. growth above the key 3 percent threshold, but what this forecast is telling us is that economic growth is currently at one-tenth of that level.

That is just barely above recession territory.

So when I say that we are teetering on the brink of a recession, I am not exaggerating.

We also just got some really bad news about construction spending

Construction spending fell 0.6% in December from November, based on a seasonally adjusted annual rate, released today by the Commerce Department. Compared to December a year earlier, total construction spending inched up only 0.8% (not seasonally adjusted), the lowest growth rate since Oct 2011, coming out of the great recession.

Now we can add that to the list of all the other numbers that are telling us that very rough times are ahead.

Meanwhile, debt levels in the U.S. just continue to explode.

 …click on the above link to read the rest of the article…

As The Perfect Storm Approaches, Most Americans Are Partying Instead Of Preparing

As The Perfect Storm Approaches, Most Americans Are Partying Instead Of Preparing

I can’t think of a time when Americans were more apathetic about getting prepared, and yet this is exactly the time when the urgency to get prepared should be at the highest.  Earlier today, my wife Meranda and I were discussing the fact that every single element of “the perfect storm” is coming together just as we had anticipated.  One by one, the pieces are all falling into place, and I share the most recent things that my research has uncovered with all of you on a daily basis.  Unfortunately, most Americans are absolutely convinced that there is no reason to get prepared for hard times because everything is going to be just great.  In America today, most people either believe that the future is going to be totally wonderful or that the future will be totally wonderful once we get rid of Trump.  Because so many of us have adopted one of these false narratives, most Americans are partying instead of preparing, and that is going to mean big trouble when things really start going haywire.

Are you familiar with “the rule of three”?  I just looked it up on Google, and this is how it is defined…

“You can survive for 3 Minutes without air (oxygen) or in icy water. You can survive for 3 Hours without shelter in a harsh environment (unless in icy water) You can survive for 3 Days without water (if sheltered from a harsh environment) You can survive for 3 Weeks without food (if you have water and shelter)”

Of course these numbers are not exact.  For example, many have gone without food for more than 3 weeks without serious problems.  But in general, this is a pretty good guideline for survival.

 …click on the above link to read the rest of the article…

The Most Depressing Stat Of The Month: The U.S. National Debt Is About To Pass The $22 Trillion Mark

The Most Depressing Stat Of The Month: The U.S. National Debt Is About To Pass The $22 Trillion Mark

The U.S. national debt is wildly out of control, and nobody in Washington seems to care.  According to the U.S. Treasury, the federal government is currently $21,933,491,166,604.77 in debt.  In just a few days, that figure will cross the 22 trillion dollar mark.  Over the last 10 years, we have added more than 11 trillion dollars to the national debt, and that means that it has been growing at a pace of more than a trillion dollars a year.  To call this a major national crisis would be a massive understatement, and yet there is absolutely no urgency in Washington address this absolutely critical issue.  We are literally destroying the financial future of this nation, but most Americans don’t seem to understand the gravity of the situation that we are facing.

The Congressional Budget Office projects that the national debt and interest on that debt will both explode at an exponential rate in future years if we stay on the path that we are currently on.  According to the CBO, the federal government spent 371 billion dollars on net interest during the most recent fiscal year…

In fiscal 2018, the government spent $371 billion on net interest, while the Defense Department budget was $599 billion. Social Security benefits cost $977 billion, Medicare $585 billion and Medicaid $389 billion, according to the CBO estimates.

But the CBO said interest outlays’ rate of growth in fiscal 2018 was faster than that for the three mandatory federal programs: Social Security (up $43 billion, or 5 percent); Medicaid (up $14 billion, or 4 percent); and Medicare (up $16 billion, or 3 percent). In comparison, net interest on the public debt increased by $62 billion, or 20 percent.

The 371 billion dollars that we spent on interest could have been spent on roads, schools, airports, strengthening our military or helping the homeless.

Instead, it was poured down a black hole.

 …click on the above link to read the rest of the article…

The “Stock Market Crash Of 2018” Is Rapidly Transforming Into “The Financial Crisis Of 2019”

The “Stock Market Crash Of 2018” Is Rapidly Transforming Into “The Financial Crisis Of 2019”

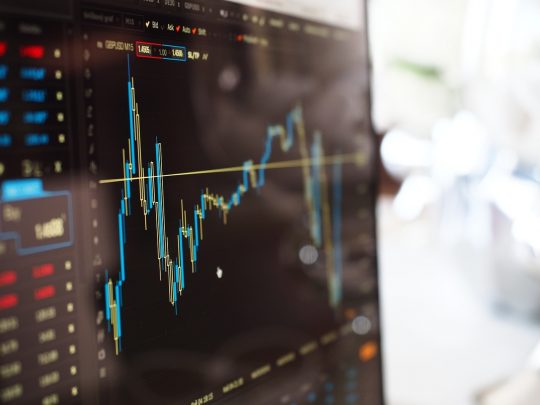
Stock markets are crashing all over the world, we are seeing extremely violent “flash crashes” in the forex marketplace, economic conditions are slowing down all over the globe, and fear is causing many investors to become extremely trigger happy.  The stock market crash of 2018 wiped out approximately 12 trillion dollars in global stock market wealth, but things were supposed to calm down once we got into 2019.  But clearly that is not happening.  After Apple announced that their sales during the first quarter are going to be much, much lower than previously anticipated, Apple’s stock price started shooting down like a rocket and by the end of the session on Wednesday the company had lost 75 billion dollars in market capitalization.  Meanwhile, “flash crashes” caused some of the most violent swings that we have ever seen in the foreign exchange markets…

It took seven minutes for the yen to surge through levels that have held through almost a decade.

In those wild minutes from about 9:30 a.m. Sydney, the yen jumped almost 8 percent against the Australian dollar to its strongest since 2009, and surged 10 percent versus the Turkish lira. The Japanese currency rose at least 1 percent versus all its Group-of-10 peers, bursting through the 72 per Aussie level that has held through a trade war, a stock rout, Italy’s budget dispute and Federal Reserve rate hikes.

This is the kind of chaos that we only see during a financial crisis.

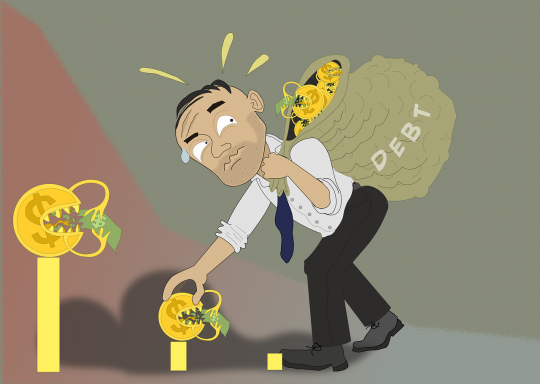
Investors are also being rattled by the fact that China just experienced its first factory activity contraction in over two years

The People’s Bank of China said on Wednesday evening it had relaxed its conditions on targeted reserve requirement cuts to benefit more small firms.

…click on the above link to read the rest of the article…

2018 Was The Worst Year For The Stock Market Since The Financial Crisis Of 2008

2018 Was The Worst Year For The Stock Market Since The Financial Crisis Of 2008Now that the year is finally over, we can officially say that 2018 was the worst year for stocks in an entire decade.  Not since the last financial crisis have we had a year like this, and many believe that 2019 will be even worse.  And of course the truth is that stocks are still tremendously overvalued.  Stock valuation ratios always return to their long-term averages eventually, and if the Dow Jones Industrial Average plunged another 8,000 points from the current level that would begin to get us into that neighborhood.  Unfortunately, the system is so highly leveraged that it will not be able to handle a price decline of that magnitude.  The relatively modest drops that we have seen already have caused a tremendous amount of chaos on Wall Street, and a full-blown meltdown would quickly result in a nightmare scenario potentially even worse than what we experienced in 2008.

For investors that had become accustomed to large gains year after year, 2018 was a brutal wake up call.  The following comes from Fox Business

2018 may be remembered as the year the Grinch stole your retirement or stock investment account.

December was the worst month for the Dow Jones Industrial Average and the S&P 500  since 1931, as tracked by our partners at Dow Jones Market Data Group. The S&P 500, the broadest measure of stocks, lost 9 percent and the Dow over 8.5 percent.

For the year, stocks turned in the worst performance since 2008.

According to the bulls, this wasn’t supposed to happen.  In the middle of the year, they were projecting that a “booming” U.S. economy would continue to drive stock prices higher, but instead we just witnessed the worst three month stretch  for stocks since the 4th quarter of 2008, and the month of December was the most painful of all

…click on the above link to read the rest of the article…

This Is Exactly The Kind Of Behavior That You Would Expect During A Stock Market Implosion…

This Is Exactly The Kind Of Behavior That You Would Expect During A Stock Market Implosion…

If a doctor tells you that his patient’s condition is swinging up and down wildly, is that a good sign or a bad sign?  Of course the answer to that question is quite obvious.  And if a doctor tells you that his patient’s condition is “stable”, is that a good sign or a bad sign?  Just like in the medical world, instability is not something that is a desirable thing on Wall Street, and right now we are witnessing extreme volatility on an almost daily basis.  On Thursday, the Dow was already down several hundred points when I went out to do some grocery shopping with my wife, and at the low point of the day it had fallen 611 points.  But then a “miracle happened” and the Dow ended the day with an increase of 260 points.  As I detailed yesterday, this is precisely the sort of behavior that you would expect during a chaotic bear market.

As Fox Business has noted, bear market rallies are typically “sharp, quick and usually short”.  I figured that the momentum from Wednesday would carry over into the early portion of Thursday, so I was surprised when the Dow was down by so much as we neared the middle of the day.  But then around 2 PM we witnessed an extraordinary market surge

The Dow Jones Industrial Average posted a 865-point swing in less than two hours. The blue-chip index had been down in mid-afternoon more than 500 points to cut the previous session’s gains in half, before bargain hunters and short covering turned a big decline into a modest gain.

An 865 point swing in less than two hours is not “normal”.

…click on the above link to read the rest of the article…

U.S. Stocks Just Had Their Best Day Ever – And Here Is Why That Is A REALLY Bad Sign…

U.S. Stocks Just Had Their Best Day Ever – And Here Is Why That Is A REALLY Bad Sign…

The Dow Jones Industrial Average just posted its biggest single day point gain ever.  On Wednesday, the Dow shot up 1,086 points, which shattered the old record by a staggering 150 points.  It truly was a remarkable day, and this is the sort of “Santa Claus rally” that investors had been hoping for.  Many are convinced that this rally is an indication that the crisis of the last three months is over, but as you will see below, this sort of extreme volatility is actually a really bad sign.  But for the moment, the mainstream media is pushing the narrative that everything is once again peachy keen in the financial world.  Just consider the following quote from CNN

“Investors went bargain shopping the day after Christmas, where stocks just got too cheap relative to earnings, future earnings, any reasonable assessment of earnings,” said Chris Rupkey, managing director of MUFG. “The coast is clear, back up the truck, investors are saying enough already, the world is not ending.”

The coast is clear?

Really?

Do you think that they were saying the same thing on October 13th, 2008?  On that day, the Dow Jones Industrial Average rose 936 points, and at the time it was the biggest daily point increase that Wall Street had ever seen by a very wide margin.

Of course that was right in the middle of the last financial crisis, and stocks just kept on tumbling after that massive rally.

But then on October 28th, 2008 the Dow Jones Industrial Average rose 889 points.  Up until Wednesday, that was the second biggest daily point increase in U.S. history.

Was the crisis over then?

No way.  Subsequently, the Dow kept on falling until it eventually bottomed out in early 2009.

…click on the above link to read the rest of the article…

This Was The Worst Week For The Stock Market Since The Financial Crisis Of 2008

This Was The Worst Week For The Stock Market Since The Financial Crisis Of 2008

Just when you thought that things couldn’t get any worse, they did.  During normal times, a Friday before Christmas is an extremely boring trading session, but these are not normal times.  On Friday, the Dow Jones Industrial Average was down another 414 points, and that brought the total drop for the week to 1,655 points.  The marketplace has been completely gripped by panic, and CNN’s Fear & Greed index has just registered the highest “fear rating” that we have ever seen.  I keep saying that we have not witnessed anything like this since the last financial crisis, and the numbers clearly back that assessment up.  In fact, this was the largest weekly percentage drop for the Dow since October 2008

The Dow just suffered its deepest weekly plunge since 2008and the Nasdaq is officially in a bear market.

The miserable performance reflects deepening fears on Wall Street of an economic slowdown and overly-aggressive Federal Reserve.

Apprehension about a looming government shutdown and anxiety over higher interest rates were two of the major factors that pushed stocks down on Friday.

Normally trading volume is very, very light in the days leading up to Christmas, so what we just witnessed was extremely unusual.  Trading volume on Friday was “really heavy” with “more than 12 billion shares” changing hands…

In a bad sign on Friday, volume was really heavy. More than 12 billion shares changed hands on U.S. exchanges on Friday, the biggest volume in at least two years.

When I have warned about a “rush for the exits” in the past, this is the kind of thing that I am talking about.

Many investors were panic-selling on Friday because they wanted to be out of the market before things closed down for the holidays, and stock prices just kept getting hammered lower and lower.

…click on the above link to read the rest of the article…

Worst Market Crash In A Decade: The Dow Has Fallen More Than 4000 Points As Stocks Rapidly Approach “The Capitulation Phase”

Worst Market Crash In A Decade: The Dow Has Fallen More Than 4000 Points As Stocks Rapidly Approach “The Capitulation Phase”

We have not seen anything like this since the financial crisis of 2008.  On Thursday the Dow Jones Industrial Average lost another 464 points, and over the last five trading sessions it has lost a total of more than 1,700 points.  CNN’s Fear & Greed index has swung all the way over to “extreme fear”, and there has only been one December in all of U.S. history that was worse for the stock market than this one.  But back at the very beginning of October, most of the experts never would have imagined that the year would end this way.  According to CNBC, the Dow Jones Industrial Average hit an all-time record high of 26,951.81 in early October, and investors were feeling really good about things at that point.  But on Thursday the index closed at just 22,859.60, and that means that the Dow has lost more than 4,000 points in less than three months.

All of the major trend lines have been shattered and all of the key support levels have been breached.  When analysts look at stock charts these days, all they are seeing is sell signal after sell signal.  One investment strategist told CNN that stocks are “quickly approaching the capitulation phase”

“Equity markets are quickly approaching the capitulation phase after having broken below critical support,” Sam Stovall, chief investment strategist at CFRA Research, told CNN Business.

According to Google, “capitulation” means “the action of surrendering or ceasing to resist an opponent or demand.”  In this case, the bulls are on the verge of surrendering to the bears, and if that happens we could see a tremendous amount of chaos break loose on Wall Street.

…click on the above link to read the rest of the article…

Olduvai IV: Courage
Click on image to read excerpts

Olduvai II: Exodus
Click on image to purchase

Click on image to purchase @ FriesenPress