Home » Posts tagged 'dow jones'

Tag Archives: dow jones

Olduvai
Click on image to purchase

Olduvai III: Catacylsm
Click on image to purchase

Post categories

Post Archives by Category

Which Precious Metals Are Likely To Be Better Investments During The Next Market Crash?

Which Precious Metals Are Likely To Be Better Investments During The Next Market Crash?

The question on the minds of many investors, is which of the precious metals will be better investments during the next market crash?  I should know because I receive this question in my email box quite often.  So, I decided to test the price action of several metals and how each traded during a large market correction.

This article will focus on the top four precious metals, gold, silver, platinum, and palladium.  Even though Rhodium and other metals are considered precious, the ones listed above take the lion’s share of the investment market.  Furthermore, while platinum and palladium are purchased as investments, they have a much larger industrial component than gold or silver.

As I have mentioned many times, gold and silver disconnected from the broader markets when the Dow Jones Index fell 2,000 points in the first six weeks of 2016.

The two reasons I believe gold and silver jumped considerably as the markets sold off at the beginning of 2016 were:

  1. Gold and Silver were extremely oversold, and the Commercial hedgers’ short positions were at a low, thus very bullish
  2. Investors were extremely worried that the Dow Jones and markets were beginning a massive correction, so they moved into both gold and silver

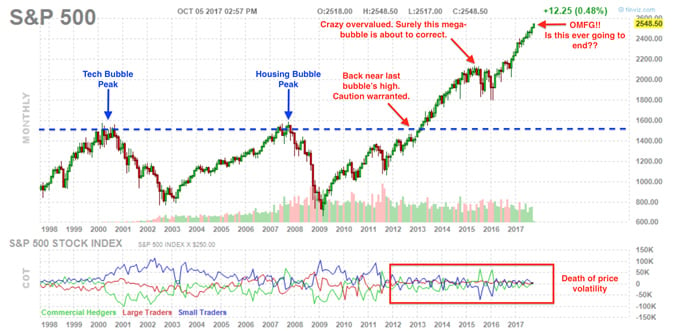
To explain why investors were spooked in 2016, we need to look at the following chart:

Typically during a major correction, the market makes several attempts at a top.  In 2007, there were three tops made before the market finally came down in 2008.  Then in 2015, we had three more tops and two large corrections.  The reason investors’ worry turned into fear at the beginning of 2016 was that the last top did not reach the previous 18,000 level.

And this can be seen in the next chart:

…click on the above link to read the rest of the article…

WATCH OUT BELOW: Dow Jones Index Next Stop… 19,000

WATCH OUT BELOW: Dow Jones Index Next Stop… 19,000

As investors continue to believe the stock market correction is over, the next big stop LOWER for the Dow Jones Index is 19,000.  When the Dow falls below 19,000, all doubt will be removed as the best investment strategy would be to sell the rallies, rather than buy the dip.  However, most investors buy at the top and sell at the bottom.  So, it looks like investor carnage will continue for the foreseeable future.

I am quite surprised that investors don’t see the writing on the wall as it pertains to the most overvalued stock market in human history.  While the PE Ratio of the S&P 500 isn’t as severe as it was in 1999, the debt, leverage, and margin are orders of magnitude higher.  For example, in 1999 the U.S. Govt. debt was only $5.6 trillion compared to the $21 trillion today.  Also, with higher debt levels comes higher interest payments.

Unfortunately, the U.S. Government and the economy is in a nasty feedback loop heading towards complete destruction.  You can’t continue to print money, increase debt and leverage without causing severe disruptions in the future.

Today, investors have become way too complacent as the broader markets trade near their highs.  However, as the markets really start to fall, complacency will eventually turn into panic.  According to my analysis, the next critical level for the Dow Jones Index is 19,000:

I picked the 50-month moving average (MMA), shown in the blue line as the first critical level.  Once the Dow Jones Index falls below 19,000, the next critical level will be 13,000, or the 200 MMA (in red).  These levels aren’t “possibilities,” but rather, “guarantees” to occur over the next few years.  Why do I say a guarantee?  Well, if we look at some of the insane stock price charts below, you would have to be a complete imbècil to arrive at a different conclusion.

…click on the above link to read the rest of the article…


Will The Coming Big Oil Price Drop Cause The Next Stock Market Crash?

Will The Coming Big Oil Price Drop Cause The Next Stock Market Crash?

The oil market price is setting up for one heck of a fall.  Now, could this large oil correction cause the next stock market crash?  Time will tell.  However, the indicators in the oil market are showing the largest net commercial short positions in history.  The current net commercial short positions in the oil market are even higher by 174,000 contracts than the level when the oil price fell from $105 in mid-2014 to a low of $30 at the beginning of 2016.

Furthermore, there was a previous trend in the 1980’s that suggests we are setting up for a MAJOR stock market crash.  I discuss the details of the current record net commercial short positions and the similar setup that took place during the 1980’s in my newest video, Will The Coming Big Oil Price Drop Cause The Next Stock Market Crash?

Here is one of the charts discussed in the video presentation above:

As we can see in this COT Report (Commitment Of Traders), the commercial net short positions jumped from 648,000 to 674,000 in the past week.  However, this chart only shows the change traders’ positions over one year.  To see how large the present commercial net short positions, please check out the short 12-minute video.

I believe the oil and stock markets are setting up for one large correction or even a market crash.  Thus, as the stock markets crack, we will likely see a huge move by retail investors into Gold ETF’s as well as precious metals investors tremendously increase their demand for physical gold and silver investment.


The Leveraged Economy BLOWS UP In 2018

The Leveraged Economy BLOWS UP In 2018

Enjoy the good times while you can because when the economy BLOWS UP this next time, there is no plan B.  Sure, we could see massive monetary printing by Central Banks to continue the madness a bit longer after the market crashes, but this won’t be a long-term solution.  Rather, the U.S. and global economies will contract to a level we have never experienced before.  We are most certainly in unchartered territory.

Before I get into my analysis and the reasons we are heading towards the Seneca Cliff, I wanted to share the following information.  I haven’t posted much material over the past week because I decided to spend a bit of quality time with family.  Furthermore, a good friend of mine past away which put me in a state of reflection.  This close friend was also very knowledgeable about our current economic predicament and was a big believer in owning gold and silver.  So, it was a quite a shame to lose someone close by who I could chat with about these issues.

While some of my family members know about my work, I don’t really discuss it with them.  If they ever have a question, I will try to answer it, but I found out years ago that it was a waste of time to try and impose my knowledge upon them.  Which is the very reason I started my SRSrocco Report website… LOL.  So, now I have a venue to get my analysis out to the public.  I don’t care about reaching everyone, but rather to provide important information to those who are OPEN to it.

…click on the above link to read the rest of the article…

1987, 1997, 2007… Just How Crash-Prone are Years Ending in 7?

Bad Reputation

Years ending in 7, such as the current year 2017, have a bad reputation among stock market participants. Large price declines tend to occur quite frequently in these years.

Sliding down the steep slope of the cursed year. [PT]

Just think of 1987, the year in which the largest one-day decline in the US stock market in history took place:  the Dow Jones Industrial Average plunged by 22.61 percent in a single trading day. Or recall the year 2007, which marked the beginning of the GFC (“great financial crisis”).

Given that the current year is ending in 7 as well, is there a reason to be concerned, or is the year 7 crash  pattern a myth?

The Pattern of the Dow Jones Industrial Average in the Course of a Decade

Below you can see a chart of the typical pattern of the DJIA in the course of a decade. This is not a standard chart. Instead it shows the average price pattern of the DJIA in the course of a decade since 1897.

The horizontal axis shows the years of the decade, the vertical axis the average performance of the index. Thus one can discern at a glance how the index typically performs in individual years depending on what their last digit happens to be.


DJIA, typical pattern in the course of a decade since 1897. Years ending in 7 did tend to be marked by large setbacks on average.

As you can see, in the first half of the decade, i.e. in the years ending in 0 to 4, the DJIA barely rose on average. By contrast, in years ending in 5 (highlighted in yellow above) the performance of the index tended to be particularly strong.

…click on the above link to read the rest of the article…

The Waiting Is The Hardest Part

BLOG

imgflip.com

The Waiting Is The Hardest Part

Tom Petty’s anthem for today’s investors

Man, what an awful stretch of events.

When I penned last week’s article on tragedy, little did I expect something as horrible as the Las Vegas massacre would immediately follow. And nearly lost in the headlines was the untimely passing of rock legend, Tom Petty, one of my all-time favorite musicians. Sure can’t wait for this week to be over…

In memory of Tom, I’ve been listening to a lot of his and the Heartbreakers’ best hits. The lyrics to one song in particular, The Waiting, well-captures an important message today’s investors should take to heart:

The waiting is the hardest part
Don’t let it kill you baby, don’t let it get to you

Those waiting for the financial markets to experience some sort (any sort!) of pullback have been waiting a long, looong time. How long?

  • It has been over 100 months (more than 8.5 years) since the current bull market began in April of 2009
  • It has been 15 months since the last (and very brief) drop of 5% in the S&P 500
  • This past September saw record low volatility, including a stretch now claimed to be “the most peaceful days in the history of the markets
  • Since last year’s presidential election, at which point the markets were already considered dangerously overvalued, the Dow Jones Industrial Average is up over 20%
  • As of this article’s publishing, the Dow, the S&P and the NASDAQ are all trading at record highs

Or, to put it visually:

The stock market is now 70% higher than it was at the previous bubble peak immediately preceding the 2008 Great Financial Crisis.

Reflect for a moment how painful the crash from Oct 2008-March 2009 was. How much more painful will a crash from today’s much dizzier heights be?

…click on the above link to read the rest of the article…

Forecast 2017: The Wheels Finally Come Off

“There is no other endeavor in which men and women of enormous intellectual power have shown total disregard for higher-order reasoning than monetary policy.
                                                                                                      — David Collum

American Notes

Apart from all the ill-feeling about the election, one constant ‘out there’ since November 8 is the Ayn Randian rapture that infects the money scene. Wall Street and big business believe that the country has passed through a magic portal into a new age of heroic businessmen-warriors (Trump, Rex T, Mnuchin, Wilbur Ross, et. al.) who will go forth creating untold wealth from super-savvy deal-making that un-does all the self-defeating malarkey of the detested Deep State technocratic regulation regime of recent years. The main signs in the sky, they say, are the virile near-penetration of the Dow Jones 20,000-point maidenhead and the rocket ride of Ole King Dollar to supremacy of the global currency-space.

I hate to pound sleet on this manic parade, but, to put it gently, mob psychology is outrunning both experience and reality. Let’s offer a few hypotheses regarding this supposed coming Trumptopian nirvana.

The current narrative weaves an expectation that manufacturing industry will return to the USA complete with all the 1962-vintage societal benefits of great-paying blue collar jobs, plus an orgy of infrastructure-building. I think both ideas are flawed, even allowing for good intentions. For one thing, most of the factories are either standing in ruin or scraped off the landscape. So, it’s not like we’re going to reactivate some mothballed sleeping giant of productive capacity. New state-of-the-art factories would require an Everest of private capital investment that is simply impossible to manifest in a system that is already leveraged up to its eyeballs.

…click on the above link to read the rest of the article…

Deutsche Warns Of Imminent “Domino Impact” For Stocks From Bond Carnage, Soaring Dollar

Deutsche Warns Of Imminent “Domino Impact” For Stocks From Bond Carnage, Soaring Dollar

One of the more confounding aspects of the record bond selloff experienced in the past few days, is that it not only left broader equity indices unscathed, but took place as the Dow Jones hit a new record high. This, as Goldman explains, is problematic, given that the ‘low yields for longer’ theme, i.e., the infamous “Fed Model” which was used to justify record high stock multiples purely as a function of record low bond yields, that underpins the valuation of several financial assets is under scrutiny. As Goldman puts it: “the continued focus” on the spike in bond yields “seems to us justified.”

The reason, as Goldman’s Francesco Garzareli cautions, is that “some of the ongoing price action in fixed income ties up well with macro developments and remains overall favourable for risk assets. But other traits of the repricing seem inconsistent with fundamentals, and are potentially destabilizing for broader markets.” Where things get interesting, is where Goldman and Deutsche Bank diverge on their opinion whether the recent blow out in yields will serve to limit future equity gains.

 Goldman is more sanguine:
At around 2%, US 10-year Treasuries are now at the low end of the valuation band around our preferred measure of macro ‘fair value’ in which they fluctuate 68% of the time. Bonds in Germany, the UK and Japan are priced similarly on this dimension, as shown in Exhibit 1 below (by comparison, in the Summer, the degree of departure of yields from their ‘fair’ levels was a very rare event, occurring on average less than 5% of times).

…click on the above link to read the rest of the article…

Cash Bans and the Next Crisis

Money sometimes goes “full politics”. Take poor Kenneth Rogoff at Harvard. He wants a dollar with a voter registration card, a U.S. flag on its windshield, and a handgun in its belt – the kind of money that supports the Establishment and votes for Hillary.

Kenneth Rogoff, professor of economics at Harvard University, participates in a session on the third day of the World Economic Forum (WEF) Annual Meeting 2011 in Davos, Switzerland, on Friday, Jan. 28, 2011. The World Economic Forum in Davos will be attended by a record number of chief executive officers, with a total of 2,500 delegates attending the five-day meeting.Etatiste tool Kenneth Rogoff, whose authoritarian jeremiads against cash currency we have first discussed and criticized in 2014 in “Meet Kenneth Rogoff, Unreconstructed Statist”. As Hans-Hermann Hoppe once noted: [I]ntellectuals are now typically public employees, even if they work for nominally private institutions or foundations. Almost completely protected from the vagaries of consumer demand (“tenured”), their number has dramatically increased and their compensation is on average far above their genuine market value. At the same time the quality of their intellectual output has constantly fallen. What you will discover is mostly irrelevance and incomprehensibility. Worse, insofar as today’s intellectual output is at all relevant and comprehensible, it is viciously statist.” 

Photo credit:  Andrew Harrer / Bloomberg

Writing last month in the Wall Street Journal under the headline “The Sinister Side of Cash”, he noted that:

“Paper currency, especially large notes such as the U.S. $100 bill, facilitate crime: racketeering, extortion, money laundering, drug and human trafficking, the corruption of public officials, not to mention terrorism.”

Of course, large notes do make it easier for criminals to operate. Like cellphones. And sunglasses. And automobiles with air-conditioning. But that’s what money is supposed to do: make it easier for an economy to function. You use it as you please.

Yes, dear reader, we are back to our regular beat. Money. But what’s this? Finally, we’re beginning to see some action. You’ll recall that the markets have been eerily quiet –  with less movement in stocks than we’ve seen in the last 100 years. What gives?

…click on the above link to read the rest of the article…

The Powers That Be Have Lost Control: “Everything Is Falling Apart Everywhere”

The Powers That Be Have Lost Control: “Everything Is Falling Apart Everywhere”

cliff-edge

The entire system has been revealed for the sham it really is since the start of the New Year. Stock markets are crashing, the global economy has stalled, and the powers that be appear to have lost control.

As Andy Hoffman of Miles Franklin notes in his most recent interview with Future Money Trends, the only thing they are able to manipulate now are a few markets that include the Dow Jones and the gold and silver trade.

2011 is when the, let’s call them, The Powers That Be realized they were losing… they were three years into their post-2008 money printing frenzy and they were failing… Europe was failing… The U.S. had been stripped of its triple-A credit rating… all the markets were falling apart… and they were worried about Greece and all this…

They have lost control of everything… there is nothing that the Powers That Be haven’t lost control of… except the Dow Jones propaganda average and related major stock averages… and paper gold and silver.

Watch this extremely informative interview with Andy Hoffman:

Money printing is going off the charts… these things are really starting to get out of their control… the inventories are vanishing everywhere… and then of course you have stock markets around the world are falling… and now the stock market itself here in the United States has been falling…

When you talk about commodities and currencies and everything else… we’re talking about the worst economy of our lifetimes… of our parents’ lifetimes… of our grandparents’ lifetimes… and it’s only going to get worse right now.

…click on the above link to read the rest of the article…

The Stock Markets Of The 10 Largest Global Economies Are All Crashing

The Stock Markets Of The 10 Largest Global Economies Are All Crashing

Globe InterconnectednessYou would think that the simultaneous crashing of all of the largest stock markets around the world would be very big news.  But so far the mainstream media in the United States is treating it like it isn’t really a big deal.  Over the last sixty days, we have witnessed the most significant global stock market decline since the fall of 2008, and yet most people still seem to think that this is just a temporary “bump in the road” and that the bull market will soon resume.  Hopefully they are right.  When the Dow Jones Industrial Average plummeted 777 points on September 29th, 2008 everyone freaked out and rightly so.  But a stock market crash doesn’t have to be limited to a single day.  Since the peak of the market earlier this year, the Dow is down almost three times as much as that 777 point crash back in 2008.  Over the last sixty days, we have seen the 8th largest single day stock market crash in U.S. history on a point basis and the 10th largest single day stock market crash in U.S. history on a point basis.  You would think that this would be enough to wake people up, but most Americans still don’t seem very alarmed.  And of course what has happened to U.S. stocks so far is quite mild compared to what has been going on in the rest of the world.

Right now, stock market wealth is being wiped out all over the planet, and none of the largest global economies have been exempt from this.  The following is a summary of what we have seen in recent days…

#1 The United States – The Dow Jones Industrial Average is down more than 2000 points since the peak of the market.  Last month we saw stocks decline by more than 500 points on consecutive trading days for the first time ever, and there has not been this much turmoil in U.S. markets since the fall of 2008.

…click on the above link to read the rest of the article…


The Dow October 22, 2014 & Bond Bubble | Armstrong Economics

The Dow October 22, 2014 & Bond Bubble | Armstrong Economics.

DJIND-D 10-22-2014

The resistance in the Dow Jones Industrial Index for today stands in the mid 16700 zone on a technical basis. Targets in time for this week were Wed and Friday with the latter being the main target. ONLY a closing back above 17010 would signal that the low is in place for a broader term. This week should produce a reaction high. A closing on Friday at least below 16880 will keep the market in check. A closing BELOW 16660 will signal that a drop back into the week of Nov 3rd is possible with a new low.

Retail participation remains at record lows so this crash we will call the Rich Man’s Panic of 2014. The same trend is witnessed everywhere, including Asia and Europe. While the press was bashing the little guy saying he has missed the entire rally,

The stats show that the total size of the world stock market capitalizations closed 2013 at $54.6 trillion which was only 25% of the total world market capitalization – the rest being bonds.The bond market is larger than the stock market for various reasons. Whereas only corporations issue stocks, governments and corporations both issue fixed income securities. The U.S. Treasury is the largest issuer of bonds worldwide. Because U.S, Treasury bonds provide the bulk of reserves which are just over $30 trillion.

…click on the above link to read the rest of the article…

Olduvai IV: Courage
Click on image to read excerpts

Olduvai II: Exodus
Click on image to purchase

Click on image to purchase @ FriesenPress