Home » Posts tagged 'dennis coyne'

Tag Archives: dennis coyne

Olduvai
Click on image to purchase

Olduvai III: Catacylsm
Click on image to purchase

Post categories

Post Archives by Category

OPEC Update, September 18, 2022

OPEC Update, September 18, 2022

The OPEC Monthly Oil Market Report (MOMR) for September 2022 was published recently. The last month reported in most of the OPEC charts that follow is August 2022 and output reported for OPEC nations is crude oil output in thousands of barrels per day (kb/d). In most of the OPEC charts that follow the blue line is monthly output and the red line is the centered twelve month average (CTMA) output.

Figure 1
Figure 2

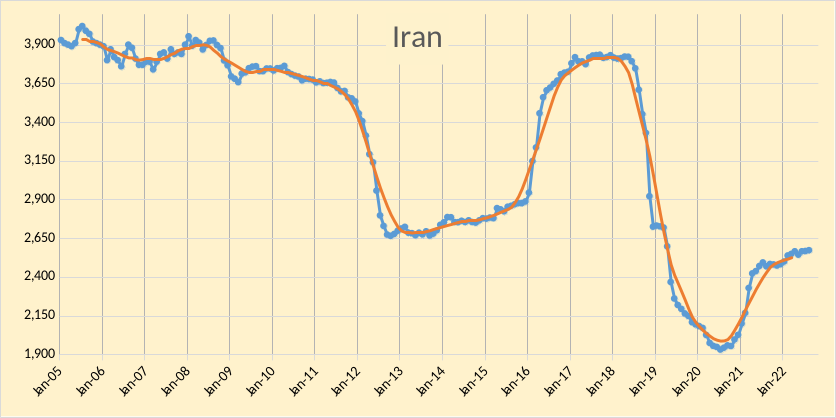
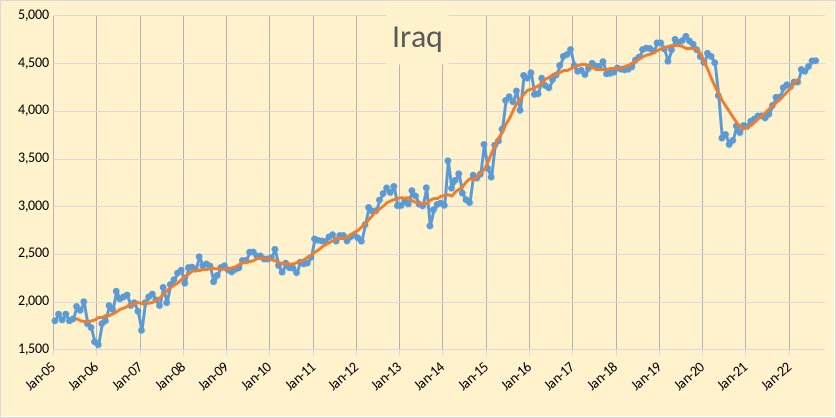
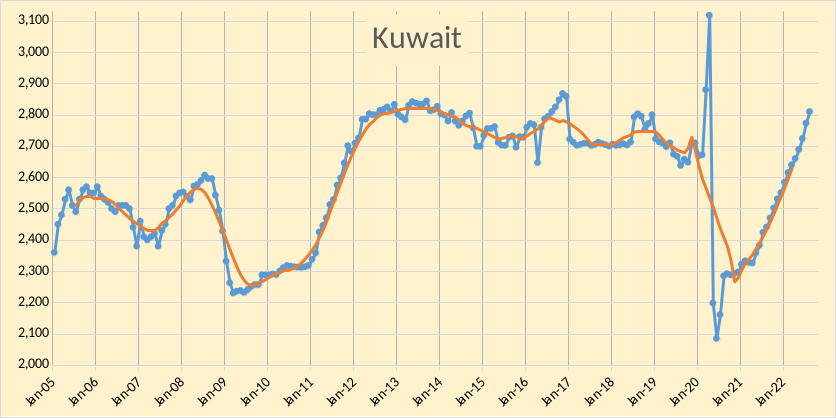
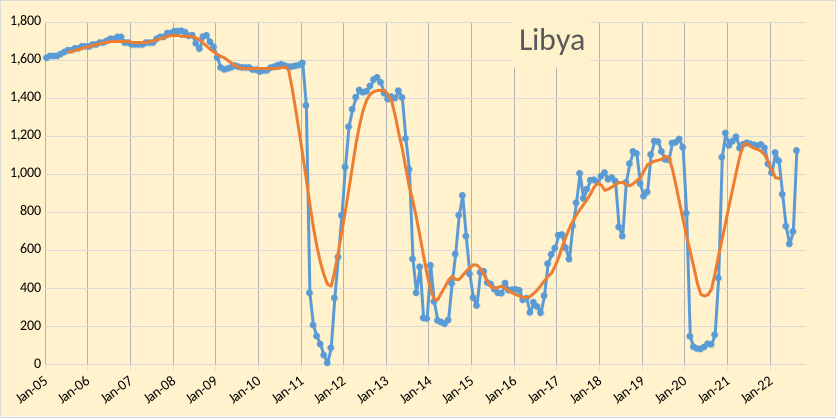
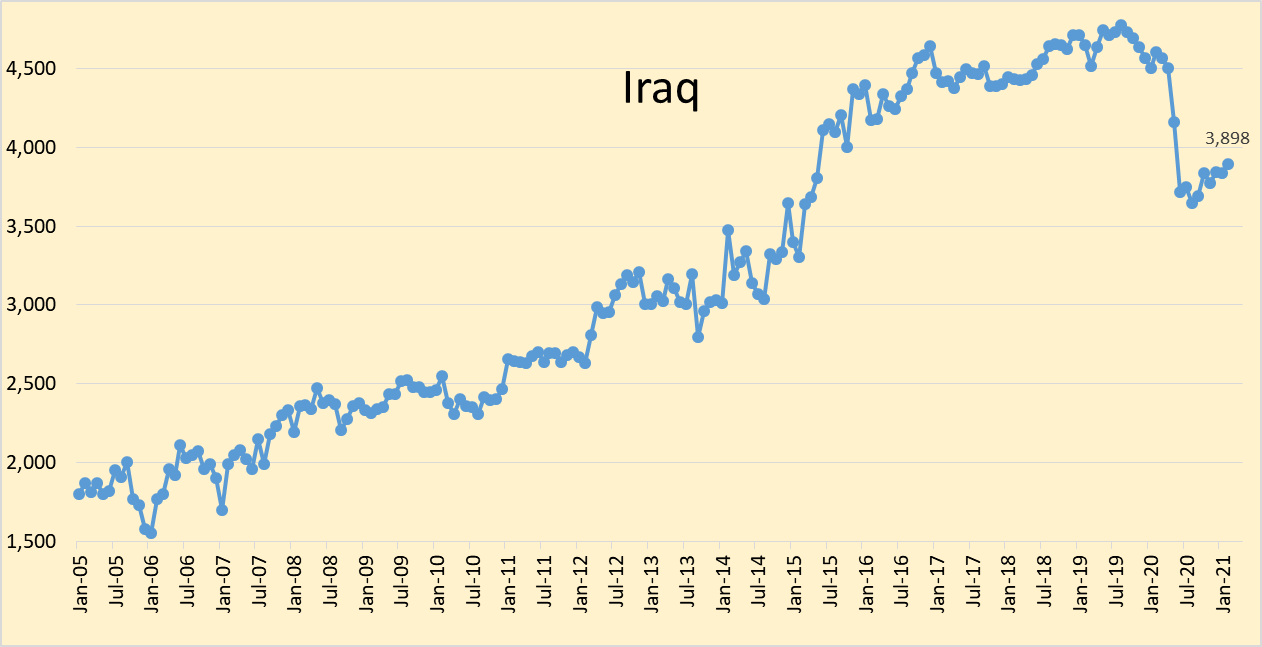
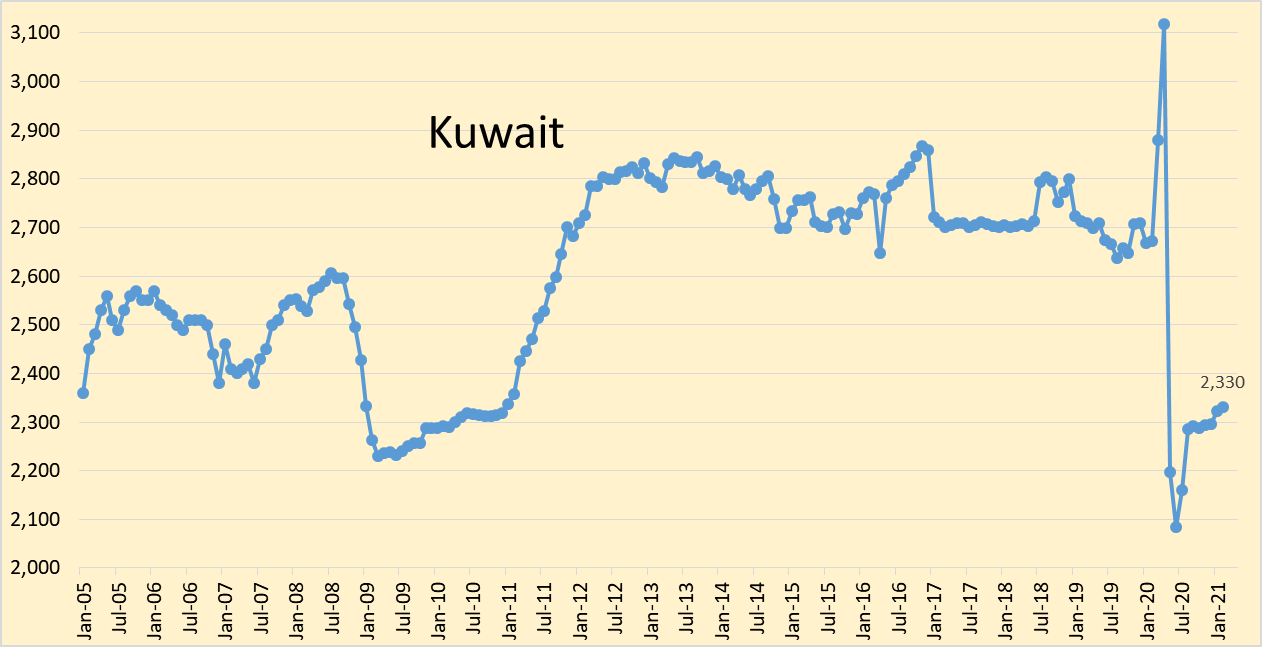
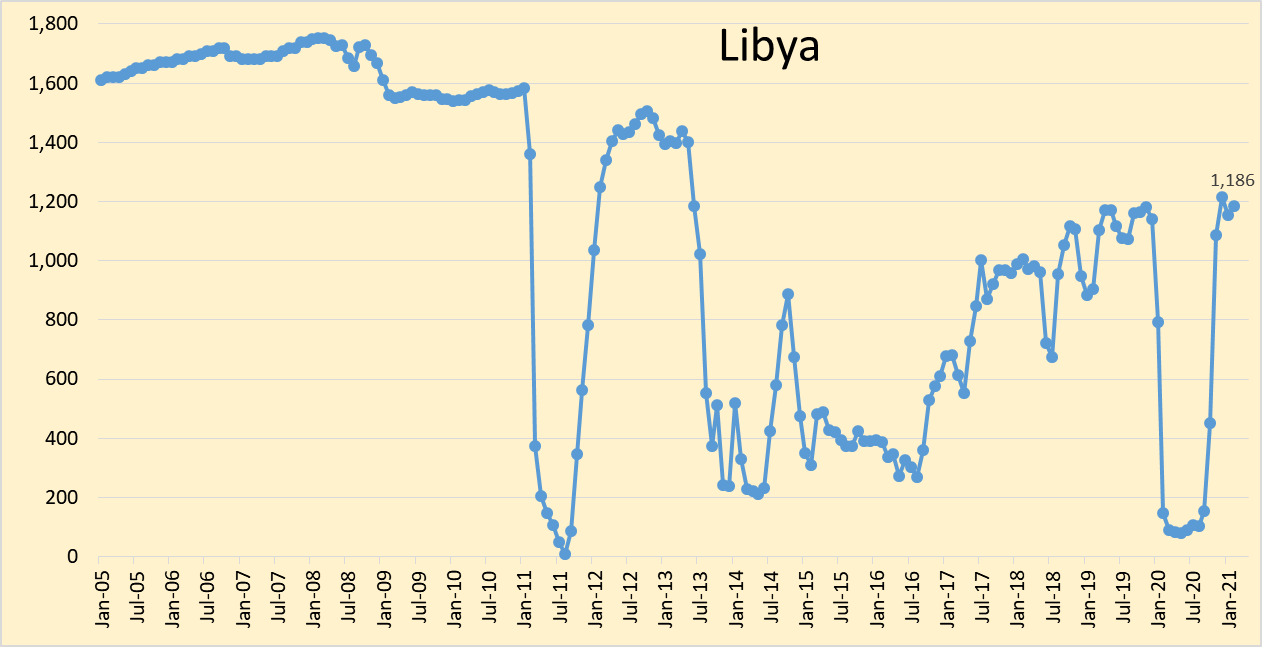
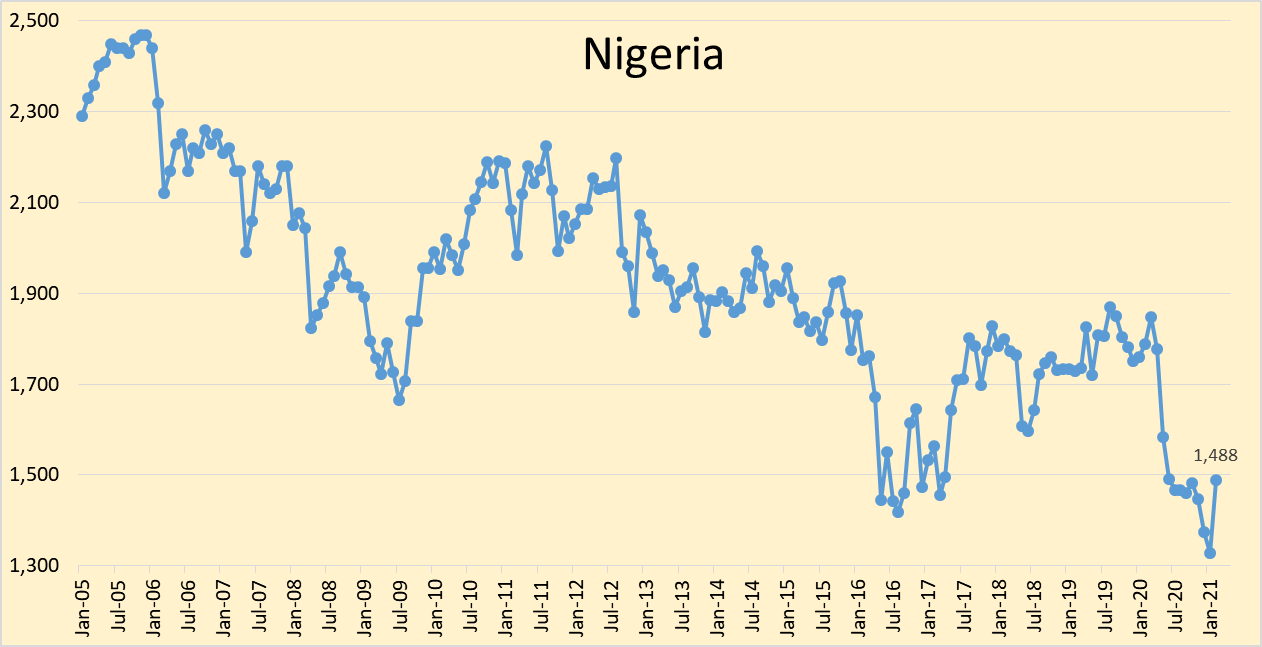
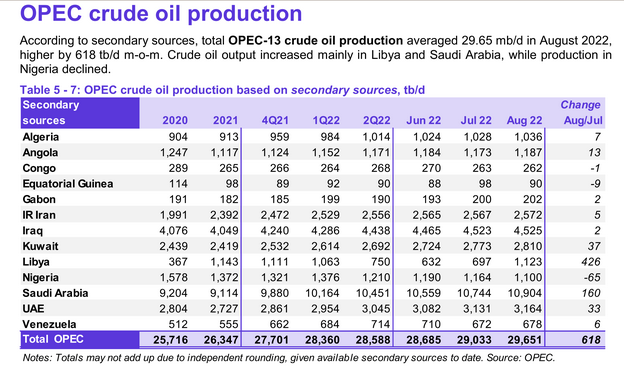
OPEC output increased by 618 kb/d in August after being revised higher in July 2022 by 37 kb/d and June 2022 output was revised up by 5 kb/d compared to last month’s MOMR. The bulk of the August increase in OPEC output (69%) was from Libya(426), with smaller increases from Saudi Arabia(160), Kuwait(37), and UAE(33). Nigeria had a decrease of 65 kb/d. The rest of the OPEC producers had small increases or decreases of less than 20 kb/d with a total increase of 25 kb/d for all 8 nations.

…click on the above link to read the rest of the article…

OPEC Update, March 2021

OPEC Update, March 2021

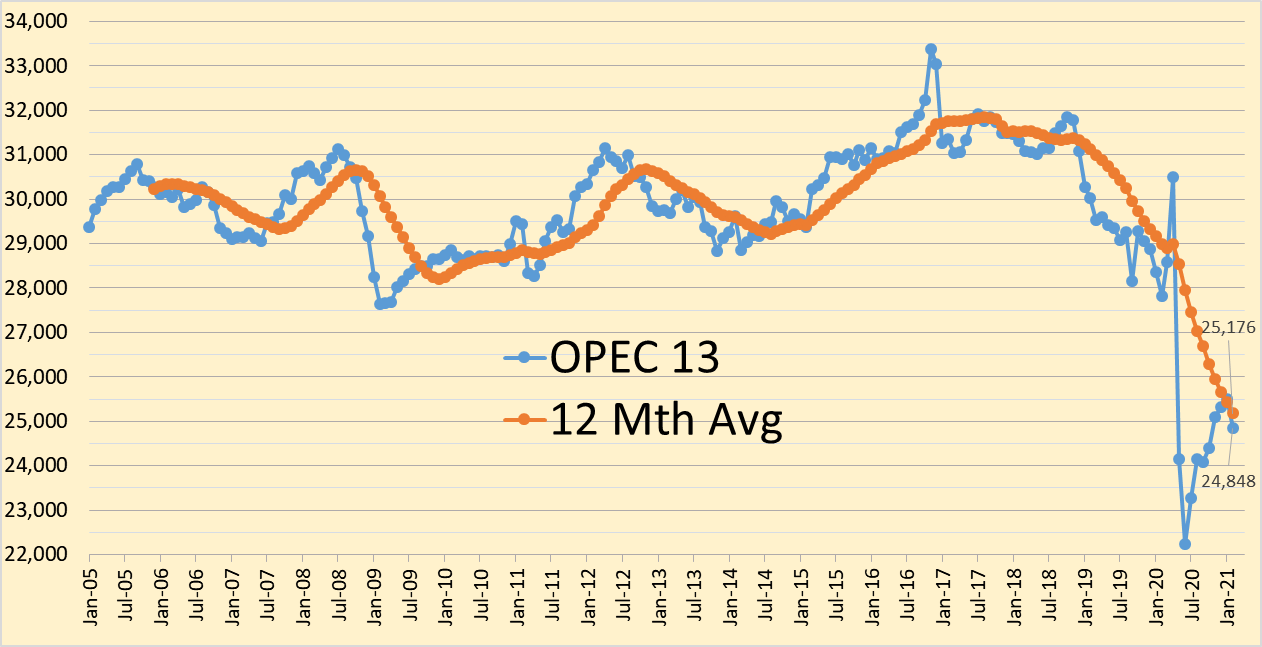
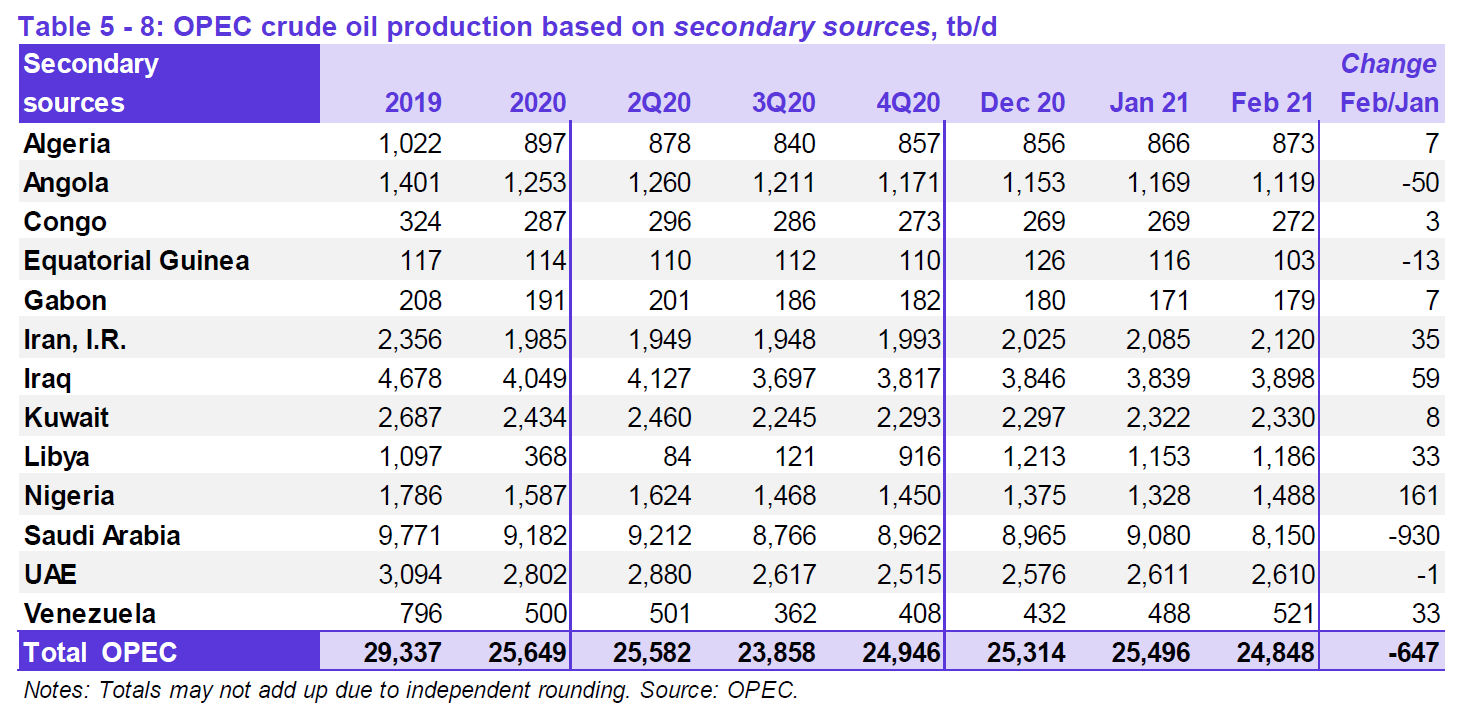
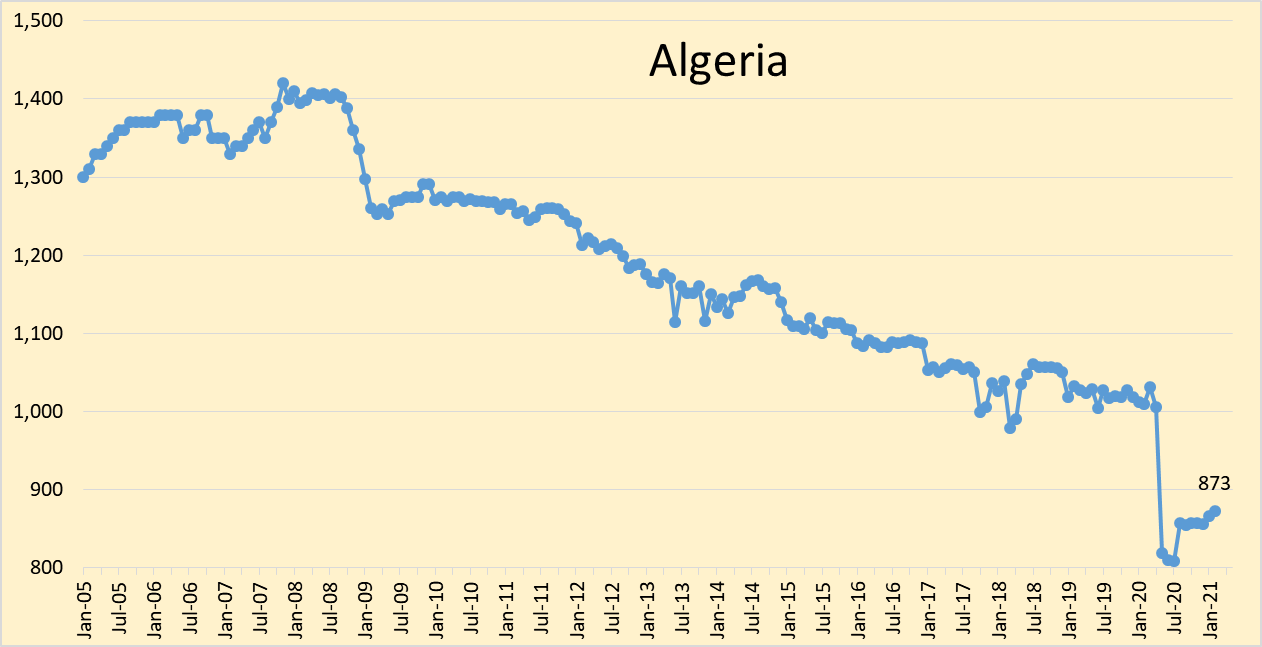
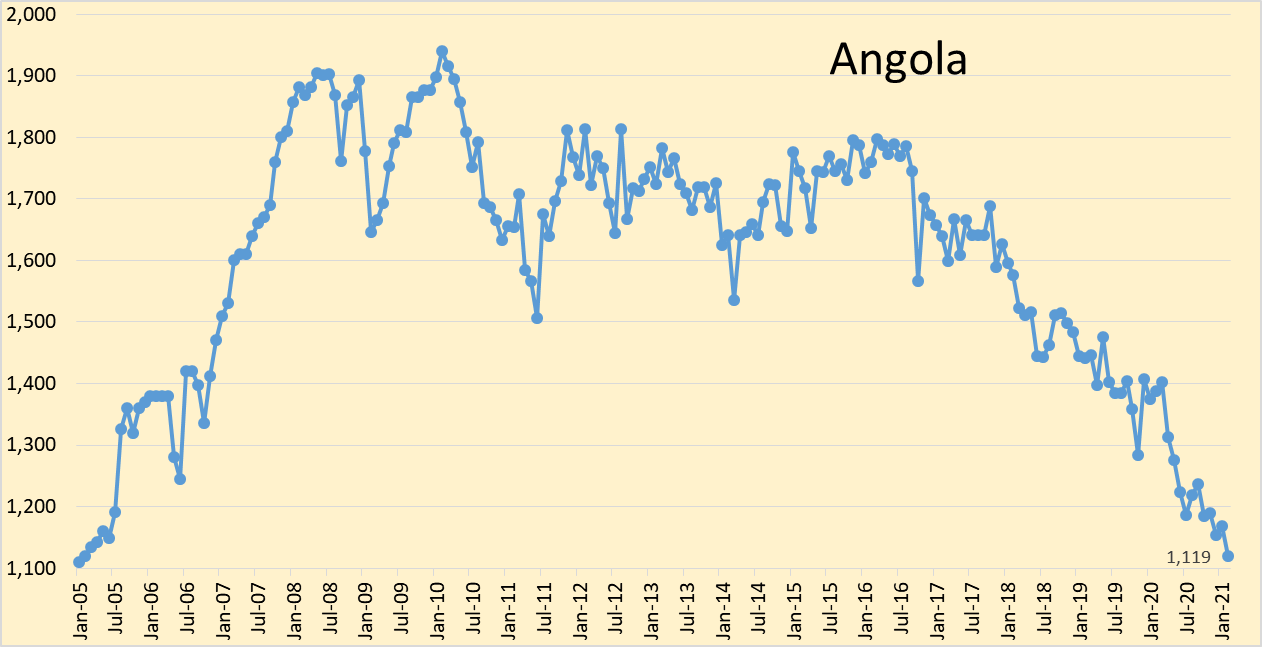
The OPEC Monthly Oil Market Report for March 2021 was published this past week. The last month reported in each of the charts that follow is February 2021 and output reported for OPEC nations is crude oil output in thousands of barrels per day (kb/d). The numbers at the left side of the graphs show February 2021 output (and in some cases the trailing 12 month average output).

Figure 1

Figure 2

OPEC crude output decreased by 647 kb/d in February 2021, total OPEC crude output for January 2021 was not revised from last month’s report. Most of the decrease in OPEC output was due to a cutback in Saudi Arabia’s output by 930 kb/d from January to February 2021.

Figure 3
Figure 4
Figure 5
Figure 6
Figure 7
Figure 8
Figure 9
Figure 10
Figure 11
Figure 12
…click on the above link to read the rest of the article…

Dennis Coyne, OPEC, oil , oil production, peak oil barrel

US Light Tight Oil (LTO) Update

US Light Tight Oil (LTO) Update

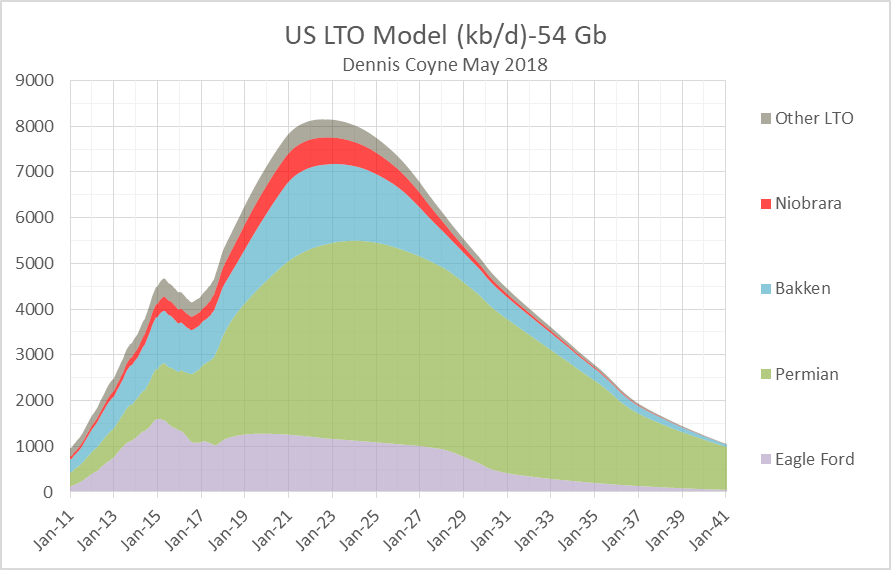
I have updated my scenarios for US LTO output, based on both EIA tight oil output data and average well profile data from Enno Peters’ shaleprofile.com. I have also created a scenario for the Niobrara shale oil play and for “other US LTO” which excludes the Permian Basin LTO, Eagle Ford, North Dakota Bakken/Three Forks, and the Niobrara.

chart/

Niobrara play

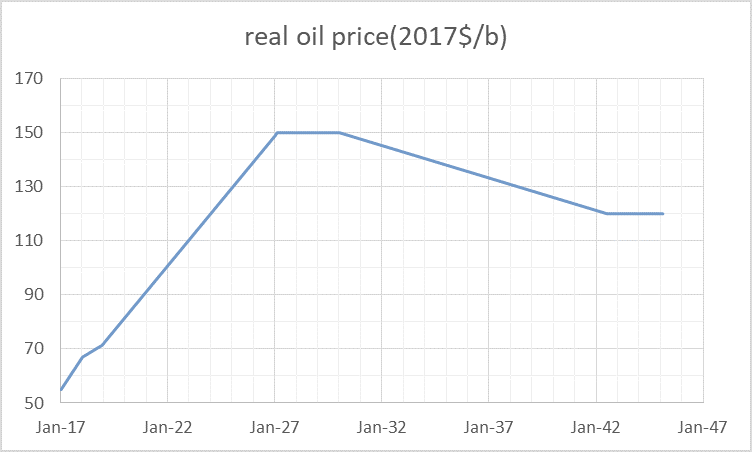
The recent Niobrara wells have an estimated ultimate recovery (EUR) of 143 kb. The oil price scenario below is used for all of the scenarios.

chart/

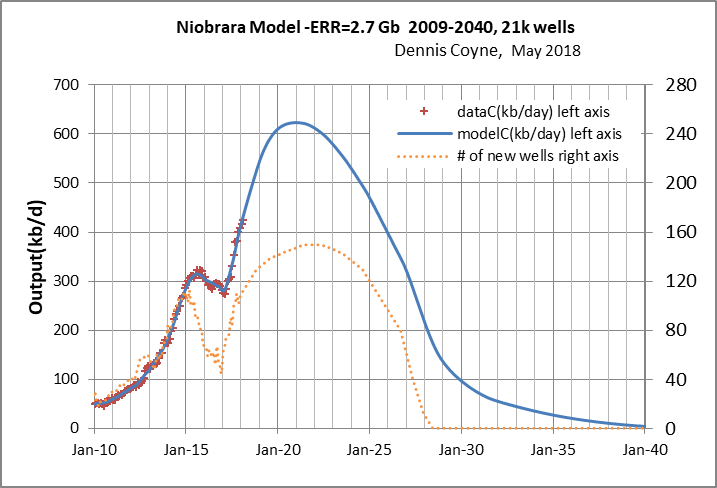
Well cost is assumed to be $4.5 million in 2017$. The scenario below assumes EUR starts to decrease in Jan 2019 as sweet spots become fully drilled. Economically recoverable resources (ERR) to 2040 are 2.7 Gb with 21,000 total oil wells completed, peak output is 623 kb/d in early 2021. Fewer wells are completed relative to the North Dakota Bakken and Permian basin because the wells are less profitable.

chart/

Other US lto

For US other LTO, much of the output is from condensate from gas wells so the analysis is more approximate and a discounted cash flow analysis is beyond the scope of this post, the “average well” produces only about 38 kb over its life, but in many cases the output of natural gas makes the well profitable, there are some areas where shaleprofile.com does not have data such as the Anadarko basin, so I have simply taken the average well profile for areas covered (excluding ND Bakken, Eagle Ford, Permian and Niobrara) and then found the number of these “average wells” that fit US other LTO output data from the EIA(including Anadarko). The true average well profile for all areas including Anadarko is unknown.

…click on the above link to read the rest of the article…

Estimating Texas Production-Bridging the Gap

ESTIMATING TEXAS PRODUCTION-BRIDGING THE GAP

chart/

(Details for the chart above are explained in the post.)

The Texas Railroad Commission (RRC) had the oil and gas production reported online in early 2005, and became fully online for producers and the public on Feb 14, 2005. At the time it was set up, it required the producers to input their production in the production file for existing approved leases, and in the pending lease data file for those leases which have not yet received an approved lease number by the RRC. Each month, the RRC only reports the oil and condensate that is currently updated that month which is in the production file.

Historically, the production did not seem to be completely reported. The lag time to near full reporting of RRC production went from almost 18 months, down to about nine months within the past two years. Even at nine months it leaves interested parties trying to find some way to estimate what current Texas oil production is.

EIA, of course, has been one of those interested parties. RRC, also, attempted to provide an estimate of current production from the initial report of the production file. The two entities were not close, at times, and left many calling RRC to find out why there was a discrepancy. Eventually, RRC stopped reporting an estimate, leaving EIA to be the primary estimator for Texas production in the month it is reported. EIA has improved its method, which is described on their website. Basically, it involves using drillinginfo.com current estimates compared to production reports sent in by the majority of the producers. That is simplified, as it is a massive effort to estimate Texas production for the current reporting month.

…click on the above link to read the rest of the article…

US Crude plus Condensate and Tight Oil, Jan 2018 Update

US Crude plus Condensate and Tight Oil, Jan 2018 Update

chart

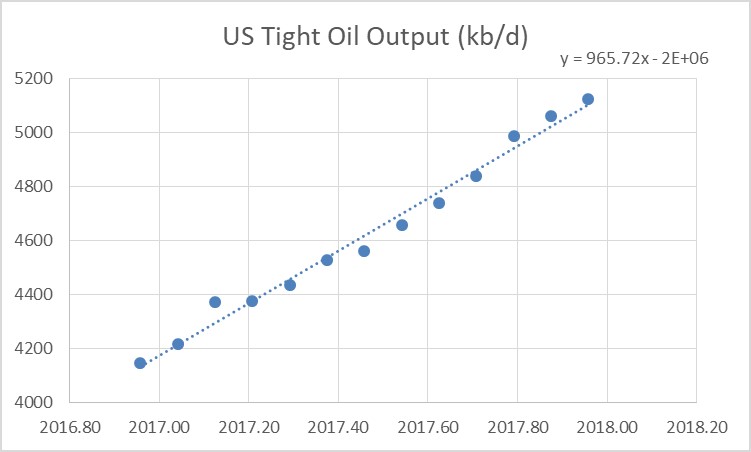
From Dec 2016 to Dec 2017 US Tight oil output has increased by 975 kb/d based on US tight oil output data from the EIA.

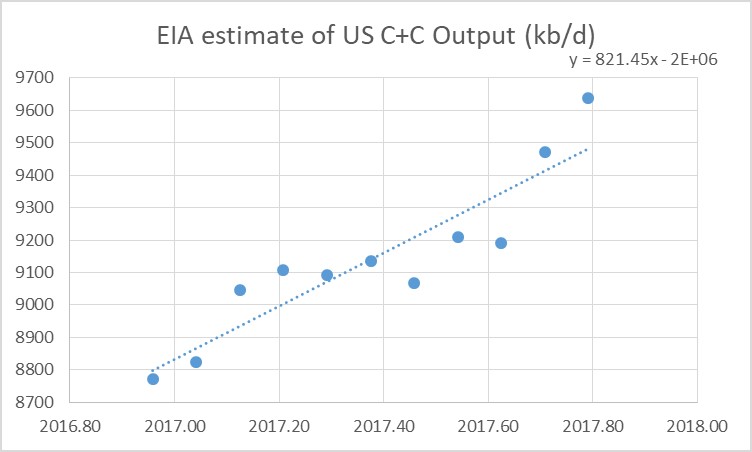
For the entire US we only have EIA monthly output estimates through Oct 2017. Over the Dec 2016 to Oct 2017 period US output has increased by 866 kb/d and the OLS trend has a slope of 821 kb/d.

chart/

Note that the 866 kb/d increase in US output over 10 months would be a 1040 kb/d increase over a 12 month period.

Most of the increase in US output has been from increased LTO output. The forecasts by several agencies (EIA, IEA, and OPEC) of more than a 1000 kb/d increase in US output in 2018 may assume that the recently increased oil price level will lead to increased investment in the oil sector.

Much of the increase in LTO output has been in the Permian basin and several factors may slow down the recent rapid growth. Among these are limited fracking crews, inadequate pipeline capacity for natural gas, which will limit output as flaring limits are reached, and potential water shortages.

Longer term the various LTO plays will run out of space to drill more wells in the tier one areas (the so-called sweet-spots) and this will limit the rate of increase within 2 or 3 years. It is likely that the Eagle Ford is close to this point, the Bakken might reach that point by 2019, and the Permian basin perhaps by 2021.

For US C+C output, I expect about a 600+/-100 kb/d increase in 2018.

Texas Update- November 2017

Texas Update- November 2017

Dean Fantazzini has provided his latest estimates of Texas oil and natural gas output.

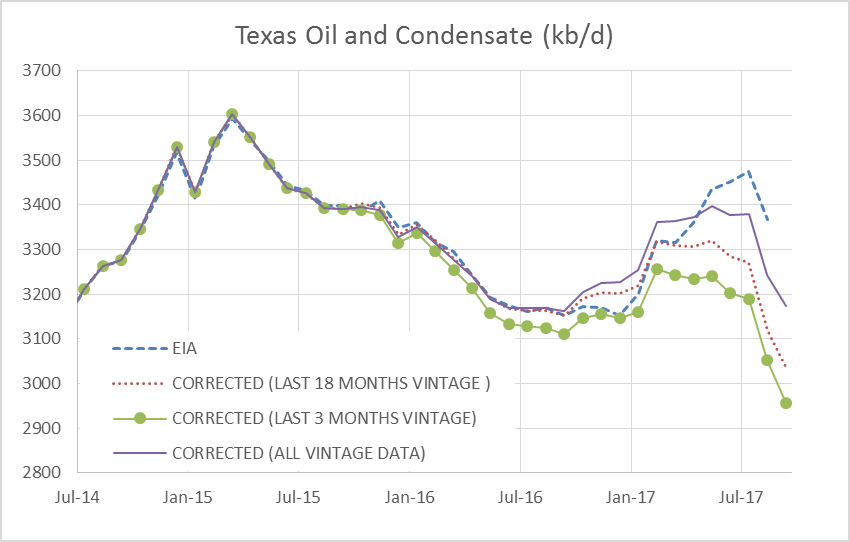
His analysis is based on RRC data only. Each RRC data set from Jan 2014 to Sept 2017 for crude and from April 2014 to Sept 2017 for condensate and natural gas are used in the “all data” estimate, the most recent 49 months of data are collected for each individual data set. After March 2016 there was a shift in the data for crude and condensate so for the C+C estimate, I include an estimate which uses all data from April 2016 to the most recent data point (“Corrected 18 month vintage”). Dean prefers to present an “all vintage data” estimate and an estimate using only the most recent 3 months “correction factors”. For Sept 2017 the all vintage data estimate is 3174 kb/d, the last 3 month vintage estimate is 2957 kb/d, and the last 18 month vintage estimate is 3039 kb/d with falls of 68, 96, and 80 kb/d respectively from the previous month.

chart/

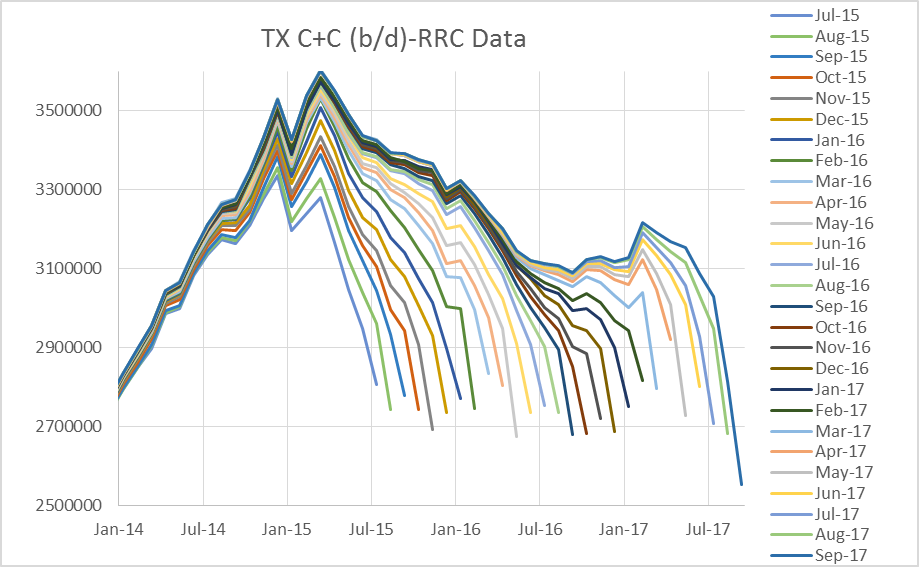
A chart I have not presented recently shows initial data reported for the past 26 months (July 2015 to Sept 2017). The change in the data around July 2016 is pretty clear. Notice how the lines start to become very closely spaced at about 6 to 8 months from most recent estimate, especially for the Sept 2016 to Feb 2017 period. This is an indication that the RRC data is improving.

chart/

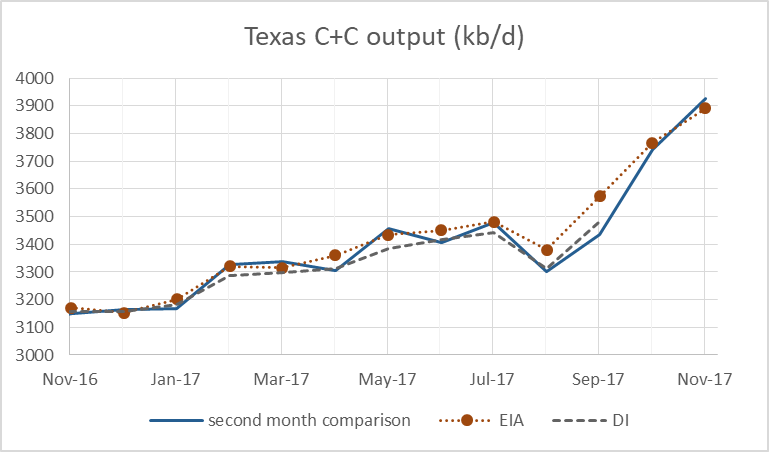
The Chart below is something new. It shows only the most recent data point from each of the data sets since March 2014 and compares with the data from drilling info which can be found at the EIA website. Notice that the RRC initial data from the RRC website’s online query does not always move in sync with the drilling info data due to fluctuations in the amount of pending lease data from month to month and other factors affecting the speed that data is reported and processed.

…click on the above link to read the rest of the article…

The Future of US Light Tight Oil (LTO)

The Future of US Light Tight Oil (LTO)

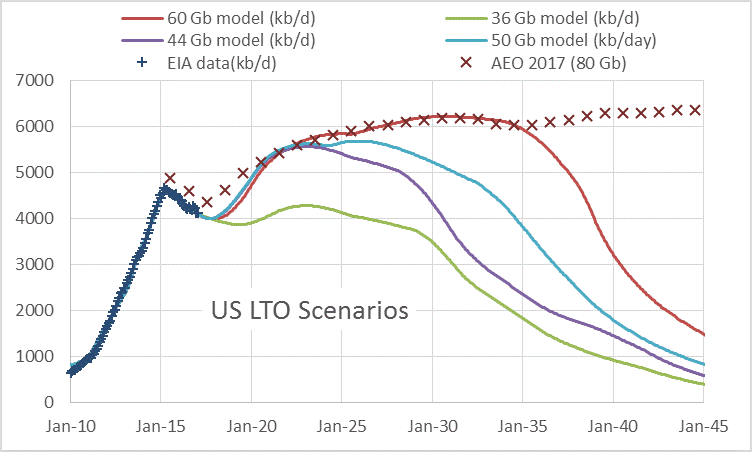
The future output from the light tight oil (LTO) sector of the US oil industry is the subject of much speculation. Above I present some possible future output scenarios based on a simple model of US LTO, the scenarios are compared with the EIA’s 2017 Annual Energy Outlook (AEO) reference scenario with cumulative output of 82 Gb from 2001 to 2050. The cumulative output of the model scenarios is for the same period (2001-2050).

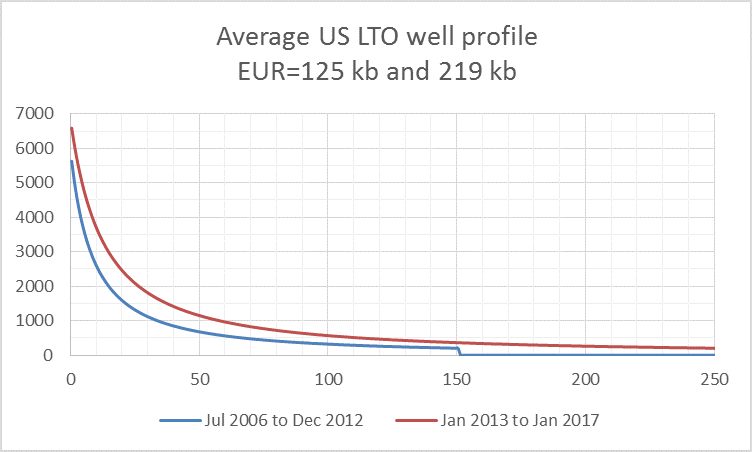
The models all use the same well profiles from 2006 to 2016 and are based on data gathered from Enno Peters excellent blog, shaleprofile.com. A preliminary hyperbolic profile was fit to the average LTO well data and then the parameters were fit using least squares and solver in Excel so that the model matched the data for output and number of wells added each month over the period from 2011 to 2015. The data for 2016 is incomplete and this leads to an under report of wells added for most of 2016 (from March through October). For this period the wells added were adjusted so that the model matched the output data from the EIA (which is more complete than the data reported at shaleprofile.com.)

The well profiles used are shown below, two were used, a lower profile for the early period and a higher well profile for the later period. The vertical axis is output in barrels per month and the horizontal axis is months from first output.

chart/

The well profile in red (219 kb) is the basis for all the scenarios. In every case it is assumed that the estimated ultimate recovery (EUR) or total output from the well over its life starts to decrease in Feb 2017, but the rate of decrease varies from model to model, based on underlying assumptions and the number of new wells added each month.

…click on the above link to read the rest of the article…

Texas Oil and Natural Gas Update- Sept 2016

Texas Oil and Natural Gas Update- Sept 2016

Dean has provided his monthly update for Texas Oil and Natural Gas.  The most recent month’s estimate is often volatile and may be ignored, the June and May estimates are likely pretty good (within 1% and 2%), the April 2016 estimate is likely to be robust(within 1% of the final value). The June EIA estimate is 240 kb/d lower than Dean’s estimate (about 7% too low).  The numbers above the lines are for Dean’s estimate and the numbers below the lines are the EIA estimates for each month.

TXchart/

The change in the correction factors over time is shown in the chart above in kb/d, this amount is added to the RRC estimate to get the “corrected” output given by Dean’s estimate. The average is the April 2014 to July 2016 average shown by the dotted lines (T and T-1 only). T is the most recent month reported, T-1 is the month before month T, etc.

TXchart/

The chart above shows how Dean’s estimates have changed over time, wth estimates from Jan 2015 to July 2016.   I have dropped the final 3 data points from each of the estimates, except for July 2016 where only the final month (July 2016) was dropped. Most months there was a tendency to underestimate output (except for the final 3 months of the estimate which is not shown in most cases). March 2016 was a notable exception, but even in that month’s estimate output was only too high by 0.6% relative to the July estimate after the most recent 3 months are dropped. By contrast the Nov 2015 estimate was 1.6% too low. The final 2 points of the July 2016 estimate in the chart above might be high or low by a few percent, but the April 2016 data point of 3434 kb/d for TX C+C output is likely to be within 1% of the final value.

…click on the above link to read the rest of the article…

Overview of the Northern Deepwater Gulf of Mexico

Overview of the Northern Deepwater Gulf of Mexico

The post that follows is a guest post by southlageo, a geologist with over 30 years of oil industry experience.

SouthLageo/

In this post, I will address 3 topics relating to the Northern Deepwater Gulf of Mexico –
1. Historical oil production
2. One view of the future of exploration
3. EUR ranges

I will limit my comments to oil production (not gas production). All production data is from BSEE/BOEM. The play outlines on the map are my best estimates. I will be using the BSEE definition of deepwater which includes water depths greater than 1000’. And, I will be assuming a Business As Usual future – by that I mean that fossil fuels will continue to be an important an energy source, and the world will continue to be able to afford them.

1. Historical production

Cumulative production to date from the deepwater GOM is about 7 billion barrels of oil (Bbo). Total shelf production is about 13 Bbo. The chart below shows both shelf (in green) and deepwater production (in brown/red), in annual, increments, going back to 1985. As you can see, shelf production dominated throughout the 80s and 90s, and then in 2000 deepwater production exceeded shelf production, and it has been that way ever since.

(The totals above include production from before 1985)

SouthLageo/

The 3 peaks in deepwater production, in 2002-2004, 2009-2010, and the present peak from 2014, are the results of advances in technologies that have allowed industry to march into deeper water and produce from deeper reservoirs.

The earliest peak was, in a sense, an extension of shelf play types into deepwater. The reservoirs were Pleistocene to Miocene in age, mostly bright-spot associated, and outboard of salt, and ranged in depth from ~10,000-20,000’. The biggest fields in this trend were Shell’s Mars/Ursa complex in Mississippi Canyon, and their Auger field in Garden Banks. Peak production approached 1 million barrels of oil per day (mmbopd).

…click on the above link to read the rest of the article…


Texas Oil and Natural Gas- June 2016

Texas Oil and Natural Gas- June 2016

TXchart/

As several commenters in the past have questioned Dean’s estimates (which I am convinced are robust, especially through March 2016), I asked Dean the following questions:

“At one point you thought there may have been a structural change in the data. Is that no longer the case? …. Are you seeing any issues that I … would have missed?”

He answered:

“I just tested the correcting factors for stationarity with panel unit root tests and the null of a unit root is rejected for all tests considered.”

I did some research on stationarity and unit root tests and then asked:

“So the mean and variance of the correcting factors do not change with time or follow any trend?”

He said that was correct.

Essentially the statistics suggest that the mean and variance of the correction factors have remained stable over the past 24 months and over time they are likely to approach their “true” value. The Chart below shows how the TX C+C correction factors have changed from Sept 2014 to April 2016.

TXchart/

The chart below shows how the estimates of TX C+C have changed from May 2015 to April 2016. The dashed lines suggest the estimates with the minimum correction factors (Nov 2015) and the maximum correction factors (March 2016).

…click on the above link to read the rest of the article…
Texas Update May 2016 and Eagle Ford Output Estimat

Texas Update May 2016 and Eagle Ford Output Estimate

blogchart/

Texas C+C output was 3549 kb/d in March 2016, about 39 kb/d higher than February.

blogchart/

Texas crude output was 3079 kb/d in March 2016, about 29 kb/d higher than February.

blogchart/

Condensate output was 470 kb/d in March 2016, 11 kb/d higher than February.

blogchart/

Natural gas output in Texas was 24,690 MMCF/d, 309 MMCF/d higher than February.

Using RRC data, I determined the percentage of Texas C+C output produced in the Eagle Ford Shale from April 2012 to March 2016. This percentage was than multiplied by Dean’s estimate for Texas C+C output to get an estimate of Eagle Ford C+C output from April 2012 to March 2016. The Chart below compares the RRC data for the Eagle Ford with my estimate using Dean’s Texas C+C estimate.

blogchart/

Eagle Ford output was about 1390 kb/d in March 2016, about 20 kb/d higher than February. The annual decline rate from Feb 2015 to March 2016 was about 220 kb/d or roughly 15% per year. Since November 2015 Eagle Ford output has declined very little. The red data points are used for the trend line in the chart below.

…click on the above link to read the rest of the article…
EIA’s Annual Energy Outlook and the Seneca Cliff

EIA’s Annual Energy Outlook and the Seneca Cliff

The scenario above shows an Oil Shock Model with a URR of 3600 Gb and EIA data from 1970 to 2015 and the Annual Energy Outlook (AEO) 2016 early release reference projection from 2016 to 2040. The oil shock model was originally developed by Webhubbletelescope and presented at his blog Mobjectivist and in a free book The Oil Conundrum.

The World extraction rate from producing reserves must rise to 15% in 2040 to accomplish this for this “high” URR scenario. This high scenario is 100 Gb lower than my earlier high scenario because I reduced my estimate of extra heavy oil URR (API gravity<10) to 500 Gb. The annual decline rate rises to 5% from 2043 to 2047 creating a “Seneca cliff”, the decline rate is reduced to 2% by 2060.

blogchart/

The scenario presented above uses BP’s Energy Outlook 2035, published in Feb 2016. This outlook does not extend to 2040, maximum output is 88 Mb/d in 2035 at the end of the scenario. This scenario is still optimistic, but is more reasonable than the EIA AEO 2016. Extraction rates rise to 10.6% and the annual decline rate rises to 2.5% in 2042 and is reduced to under 2% by 2053.

A problem with the BP Outlook is the expectation that US light tight oil (LTO) output will rise to 7.5 Mb/d from 2030 to 2035, the BP forecast for US LTO from 2013, 2014, 2015, and 2016 is shown below.

blogchart/

A more realistic forecast would be a peak of 6 Mb/d in 2022 with output declining to 3 Mb/d by 2035. The scenario below shows roughly what World output might be with this more realistic, but still optimistic scenario. There is a plateau in output at 85 Mb/d from 2025 to 2030 with annual decline rate peaking at 2.1% in 2044 and then falling under 2% per year from 2048 to 2070.

blogchart/


…click on the above link to read the rest of the article…
World Crude plus Condensate Decline Rate

World Crude plus Condensate Decline Rate

If none of these problems arises in the near term (say for the next ten years), and demand for oil is high enough to keep annual average oil prices above $75/b from 2018 to 2025, then the average annual decline rate of oil (C+C) output will remain under 2%.

For simplicity in the analysis that follows, I assume the peak in C+C output is 2015 and that output will decline at a relatively steady rate from 2015 to 2025. This in unlikely to be the case in practice and the actual path of future world output is unknown, the intention is to determine a likely trend line for World C+C output.  Using quarterly C+C output data from the EIA, I constructed the charts that follow.

Data is from the International Energy Statistics page at the EIA website.

The “Big 14” oil producers from 2002 to 2015 are (in order from largest to smallest): Russia, Saudi Arabia, United States, China, Iran, Mexico, Canada, UAE, Venezuela, Kuwait, Iraq, Nigeria, Norway, and Brazil. The Rest of the World (ROW) is all other oil producers besides the “Big 14”.
All charts below (except the natural log charts) are in kb/d.

declinepost/

The Big 14 increased C+C output by about 8 Mb/d from 2010 to 2015.

declinepost/

For the ROW C+C output decreased by about 3 Mb/d from 2010 to 2015.

declinepost/

To consider decline rates we look at the linear trend of the natural log of output. For the ROW the average annual decline rate was 2.69% from 2010 to 2015.

declinepost/

The C+C output of the Big 14 increased at an average annual rate of 2.71% from 2010 to 2015.

declinepost/

…click on the above link to read the rest of the article…
Texas Oil and Gas Production March 2016

Texas Oil and Gas Production March 2016

TXchart/

In the chart above corrected output is 3477 kb/d for TX C+C in Jan 2016, an increase of 73 kb/d from Dec 2015.  Note that from May 2015 to Dec 2015 the most recent month’s estimate has been about 28 kb/d too high on average, so actual Jan 2016 output might be about 3450 kb/d.

TXchart/

The chart above compares Dean’s corrected C+C estimate with both the EIA estimate and RRC data which is incomplete for the most recent 24 months. The “RRC error %” is Dean’s “corrected” divided by RRC data minus one times 100 and is read from the right axis.

TXchart/

Texas oil output was 3014 kb/d in Jan 2016 based on Dean’s corrected estimate, an increase of 73.5 kb/d from Dec 2015.

TXchart/

The corrected Texas condensate output was 463 kb/d in Jan 2016, a decrease of 1 kb/d from Dec 2015.

TXchart/

The chart above is in thousands of cubic feet per day. The Jan 2016 corrected estimate is 2381 million cubic feet per day, a decrease of 176 million cubic feet per day from Dec 2015.

TXchart/

The chart above shows how Dean’s estimates have changed over time from April 2015 to Jan 2016. Notice especially the big change in the estimates from April to June 2015, after that the estimates seem to converge nicely from June 2015 through Jan 2016. My guess is that the data processing in Texas has been improving dramatically over the past 7 months.

…click on the above link to read the rest of the article…
Coal Shock Model

Coal Shock Model

blog1603/

The eventual peak in World fossil fuel output is a potentially serious problem for human civilization. Many people have studied this problem, including Jean LaherrereSteve MohrPaul Pukite (aka Webhubbletelescope), and David Rutledge.

I have found Steve Mohr’s work the most comprehensive as he covered coal, oil, and natural gas from both the supply and demand perspective in his PhD Thesis. Jean Laherrere has studied the problem extensively with his focus primarily on oil and natural gas, but with some exploration of the coal resource as well. David Rutledge has studied the coal resource using linearization techniques on the production data (which he calls logit and probit).

Paul Pukite introduced the Shock Model with dispersive discovery which he has used primarily to look at how oil and natural gas resources are developed and extracted over time. In the past I have attempted to apply Paul Pukite’s Shock Model (in a simplified form) to the discovery data found in Jean Laherrere’s work for both oil and natural gas, using the analysis of Steve Mohr as a guide for the URR of my low and high scenarios along with the insight gleaned from Hubbert Linearization.

In the current post I will apply the Shock model to the coal resource, again trying to build on the work of Mohr, Rutledge, Laherrere, and Pukite.

A summary of URR estimates for World coal are below:

blog1603/

The “Laherrere+Rutledge” estimate uses the Rutledge best estimate for the low case and Laherrere’s low and medium cases for the medium and high cases. Laherrere also has a high case of 750 Gtoe for the World coal URR, which seems too optimistic in my opinion. The “high” estimate of Steve Mohr has been reduced from his “Case 3” estimate of 670 Gtoe by 40 Gtoe because I have assumed lignite and black coal resources are lower than his high estimate.

…click on the above link to read the rest of the article…
Olduvai IV: Courage
Click on image to read excerpts

Olduvai II: Exodus
Click on image to purchase

Click on image to purchase @ FriesenPress