Home » Posts tagged 'debt to gdp'

Tag Archives: debt to gdp

Olduvai
Click on image to purchase

Olduvai III: Catacylsm
Click on image to purchase

Post categories

Post Archives by Category

This Implosion Will Be Fast–Hold Onto Your Seats

THIS IMPLOSION WILL BE FAST – HOLD ONTO YOUR SEATS

The massive money creation in the 2000s has led to a debt and asset bubble, which is about to burst. Investors will be shocked by the speed of the decline and won’t react before it is too late.

The massive money creation by central and commercial banks in this century has resulted in a growth of global assets from $450 trillion in 2000 to $1,540 trillion in 2020.

DEBT TO GDP GROWTH

As the chart below shows US debt to GDP held well below 25% from 1790 to the 1930s, a period of almost 150 years. The depression with the New Deal followed by WWII pushed debt to GDP up to 125%. Then after the war, the debt  came down to around 30% in the early 1970s.

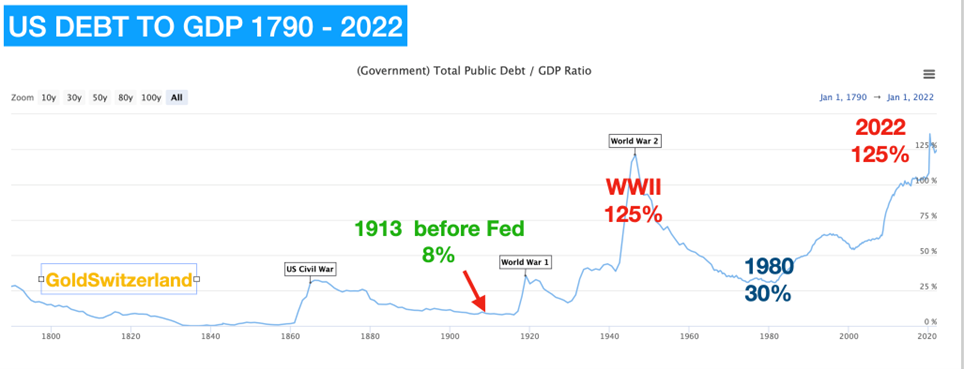
The closing of the gold window in 1971 ended all fiscal and monetary discipline. Since then, the US and much of the Western world has seen debt to GDP surge to well over 100%. In the US, Public Debt to GDP is now 125%. Back in 2000 it was only 54% but since then we have seen a vote buying system with a money printing bonanza and an exponential increase in debt to 125%.

A major part of the debt increase has gone to finance the rapid growth in property values.

The table below shows that property has grown on average by 250% between 2000 and 2020. So individuals are creating wealth by swapping properties with each other. Hardly a sustainable form of wealth creation.

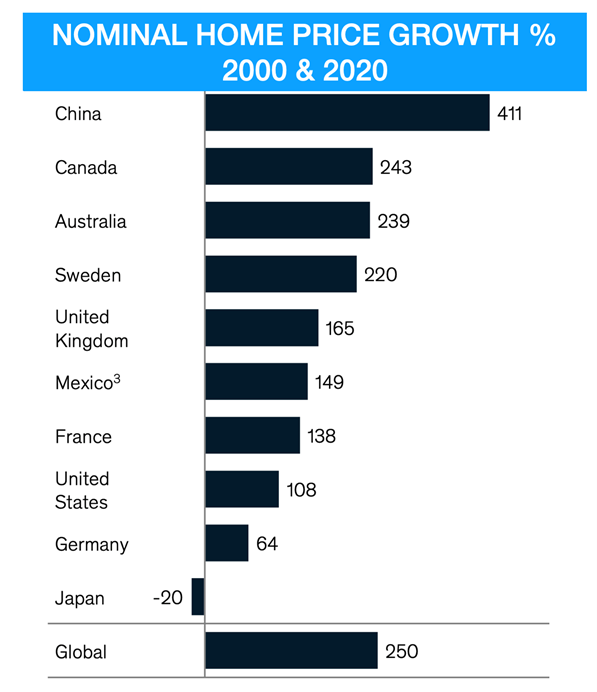
The exponential growth in property prices has been global although countries like China, Canada, Australia and Sweden stand out with over 200% gains since 2000. Most of the properties bought in the last 20+ years involve massive leverage. When the property bubble soon bursts, many property owners will have negative equity and could easily lose their homes.

…click on the above link to read the rest of the article…

The Only Way Out of the Death Trap

The Only Way Out of the Death Trap

I’ve said the U.S. is caught in a debt death trap. Monetary policy won’t get us out because the velocity of money, the rate at which money changes hands, is dropping.

Printing more money alone will not change that.

Fiscal policy won’t work either because of high debt ratios. At current debt-to-GDP ratios, each additional dollar spent yields less than a dollar of growth. But because it must be borrowed, it does add a dollar to the debt. Debt becomes an actual drag on growth.

The ratio gets higher, and the situation grows more desperate. The economy barely grows at all while the debt mounts. You basically become Japan.

The national debt is $27.8 trillion. A $27.8 trillion debt would not be an issue if we had a $50 trillion economy.

But we don’t have a $50 trillion economy. We have about a $21 trillion economy, which means our debt is bigger than our economy.

The debt-to-GDP ratio is about 130%. Before the pandemic, it was about 105% (the policy response to the pandemic caused the spike).

Already in the Danger Zone

But even a ratio of 105% is in the danger zone.

Economists Ken Rogoff and Carmen Reinhart carried out a long historical survey going back 800 years, looking at individual countries, or empires in some cases, that have gone broke or defaulted on their debt.

They put the danger zone at a debt-to-GDP ratio of 90%. Once it reaches 90%, debt becomes a drag on growth.

Meanwhile, we’re looking at deficits of $1 trillion or more, long after the pandemic subsides.

In basic terms, the United States is going broke. We’re heading for a sovereign debt crisis.

I don’t say that for effect. I’m not looking to scare people or to make a splash. That’s just an honest assessment based on the numbers.

…click on the above link to read the rest of the article…


The “Great Reset” And The Risk Of Greater Interventionism

The “Great Reset” And The Risk Of Greater Interventionism

The “Great Reset” And The Risk Of Greater Interventionism

Global debt is expected to soar to a record $277 trillion by the end of the year, according to the Institute of International Finance. Developed markets’ total debt -government, corporate and households- jumped to 432% of GDP in the third quarter. Emerging market debt-to-GDP hit nearly 250% in the third quarter, with China reaching 335%, and for the year the ratio is expected to reach about 365% of global GDP. Most of this massive increase of $15 trillion in one year comes from government and corporates’ response to the pandemic. However, we must remember that the total debt figure already reached record-highs in 2019 before any pandemic and in a period of growth.

The main problem is that most of this debt is unproductive debt. Governments are using the unprecedented fiscal space to perpetuate bloated current spending, which generates no real economic return, so the likely outcome will be that debt will continue to rise after the pandemic crisis is ended and that the level of growth and productivity achieved will not be enough to reduce the financial burden on public accounts.

In this context, The World Economic Forum has presented a roadmap for what has been called “The Great Reset”. It is a plan that aims to take the current opportunity to “to shape an economic recovery and the future direction of global relations, economies, and priorities”. According to the World Economic Forum, the world must also adapt to the current reality by “directing the market to fairer results, ensure investments are aimed at mutual progress including accelerating ecologically friendly investments, and to start a fourth industrial revolution, creating digital economic and public infrastructure”. These objectives are obviously shared by all of us, and the reality shows that the private sector is already implementing these ideas, as we see technology, renewable investments and sustainability plans thriving all over the world.

…click on the above link to read the rest of the article…

The United States Is Going Broke

The United States Is Going Broke

Those who focus on the U.S. national debt (and I’m one of them) keep wondering how long this debt levitation act can go on.

The U.S. debt-to-GDP ratio is at the highest level in history (106%), with the exception of the immediate aftermath of the Second World War. At least in 1945, the U.S. had won the war and our economy dominated world output and production. Today, we have the debt without the global dominance.

The U.S. has always been willing to increase debt to fight and win a war, but the debt was promptly scaled down and contained once the war was over. Today, there is no war comparable to the great wars of American history, and yet the debt keeps growing.

In a new Weekly Standard article, the celebrated James Grant of Grant’s Interest Rate Observer reviews not only the current debt and deficit situation but provides an overview of the U.S. national debt since George Washington and Alexander Hamilton.

Grant makes the point that the debt has been increased and decreased on a regular basis but never until today was there a view that the deficit didn’t matter and could be increased indefinitely.

He points out that it took the United States 193 years to accumulate its first trillion dollars of federal debt. And amazingly, that it will add that much in the current fiscal year alone.

Grant also describes how these historic debt management efforts have been bipartisan.

Republicans Harding and Coolidge reduced the debt; the Democrat Andrew Jackson actually eliminated the debt in 1836. Today there is bipartisan profligacy. The article lays out the big picture and the likelihood of a U.S. debt crisis sooner rather than later.

…click on the above link to read the rest of the article…

S&P Reveals $5.8 Trillion In “Hidden” Chinese Debt With “Titanic Credit Risks”

When it comes to estimating China’s total outstanding debt, there has long been confusion about the real number with most putting the debt/GDP at around 250%, while the IIF last year calculated China’s debt load as high as 300% of GDP.

Now, China watchers can one add another ~40% of debt/GDP to the total because according to S&P, China’s local governments have accumulated 40 trillion yuan ($5.8 trillion) – or even more – in off-balance sheet debt, suggesting the already record surge in defaults is set to accelerate further.

“The potential amount of debt is an iceberg with titanic credit risks,” S&P credit analysts wrote in a report Tuesday, Bloomberg reported, with much of the build-up related to local government financing vehicles, which don’t necessarily have the full financial backing of local governments themselves.

LGFV debt has emerged as a growing risk for China’s economy, because with the national economy slowing, and as a result of a crackdown on shadow lending and a Beijing quota for issuance of local-government bonds not enough to fund infrastructure projects to support regional growth, authorities across the country have resorted to LGFVs to raise financing, according to S&P.

That’s left LGFVs “walking a tightrope” between deleveraging and transforming their businesses into more typical state-owned enterprises, S&P warned.

Meanwhile, debt vulnerabilities continue to rise as a result of the previously reported record surge in Chinese corporate defaults this year, as Beijing seeks to roll back a decades-old practice of implicit guarantees for debt.

And while so far LGFV debt has avoided an event of default, several issues have come close, with local government bailouts taking place only in the last minute, adding to concerns about LGFVs vulnerabilities. Meanwhile, according to S&P the riskiest LGFVs include the following:

…click on the above link to read the rest of the article…

America’s Greatest Crisis Upon Us…Debt to GDP Makes It Clear

America’s Greatest Crisis Upon Us…Debt to GDP Makes It Clear

America in the midst of its greatest crisis in its 242 years of existence.  I say this based upon the US federal debt to GDP (gross domestic product) ratio.  In the history of the US, at the onset of every war or crisis, a period of federal deficit spending ensued (red bars in graph below) to overcome the challenge but at the “challenges” end, a period of federal austerity ensued.  Until now.  No doubt the current financial crisis ended by 2013 (based on employment, asset values, etc.) but federal spending continues to significantly outpace tax revenues…resulting in a continually rising debt to GDP ratio.  We are well past the point where we have typically began repairing the nation’s balance sheet and maintaining the credibility of the currency.  However, all indications from the CBO and current administration make it clear that debt to GDP will continue to rise.  If the American economy were as strong as claimed, this is the time that federal deficit spending would cease alongside the Fed’s interest rate hikes.  Instead, surging deficit spending is taking place alongside interest rate hikes, another first for America.
The chart below takes America from 1790 to present.  From 1776 to 2001, every period of deficit spending was followed by a period of “austerity” where-upon federal spending was constrained and economic activity flourished, repairing the damage done to the debt to GDP ratio and the credibility of the US currency.  But since 2001, according to debt to GDP, the US has been in the longest ongoing crisis in the nations history.

But what is this crisis?  The chart points out the debt to GDP surges in order to resolve the Revolutionary war, the Civil War, WWI, and WWII. But the debt to GDP surges since 1980 seem less clear cut.  But simply put, America (and the world) grew up and matured, but the central banks and federal government could not accept this change.

…click on the above link to read the rest of the article…

Fed’s Dilemma: Debt-to-GDP Ratios Dramatically Understate the Debt Problem

Reader Lars writes Debt-to-GDP ratios understate the true nature of the problem. He uses Greece as an example.

Reader Lars from Oslo, the capital of Norway, and a long-time reader of this blog, questions the widespread use of debt-to-GDP as the true measure of the debt problems of a country.

Hello Mish

As we approach the next debt crisis it’s time to ask some questions.

The widespread measurement of the debt problems of a country is DEBT as a percentage of GDP.

Few analysts question this ratio. But this is how I see things.

GDP = Consumption + Investment + Government Spending + Net Exports.

In simpler terms, GDP is the sum of the private sector plus the public sector plus the net trade balance.

However, only the Private Sector pays taxes and that is what enables debt service. In fact, the private sector must service its own debt as well as that of the public sector.

Thus, a better metric to measure debt levels is private sector GDP as reflected in tax income. This tells us the true brutal story of the debt problem.

Using Greece as an example, the real public debt is over 300% of GDP. Given that Greece’s private sector is less than 50% of GDP, the brutal reality is that Greece has a debt level which is over 600% of Private Sector GDP.

The Greek state takes in around €65 billions in tax. This is approximately 10% of total debts.

During the previous Greek debt crisis, economists noted that Greek debt was less than 2% of global debt.

The problem is that the rest of the world is not going to service the Greek debt. The Greek taxpayer will service the Greek debt, and for him the bill is insurmountable.

…click on the above link to read the rest of the article…

Global Debt Hits Record $237 Trillion, Up $21TN In 2017

Last June we reported  that according to the Institute of International Finance – perhaps best known for its periodic and concerning reports summarizing global leverage statistics – as of the end of 2016, in a period of so-called “coordinated growth”, global debt hit a new all time high of $217 trillion, over 327% of global GDP, and up $50 trillion over the past decade.

Six months later, on January 4, 2018, the IIF released another global debt analysis, which disclosed that global debt rose to a record $233 trillion at the end of Q3 of 2017 between $63Tn in government, $58Tn in financial, $68TN in non-financial and $44Tn in household sectors, a total increase of $16 trillion increase in just 9 months.

Now, according to its latest quarterly update, the IIF has calculated that global debt rose another $4 trillion in the past quarter, to a record $237 trillion in the fourth quarter of 2017, and more than $70 trillion higher from a decade earlier, and up roughly $20 trillion in 2017 alone.

The IIF report, which also sources data from the IMF and BIS, found that the share of global debt remains well above 300% of global GDP, with mature market, i.e., DM, debt/GDP now at 382%. The silver lining: that number was slightly below recent levels, as increasing GDP growth in DMs helped reduce the debt-to-GDP ratio. However, this was more than offset by a surge in debt in emerging markets, where total debt/GDP is now well above 200%.

The good news, if only temporarily, is that on a consolidated basis, global debt/GDP fell for the fifth consecutive quarter as global growth accelerated: the ratio is now around 317.8%, or 4% points below the all time high hit in Q43 2016. To be sure, even a modest slowdown in GDP growth, let alone a contraction, will promptly send the ratio surging to new all time highs.


…click on the above link to read the rest of the article…

Broken Promises

Demanding More Debt

Consumer debt, corporate debt, and government debt are all going up.  But that’s not all.  Margin debt – debt that investors borrow against their portfolio to buy more stocks – has hit a record of $642.8 billion.  What in the world are people thinking?

A blow-off in margin debt mirroring the blow-off in stock prices. Since February of 2016 alone it has soared by ~$170 billion – this is an entirely new level insanity. The current total of 643 billion is more than double the level of margin debt at the tech mania peak and 15.4 times the amount of margin debt just before the crash of 1987. [PT]

Clearly, they’re not thinking.  Because thinking takes work.  Most people don’t like to work.  They like to pretend to work.

Similarly, people may say they care about debt.  But, based on their actions, they really don’t.  When it comes to the national debt, the overarching philosophy is that it doesn’t matter. Government debt certainly doesn’t matter to Congress.  Nor does it matter to the President.  In fact, their actions demonstrate they want more of it.

Big corporations with big government contracts want more government debt too. Their businesses demand it. They’ve staked their success on the expectation that the debt slop will continue flowing down the trough where they consume it like rapacious pigs.

The higher education bubble is also based on a faulty foundation of debt. The business model generally requires signing credulous 18 year-olds up for massive amounts of government backed student loans. From what we gather, federal student loan debt is closing in on $1.4 trillion.


Total student loans outstanding (red line – the data are only available from 2007 onward) and total federal government-owned student loans (black line). The former figure was closing in on $1.5 trillion as of Q4 2017. [PT]

…click on the above link to read the rest of the article…

The Liquidity Punch Bowl

THE LIQUIDITY PUNCH BOWL

It is appropriate with the inauguration of this weekly column to look at the “Big Picture”. The biggest risk to world stock markets, and asset prices in general, in 2018 is that G7 central banks (led by the Federal Reserve) are finally attempting to normalise monetary policy nine years after the American central bank commenced quantitative easing in December 2008, in the midst of the so-called “global financial crisis”.

Since late 2008, G7 central banks, comprising the Fed, the Bank of Japan, the European Central Bank and the Bank of England, have committed to massive balance sheet expansion (through the purchase of mortgage and government debt). Their balance sheets continued to rise in aggregate during 2017 even though the Fed itself stopped expanding its own balance sheet in November 2014. Aggregate assets of G7 central banks increased by 17.2% last year to $15.2tn at the end of 2017, up from US$4.3tn at the beginning of 2008 (see following chart).

Sources: Bloomberg, Federal Reserve, Bank of England, ECB, Bank of Japan, CEIC Data, CLSA

That the Fed has commenced balance sheet reduction from last October is a risk for stock markets since it amounts to another form of monetary tightening, in addition to interest rate hikes. That it has not yet caused market fallout reflects two factors:

  1. The Fed is beginning extremely tentatively by decreasing its reinvestment of principal payments from maturing bonds.
  2. Other G7 central banks are still expanding in aggregate, albeit at a slower pace. This is why there will be much focus on what the European Central Bank will do in coming months. For now, it looks like G7 central bank balance sheets will start to contract in aggregate in 2019 rather than 2018. 

…click on the above link to read the rest of the article…

Is the High Level of Debt a Major Economic Risk Factor?

Many economic commentators regard high level of debt relative to GDP as a major risk factor as far as economic health is concerned. This way of thinking has its origins in the writings of the famous American economist Irving Fisher. According to Irving Fisher,[1] a high level of debt relative to GDP runs the risk of setting in motion deflation and in turn a severe economic slump. On this way of thinking, the high level of debt sets in motion the following sequence of events that culminate in a severe economic slump.

Stage 1: The debt liquidation process is set in motion because of some random shock. For instance a sudden large fall in the stock market. The act of debt liquidation forces individuals into distressed selling of assets.

Stage 2: Because of the debt liquidation, the money stock starts shrinking and this in turn slows down the velocity of money.

Stage 3: A fall in money leads to a decline in the price level.

Stage 4: The value of people’s assets falls whilst the value of their liabilities remains intact. This results in a fall in the net worth, which precipitates bankruptcies.

Stage 5: Profits start to decline and losses emerge.

Stage 6: Production, trade and employment are curtailed.

Stage7:  All this leads to growing pessimism and a loss of confidence.

Stage 8: This in turn leads to the hoarding of money and a further slowing in the velocity of money.

Stage 9: Nominal interest rates fall, however, because of a fall in prices real interest rates rise.

Note that the critical stage in this story is the stage 2 i.e. debt liquidation results in a decline in the money stock. However, why should debt liquidation cause a decline in the money stock?

…click on the above link to read the rest of the article…

Debt to GDP: Only 4 Major Countries Worse Off Than the US

Of major nations, only Japan, Greece, Italy, and Portugal have debt-to-GDP ratios higher than the US.

With the new tax overhaul, U.S. government debt will rise by one to two trillion dollars over the next decade. I view that assessment as majorly optimistic as it assumes no recession and unlikely growth.

Citing IMF statistics, the Wall Street Journal reports Just Four Large Countries Have a Higher Debt Burden Than the U.S.

Japan’s government carries debts at 240.3% of gross domestic product, far and away the world’s largest burden. Japan has struggled in recent decades to tackle its debt, in part because its economy has been stagnant. Attempts to raise revenue via higher taxes have often knocked the economy into recessions. Tax cuts haven’t generated enough growth to ease debt burdens.

The Bank of Japan has embarked on the world’s most aggressive monetary policies, including decades of rates near zero, and the world’s largest asset-purchase program. None of it has revived growth or inflation, meaning Japan’s debt burden has been slowly grinding higher. (Although the low rates have meant the costs to the government of servicing that debt have remained under control.)

Japan’s government debt has been a persistent fiscal challenge, but never quite blossomed into a full-blown crisis.

The next three nations haven’t been so lucky. Greece’s debt-to-GDP stands at 180.2% of GDP, Italy’s at 133% and Portugal’s at 125.7%. When the global financial crisis struck, and government revenues plunged around the world, Greece and Portugal found themselves unable to manage debts on their own. Both nations turned to international bailouts to make it through the years of weak growth that followed. All three nations have had to bail out some of their largest banks in order to keep their financial systems from collapsing.

…click on the above link to read the rest of the article…

When This Debt Bubble Bursts, Central Banks Will Turn to Money Printing… Again

When This Debt Bubble Bursts, Central Banks Will Turn to Money Printing… Again

Let’s face the facts.

The only reason the financial system has held together so well since 2008 is because Central Banks have created a bubble in bonds via massive QE programs and seven years of ZIRP/NIRP.

As a result of this, the entire world has gone on a debt binge issuing debt by the trillions of dollars. Today, if you looked at the world economy, you’d find it sporting a Debt to GDP ratio of over 327%.

Well guess what? The REAL situation is even worse than this. The Bank of International Settlements (the Central Banks’ Central Bank) just published a report  revealing that globally the financial system has $13 trillion MORE debt hidden via junk derivatives contracts.

Global debt may be under-reported by around $13 trillion because traditional accounting practices exclude foreign exchange derivatives used to hedge international trade and foreign currency bonds, the BIS said on Sunday.

Source: Yahoo! Finance.

As has been the case for every single crisis since the mid’90s, the problem is derivatives.

Consider that as early as 1998, soon to be chairperson of the Commodity Futures Trading Commission (CFTC), Brooksley Born, approached Alan Greenspan, Bob Rubin, and Larry Summers (the three heads of economic policy) about derivatives.

Born said she thought derivatives should be reined in and regulated because they were getting too out of control. The response from Greenspan and company was that if she pushed for regulation that the market would “implode.”

Fast-forward to 2007, and once again unregulated derivatives trigger a massive crisis, this time regarding the Housing Bubble

And today, we find out that once again, derivatives are at the root of the current bubble (debt). And once again, the Central Banks will be cranking up the printing presses to paper over this mess when the stuff hits the fan.

…click on the above link to read the rest of the article…

Canada Flagged for Recession by BIS

Canada Flagged for Recession by BIS

canadadebt

This can’t be good…

As if Canadians needed more proof that the country’s real estate is in a bubble, and that this misallocation has spread to other sectors of the economy, the Bank of International Settlements released its latest quarterly confirming what any critical observer can see: binging on debt is rarely a good idea.

Canada’s debt-to-GDP gap is widening and even the central bank of central banks is concerned.

The BIS uses its credit-to-GDP analysis as an indicator and predictor of troubling economic waters. They claim successes in predicting financial crises in the United States, England and a few other economies. Generally speaking, according to the BIS, when a country’s credit-to-GDP gap is higher than 10% for more than a few years, a banking crisis emerges which is followed by a recession.

Canada entered that territory in 2015, warmly welcomed by the Chinese who’s debt-to-GDP gap has put them in the danger zone for at least the last five years.

In another parallel universe, perhaps Canadian authorities took the correct measures to counteract this high credit-to-GDP gap or to even prevent it from getting this out of control. But in our reality, we kept trudging across the tundra, mile after mile, pushing our credit-to-GDP gap up to 17.4%.

China’s “basic dictatorship” means they can turn their economy around on a dime, or so goes the thinking. Perhaps they will better absorb the economic slap in the face compared to Canada’s relatively freer market and less dictatorial government. 

Still, both countries have a massive real estate bubble. In China, entire cities are centrally planned and built by government-connected contractors only to house absolutely nobody. 

Wealthy Chinese families, witnessing the crony-capitalist chaos and subsequent malinvestments, have taken their hard-earned cash and moved it overseas. Enter stage-right the true north strong and free enough. Foreign speculation has helped drive up real estate prices in places like Vancouver and Toronto.

…click on the above link to read the rest of the article…

IMF Blames Bad Loans For Mozambique’s Soaring Debt-To-GDP Ratio

IMF Blames Bad Loans For Mozambique’s Soaring Debt-To-GDP Ratio

Mozambique has a broad swath of problems within its governing councils.  Back in December of 2005, Management Systems International based out of Washington issued a report titled CORRUPTION ASSESSMENT: MOZAMBIQUE which said point blank: “The scale and scope of corruption in Mozambique are cause for alarm”.

Mozambique’s head of state Joaquim Chissano left office in February 2005 after 15 years.  His replacement, Armando Guebza, that same year opened Mozambique’s coastline to international companies seeking to search for resources.  Between 2005 and 2006 three firms were able to capture rights to explore the coast, Anadarko, Italy’s Eni, and Petronas.  Some 75 trillion cubic feet of natural gas was discovered and this set of a a blitz into Mozambique as international banks, corporations, and organizations flooded the area.  This opened a breeding ground for corruption and unregulated financing, specifically the controversial Tuna Bond that was supposed to be used to support regional fishing and was instead used for military expenditures and to purchase some 40 boats that remain anchored to this day.

The Collapse Of Mozambique’s FX – Annotated With Key Events

On Friday Reuters said the IMF blamed “undisclosed loans” for Mozambique’s 86% Debt/GDP ratio.

“Mozambique’s economic growth will likely slow to 4.5 percent in 2016 from 6.6 percent the previous year due to rapidly rising inflation and growing government debt, the International Monetary Fund said on Friday. The leader of a Fund team that visited the southern African country, Michel Lazare, said the discovery of more than $1 billion of previously undisclosed government debt would increase pressure on the economy.”

On April 19 2015 the IMF suspended its disbursement of $155M payment as part of a larger $286M emergency loan that was established as a means of stabilizing the nation’s currency after it collapsed.  What’s frustrating is that the IMF is blaming the 86% Debt-to-GDP as if they had not planned for it.

…click on the above link to read the rest of the article…

Olduvai IV: Courage
Click on image to read excerpts

Olduvai II: Exodus
Click on image to purchase

Click on image to purchase @ FriesenPress