Home » Posts tagged 'crude oil production'

Tag Archives: crude oil production

Olduvai
Click on image to purchase

Olduvai III: Catacylsm
Click on image to purchase

Post categories

Post Archives by Category

Peak oil in Africa part1: OPEC quotas Jan 2021

Peak oil in Africa part1: OPEC quotas Jan 2021

We examine whether OPEC’s quotas for its African members are actually on the production decline path of these countries.

OPEC’s quota levels can be found here:
https://www.opec.org/opec_web/static_files_project/media/downloads/Voluntary%20Production%20Levels.pdf

At present 7 oil producing countries in Africa are members of OPEC:

Algeria, Nigeria, Libya, Angola (2007), Gabon (2016), Equatorial Guinea (2017) and Congo Brazzaville (2018) https://www.opec.org/opec_web/en/about_us/25.htm

Historic peaks

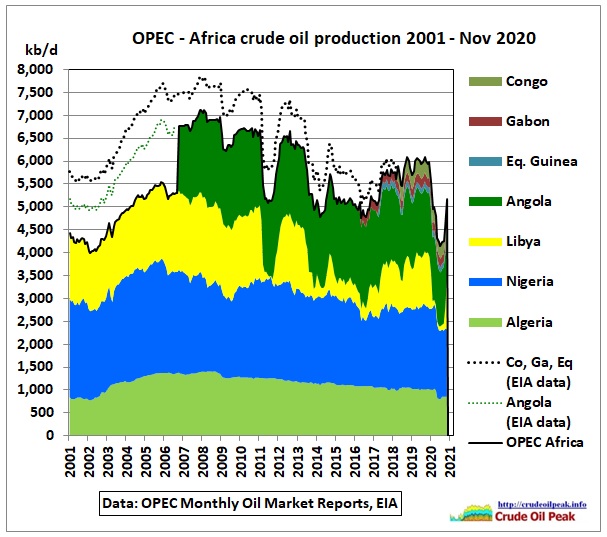
Fig 1a: African countries which joined OPEC

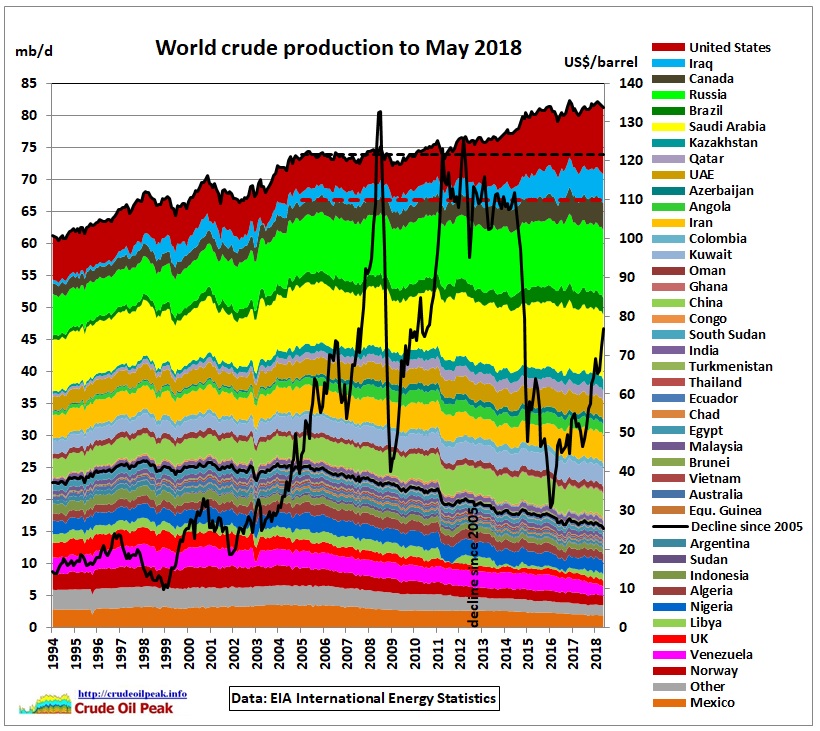
The stacking order in the above graph is important for understanding the history. We start with Algeria at the bottom because this country seems to have the most reliable production. Next in the stack is Nigeria which shaped the November 2005 peak. Then Libya with an erratic production profile after the 17th February Revolution in 2011. Both Algeria and Libya were still growing when Nigeria peaked:

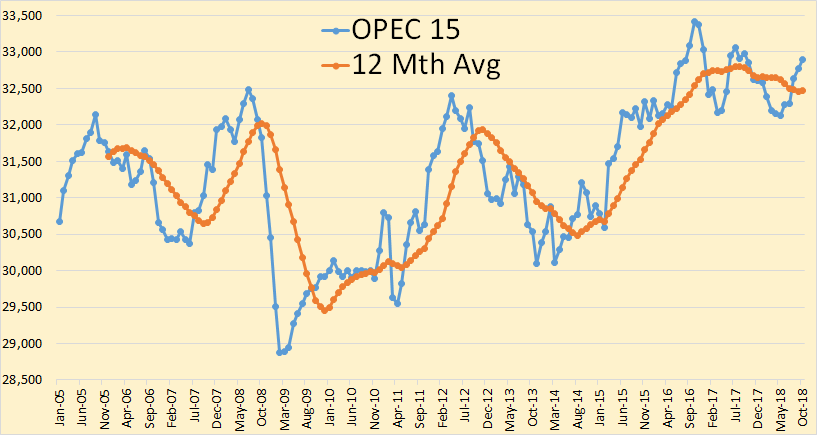
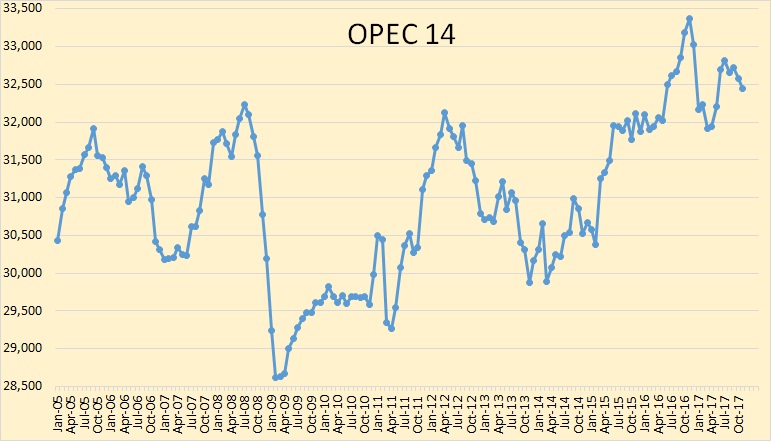
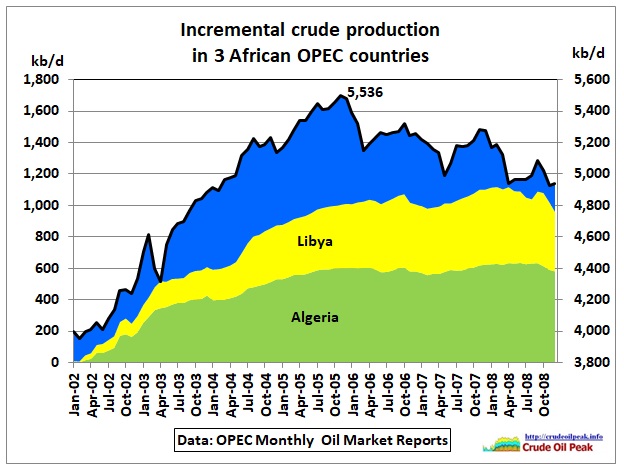
Fig 1b: OPEC w/o Angola peaked in Nov 2005 at 5,536 kb/d

OPEC then took in Angola in 2007 to overcome this embarrassing situation, but Angola itself also approached its peak a year later, in 2008, which shaped the common peak of 4 countries in Nov 2007 – Mar 2008 at 7.1 mb/d. The dotted lines in Fig 1a show production including Angola and 3 other countries before joining OPEC.

Trendlines

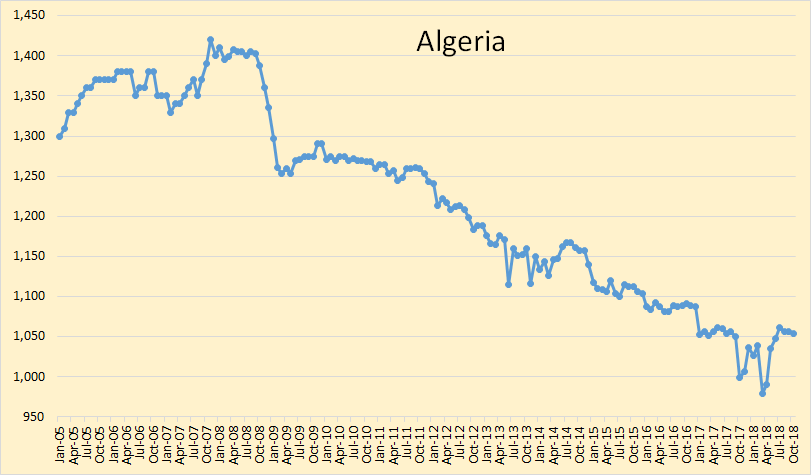
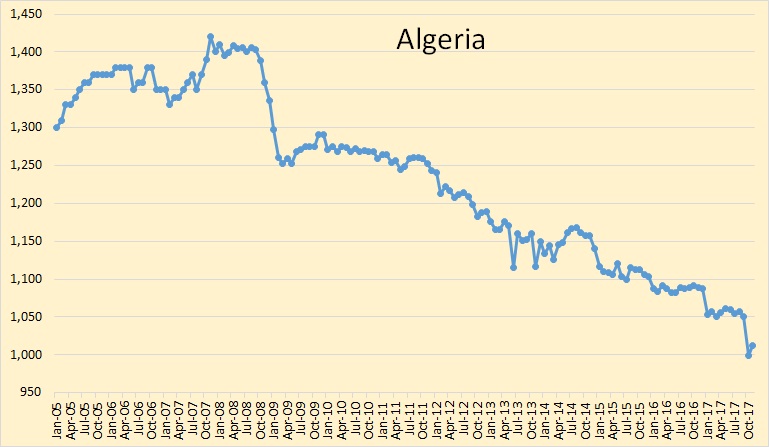
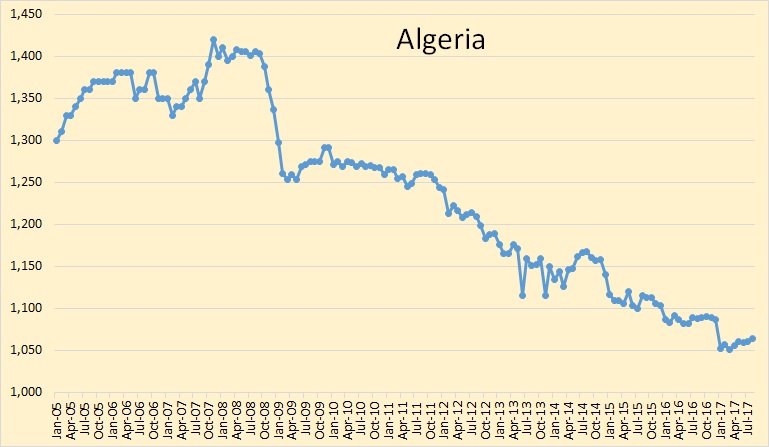
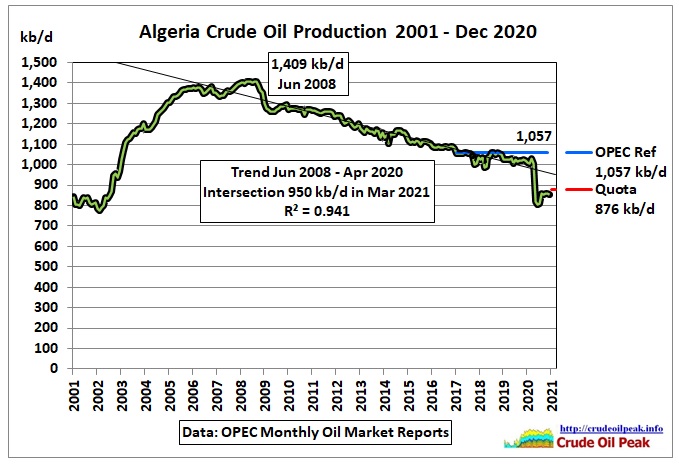
Fig 2: Algeria crude oil production

Algerian crude oil production peaked in June 2008. A trend line since then points to 950 kb/ for March 2021. Production between August and December 2020 was around 860 kb/d, near to the quota. The reference is approximately equivalent to the pre-Covid average since 2016.

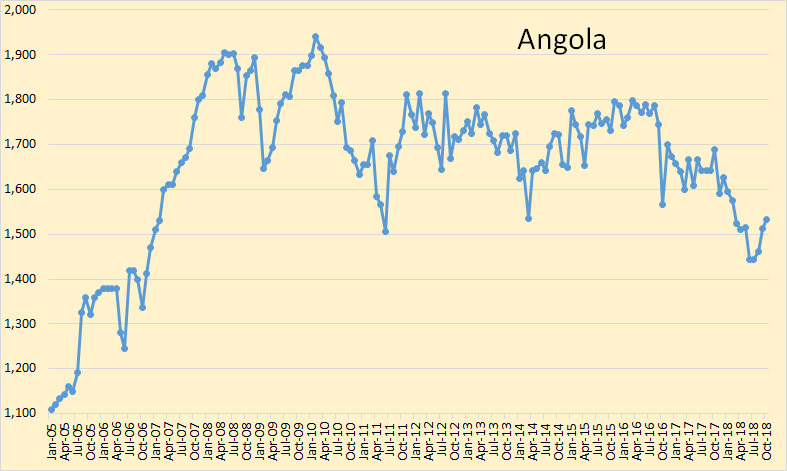
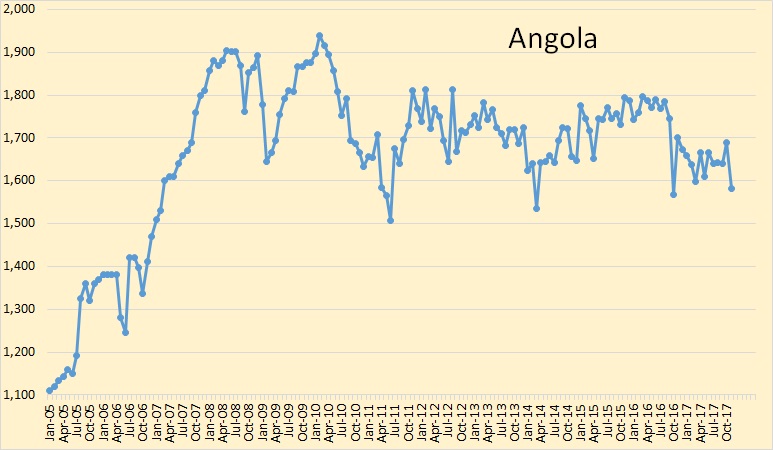
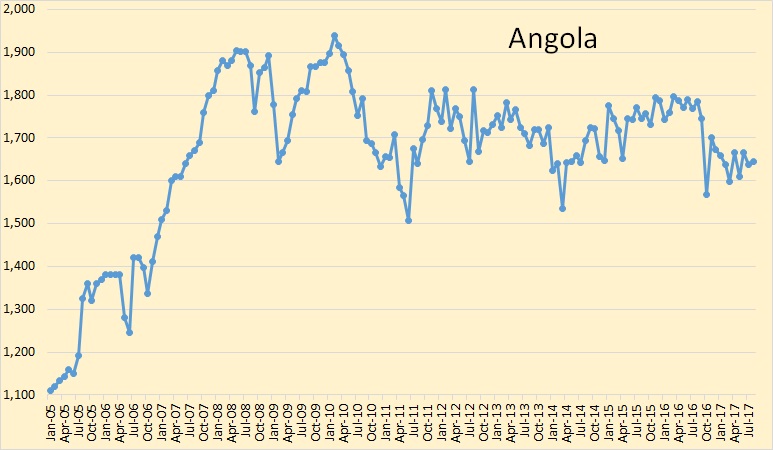
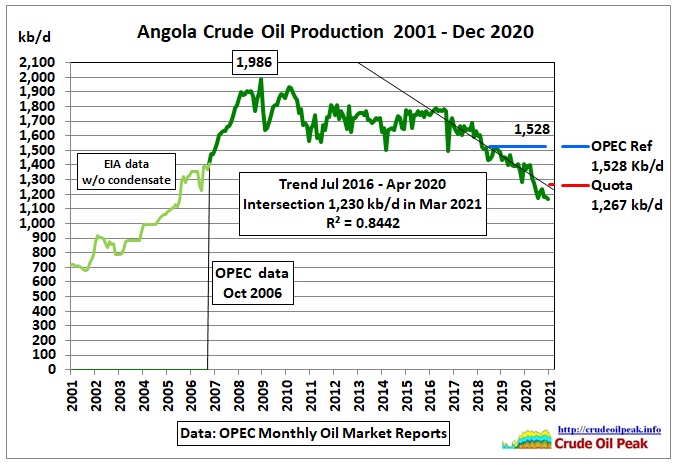
Fig 3: Angola crude oil production (EIA data minus 3.6% condensate)

Angolan crude oil production peaked in December 2008. A trend line starting in July 2016 (when there was a kink in the production trend) points to 1,230 kb/ for March 2021. Production in December 2020 has dropped to around 1,170 kb/d, below the quota. The reference is the production level in 2018.

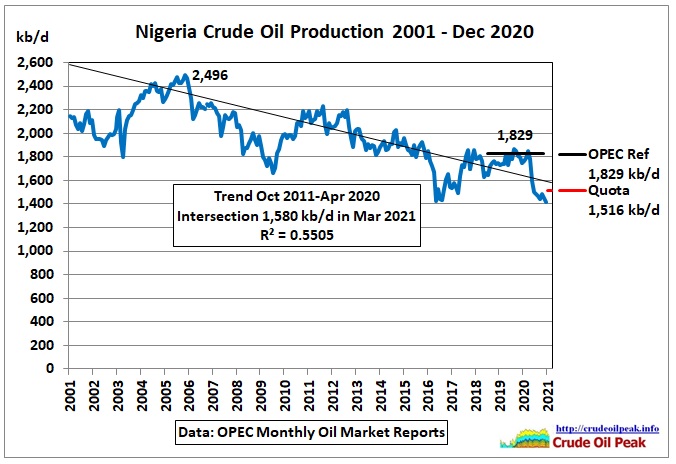
Fig 4: Nigeria crude oil production

…click on the above link to read the rest of the article…

WTI Extends Losses After Production Rebounds To Record

WTI has slid lower overnight following API’s surprise large crude build (and no equity pump) and was unable to hold gains after a bigger than expected gasoline build (and tiny crude draw) along with a production rebound to record highs.

If U.S. crude output rises, it’s likely to see more inventory builds, according to Stewart Glickman, an energy equity analyst at CFRA Research. “The Permian has surprised to the upside over the last couple of months,” he says.

API

  • Crude +6.92mm
  • Cushing +1.76mm
  • Gasoline +3.67mm
  • Distillates -598k

DOE

  • Crude _46k (+3.4mm exp)
  • Cushing +799k
  • Gasoline +3.003mm (+1.0mm exp)
  • Distillates +2k

Tiny crude draw (4th week in a row) but another Cushing build along with a rise in gasoline stocks took the edge off for the bulls.

US Crude production had stalled from its never ending surge higher in recent weeks as the rig count stabailized but rebounded to record highs last week…


WTI hovered around $44.50 into the DOE print and was very modestly lower after….

OPEC October Production Data

OPEC October Production Data

All OPEC data below is from the OPEC Monthly Oil Market Report The data is through October 2018 and is in thousand barrels per day.

OPEC 15 crude oil production was up 127,000 barrels per day in October. that was after September production was revised upward by 13,000 bpd.

OPEC production will likely be up a bit more in November but down considerably in December.

Iran down 156,000 barrels per day in October due to sanctions.

Iraq production has been flat lately. They are obviously pumping every barrel they possibly can.

Kuwaiti crude oil production has been relatively flat for 6.5 years. During that period their oil rig count increased from around 20 to a high of 44. It has recently dropped to 35 however. It should be obvious that they are producing flat out.

…click on the above link to read the rest of the article…

WTI Slumps To $61 Handle After US Crude Production Soars To New Record High

Despite sliding after last night’s API-reported big Crude and Cushing build, WTI has rebounded overnight amid a post-midterms tumbling dollar, but a larger crude build than expected from DOE, combined with a smaller gasoline draw, could lead to WTI “set to test $60 easily,” Tariq Zahir, a commodity fund manager at Tyche Capital Advisors, says

Additionally, Oil rose on the back of headlines that OPEC and its allies were said to plan talks on fresh production cuts next year, responding to recent increases in crude inventories amid surging U.S. supply.

“The Saudis want to stop the price decay,” said Giovanni Staunovo, an analyst at UBS Group AG in Zurich.

“There are many moving variables until the OPEC meeting in December, like Iran and U.S. production growth. But as the Saudis say they aim for market stability, if the data suggests an oversupplied market next year the probability of a cut is high.”

However, as Bloomberg notes, if OPEC, led by Saudi Arabia, does ultimately decide fresh cutbacks are necessary, it will confront a number of challenges. It will need to once again secure the support of rival-turned-partner Russia, which has less need for high oil prices. There’s also the risk of antagonizing the kingdom’s key geopolitical ally, President Trump.

API

  • Crude +7.831mm (+2mm exp)
  • Cushing +3.073mm (+2.1mm exp)
  • Gasoline -1.195mm
  • Distillates -3.638mm

DOE

  • Crude +5.78mm (+2mm exp)
  • Cushing +2.419mm (+2.1mm exp)
  • Gasoline +1.85mm (-1.7mm exp)
  • Distillates -3.465mm

Crude and Cushing inventories rose for the seventh straight week (considerably more than expected) and a surprise gasoline build, sent WTI prices back below pre-API levels from last night and back to a $61 handle…


And as inventories rose, production surged a huge 400k b/d to a new record high…

…click on the above link to read the rest of the article…

What happened to crude oil production after the first peak in 2005?

What happened to crude oil production after the first peak in 2005?

The IEA (in Paris) proudly announced in its latest September 2018 Monthly Oil Market Report that global supplies (of liquids) have reached 100 mb/d in August, an impressive figure. What matters, however, is crude oil production, something the IEA does not show in its monthly reports (only OPEC’s crude oil production is given). We therefore look at data of the US Energy Information Administration EIA which go up to May 2018 at the time of writing this article.

As shown in Fig 1, it is clear that the world’s crude production had a distinctive kink in 2005 which looked like a peak at the time of the financial crisis 2008/09. So what has happened since then? How successful was money printing to rescue the oil production system?

World_crude_production_1994-May2018

In Fig 1, countries are stacked in the order given in Fig 2 where on the left we have countries which have declined since 2005 (red columns group A) and on the right we have countries which increased production after 2005 (green columns group B)

Crude_prod_changes_2005-May_2018

Group A
Countries where average oil production Jan-May 2018 was lower than the average in 2005. At the bottom is Mexico with the highest rate of decline. This group started to peak in 1997, entering a long bumpy production plateau at around 25 mb/d, ending – you guessed it – in 2005. This is down now to 16 mb/d, a decline of 700 kb/d pa (-2.8% pa).Decline-group_1994-May2018

Group B

Countries where average oil production Jan-May 2018 was higher than the average in 2005. At the top of the stack are Iraq and the US, where growth was highest. Group B compensated for the decline in group A and provided for growth above the red dashed line in Fig 1.
The 2018 data have not been seasonally adjusted.

In group B we have a subgroup of countries which peaked after 2005

…click on the above link to read the rest of the article…


Rig Count Drops As U.S. Crude Output Hit 11 Million Bpd

Rig Count Drops As U.S. Crude Output Hit 11 Million Bpd

Oil rig

Baker Hughes reported a decreased number of active oil and gas rigs in the United States on Friday. Oil and gas rigs decreased by 8 rigs, according to the report, with the number of active oil rigs falling by 5 to 858 this week, while the number of gas rigs dipped by 2, hitting 187.

The oil and gas rig count now stands at 1,046—up 96 from this time last year, with the number of oil rigs accounting for 94 of that 96.

Canada gained 14 oil and gas rigs for the week, 11 of which were gas rigs. Canada’s oil and gas rig count is now up just 5 year over year. Oil rigs are up by 24 year over year in Canada, while the number of gas rigs are down by 19.

The biggest loser by basin this week was Granite Wash, which lost 3 rigs. The only basin to gain rigs this week were Cana Woodford (+2), and Utica (+1). The Permian basin, which saw neither an increase or a decrease this week, and Cana Woodford, saw the biggest increases year over year. Cana Woodford now has 12 more rigs than this time last year, while the Permian has 102 rigs more than this time last year.

WTI crude was trading down on Friday afternoon while Brent crude was trading up—widening the WTI discount to Brent. WTI was trading down 0.18% (-$0.12) at $68.12 at 12:34 pm EDT. Brent crude was trading up 0.25% (+$0.18) at $72.76 per barrel.

Both benchmarks are trading significantly down week on week as the market treads carefully after OPEC committed to increasing production in order to more closely stick to its production cut agreement after months of under producing, and despite US production that this week, for the first time, hit a new psychologically important high of 11 million bpd, after hovering at 10.9 million bpd for multiple weeks.

…click on the above link to read the rest of the article…

OPEC November Oil Production

OPEC November Oil Production

The OPEC data below was taken from the December OPEC Monthly Oil Maret Report. All data is through November 2017 unless otherwise noted.

OPEC crude oil production declined by 133,500 barrels per day in November.

Algeria was up slightly in November after that huge decline in October.

Angola was the biggest loser in November, down 108,700 barrels per day.

Ecuador, though holding its own for the last year, appears to be in slow decline.

I have managed to cobble together an estimate of Equatorial Guinea’s historical C+C production. I had the EIA’s production numbers through June 2013. I subtracted 10% for “other liquids”, then merged that with the OPEC MOMR data that started in 2016. However, Equatorial Guinea’s production is not enough to make much difference.

…click on the above link to read the rest of the article…

OPEC August Crude Oil Production

OPEC August Crude Oil Production

All data below is based on the latest OPEC Monthly Oil Market Report.

All data is through August 2017 and is in thousand barrels per day.

The above chart does not include the 14th member of OPEC that was just added, Equatorial Guinea. I do not have historical data for Equatorial Guinea so I may not add them at all.  OPEC production has held steady for the past three months. Their production was down 79,000 barrels per day in August but that is not a big drop when production is over 32.5 million barrels per day.

August production was down 79,100 barrels per day.

Not much is happening in Algeria. They peaked almost 10 years ago and have been in slow decline ever since.

Angola peaked in 2010 but have been holding pretty steady since.

Ecuador peaked in 2015.

Gabon’s oil production dropped 32,300 bpd in August.

Iran has obviously reached peak post sanctions production. Like every other OPEC member, they are producing every barrel they possibly can.

…click on the above link to read the rest of the article…

US Crude Production Stalls As Oil Rig Count Rolls Over

US Crude Production Stalls As Oil Rig Count Rolls Over

Amid the chaos and turmoil caused by Harvey, today’s rig count data is likely to change things as much as a fart in a hurricane. US crude production in the Lower 48 actually fell last week, syncing with the stabilization in the lagged oil rig count.

The US Oil Rig count held to two-month lows last week, unchanged at 759

US Crude production in the Lower 48 dropped last week following a stabilization in rig counts (but rose 2k overall thanks to a pick up in Alaska)…

Notably RBOB prices are down today (and WTI) as  John Kilduff, a partner at Again Capital, notes “The government is actually reacting positively trying to address and do what they can,… There are some signs of life in several of the refineries already and the 1 million-barrel tapping of the SPR is also helping to ease anxieties over the storm”

Another Example of a Seneca Cliff

Another Example of a Seneca Cliff

The results of a Google Trend search for “Friendster”, an old social network. It is a nearly perfect “Seneca Shape.” Ruin is rapid, indeed!
“Friendster” was a social network that, in many ways, pre-dated Facebook. Friendster collapsed rapidly, starting in around 2009, providing us with an impressive example of a “Seneca Shape“, a curve where decline is much faster than growth, or, as Seneca the philosopher said long ago, “ruin is rapid”.
The demise of Friendster has been studied in at least two recent papers. One by Garcia et al, (2013) “Social Resilience of online communities” and another by Yu et al., (2016) titled “System crash as dynamics of complex networks” These papers interpret the collapse in terms of the dynamic evolution of a network, whereas, earlier on, I had proposed a model where this specific shape could be derived from system dynamics. Basically, there must be more than one way to skin a platypus: both the studies cited are based on collective feedback effects, which is the crucial factor that makes collapses occur. So, network theory is more detailed, system dynamics one is more aggregated, but we are describing the same phenomenon, although from different viewpoints.
In both cases, anyway, we find that ruin is rapid. As long as it occurs to an obsolete social service, it is not a big problem. But if it were to occur to something massive and vital for civilization, such as the oil industry, then we could see something like this…. ouch…….

Oil Plunges to $32-Handle, Chinese Stocks Crash and are Halted, Whiff of Mayhem Breaks out

Oil Plunges to $32-Handle, Chinese Stocks Crash and are Halted, Whiff of Mayhem Breaks out

After having been through the greatest two-year loss on record, the price of oil plunged 9.6% on Wednesday and in evening trading. As I’m writing this, WTI hit $32.62 a barrel, a new low since the desperate depth of the Financial Crisis, when it very briefly kissed $30.28 a barrel on December 23, 2008, before bouncing off sharply.

This time, it’s serious. Brent, the global benchmark, has crashed to $32.75, an 11-year low. This isn’t a quick scare that happens during a Financial Crisis. It’s the result of a persistently growing glut.

Since the oil price plunge began in July 2014, every rally, every “opportunity of a lifetime” to buy oil “for cents on the dollar” has turned out to be a falling knife.

This is what the three trading-day, 15% crash of WTI looks like:

US-crude-WTI-price-2016-01-06

The contagion of the oil price plunge has been drifting into other sectors of the US economy, housing and office space in Houston, the state budget in Alaska, jobs, manufacturing…. Investments have gone up in smoke. Loans have gone bad. Defaults, restructurings, and bankruptcies are now a routine occurrence. Banks are looking over their shoulder. PE firms are licking their wounds from their mega-bets on fracking made in prior years, and they’re licking their new wounds from having tried to catch many falling knives.

This isn’t going to be an easy bust to get through. It’s a US problem. And it’s a global problem.

In the US, crude oil production started declining on a monthly basis in mid-2015, according to EIA estimates. But despite those monthly declines, production averaged 9.3 million barrels per day in 2015, the highest rate since 1972, and a 7% increase over 2014.

…click on the above link to read the rest of the article…

The Case For Peak Oil

The Case For Peak Oil

JODI World C+C

World crude oil production has taken off during the last two years due primarily to US shale oil production and higher output from OPEC. However very high oil prices has enabled many other countries to increase drilling rigs and production.

JODI Non-OPEC

Low oil prices are having an effect on Non-OPEC oil production though not nearly as much as a lot of people thought they would, and not nearly as soon either.

Big 5

Five nations, Saudi Arabia, Iraq, Russia, USA and Canada, have been responsible for way more than 100 percent of the increase in oil production in the last decade.

World Less Big Five

The world less the five nations charted above is down 5,000,000 barrels per day since 2005. This decline is despite the fact that oil prices, during much of that time, has been above $100 a barrel.

A look at the Non-OPEC segment of this group.

Russia, USA and Canada

…click on the above link to read the rest of the article…

OPEC Crude Little Change

OPEC Crude Little Change

The OPEC Monthly Oil Market Report is just out  with the crude only production numbers for the 12 OPEC countries. The data below is in thousand barrels per day and the last data point is September 2015.

OPEC 12

OPEC 12 crude only production was up 109,000 barrels per day in September but that was after the August production numbers were revised down by 82,000 bpd. OPEC crude only production now stands at 31,571,000 pbd. That is just 12,000 bpd above June production but still 100,000 bpd below their peak in July of 2008.

Saudi Arabia

Saudi Arabia was down 48,000 bpd in September to 10,225,000 bpd. That is 174,000 bpd below their latest peak in June.

Iraq

The big gainer in September was Iraq, up 80,100 bpd in September. That is still 5,000 bpd below their latest peak in July.

UAE

The UAE hit a new high in September, up 24,300 bpd in September to 2,902,000 bpd.

…click on the above link to read the rest of the article…

US Shale Declining and OPEC Still Climbing

US Shale Declining and OPEC Still Climbing

First the Drilling Productivity Report. Of course most of the Drilling Productivity Report is projection, not history. And that projection goes through September 2015.

Bakken

The EIA has the Bakken peaking in December and declining 107 thousand barrels per day since that point. A secondary peak was reached in April and declining steadily since then.

Eagle Ford

The EIA has Eagle Ford peaking in March and declining 226 thousand barrels per day since that point.

Niobrara

The EIA has Niobrara peaking in March, almost flat for one month then declining sharply after that for a total decline of 75 thousand barrels per day after that.

The Permian was the only major shale area with no decline so far. The EIA has the Permian up 29 thousand barrels per day since the rest of the field, combined, peaked in April.

Total Shale

The EIA has total shale peaking in April at 5,434000 bpd and declining by 360 thousand barrels per day by September to 5,074000 bpd. 360,000 barrels per day is quite a decline by September.


…click on the above link to read the rest of the article…

Olduvai IV: Courage
Click on image to read excerpts

Olduvai II: Exodus
Click on image to purchase

Click on image to purchase @ FriesenPress