Home » Posts tagged 'central bank liquidity'

Tag Archives: central bank liquidity

Olduvai
Click on image to purchase

Olduvai III: Catacylsm
Click on image to purchase

Post categories

Post Archives by Category

Collapse In Global M1 Signals A Worldwide Recession Has Arrived

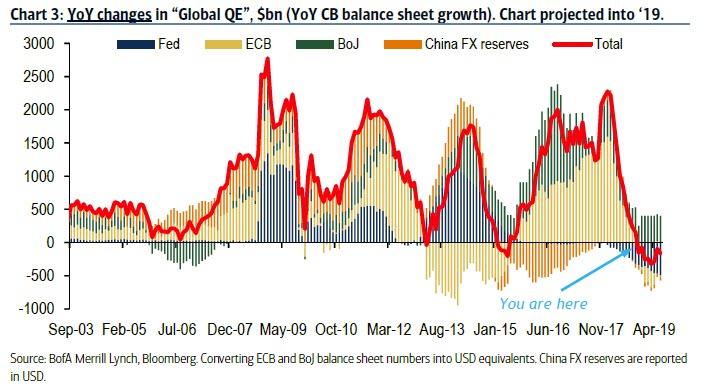
By now everyone has seen some iteration of this chart showing that the annual change in central bank liquidity is now negative.

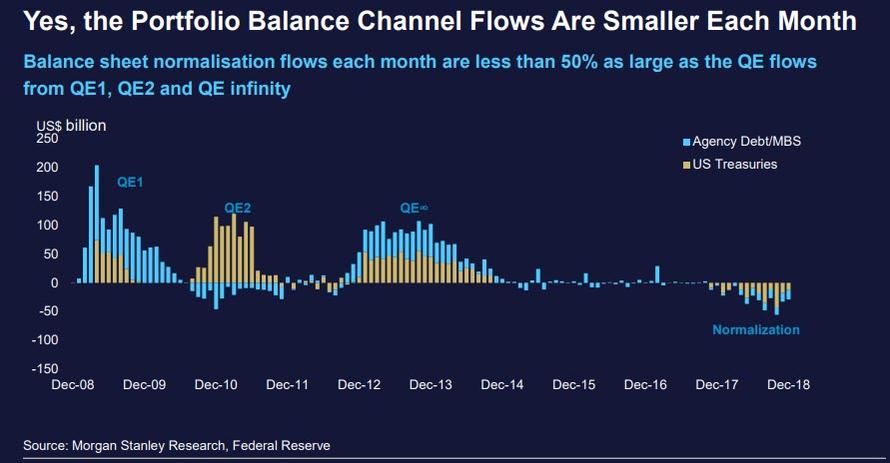
Another way to visualize just the Fed’s balance sheet contraction is courtesy of this chart from Morgan Stanley which shows specifically which assets – Treasurys and MBS – are declining on a monthly basis.

When it comes to markets – where the events of December were a vivid reminder that just as QE blew the world’s biggest asset bubble, so QT will deflate it  – there is a simple explanation of this negative effect of QT on Markets – in terms of both flow and stock – and it is laid out as follows from Morgan Stanley:

  • THE STOCK EFFECT (SE) – GROUP 1
    • The SE relates to the long-term impact on Group 1 asset prices from the overall change to the central bank’s balance sheet and its impact on the stock of available Group 1 assets.
  • THE FLOW EFFECT (FE) – GROUP 1
    • The FE relates to the short-term impact on Group 1 asset prices from each flow that changes the size of the central bank’s balance sheet.
  • THE PORTFOLIO BALANCE CHANNEL EFFECT (PBCE) – GROUP 1 AND 2
    • The PBCE impacts both Group 1 and Group 2 assets and incorporates the pricing elements of both the stock effect and the flow effect.

But while the immediate effect of the expansion and shrinkage of the Fed’s balance sheet on various asset classes is rather intuitive – if not to Fed presidents of, course – a more pressing question is how will the upcoming liquidity shrinkage affect the global economy.

Unfortunately, the answer appears to be ominous.

…click on the above link to read the rest of the article…

Chinese Shadow Bank Lending Unexpectedly Crashes, Sending Total Credit Creation To Two-Year Low

According to most flow-tracking economists (and not their clueless, conventionally-trained peers) when one strips away  the noise, there are just two things that matter for the global economy and asset prices: central bank liquidity injections, and Chinese credit creation. This is shown in the Citi charts below.

And if indeed it is just these two variables that matter, then the world is set for a turbulent phase because while global central banks liquidity is set to reverse a decade of expansion, and enter contraction some time in Q3 as the great “liquidity supernova” begins draining liquidity for the first time since the financial crisis…

… the latest Chinese credit creation data released on Tuesday, added significantly to the risk of a “sudden global economic stop” after the PBOC reported that in May, China’s broadest monetary aggregate, the Total Social Financing, just posted it smallest monthly increase since July 2016, confirming that Beijing’s shadow deleveraging campaign is accelerating and gaining even more traction, even if the threat of a global deflationary spillover is rising by the day.

A quick look at the numbers reveals that there was not much of a surprise in traditional new RMB loans, which rose RMB1150bn in May, slightly below consensus RMB1200bn, growing 12.6% yoy in May.

However, it was the sharp, unexpected plunge in Total social financing growth, which attracted attention and which rose only RMB 760.8bn in May, almost half the consensus print of RMB1300bn, and sharply below April’s RMB1560bn increase.

Of the main TSF components, the drop in shadow bank lending was particularly sharp: this has been the area where Beijing has been most focused in their deleveraging efforts as it’s the most opaque and riskiest segment of credit. And, as the chart below show, the aggregate off balance-sheet financing posted its biggest monthly drop on record in May.

…click on the above link to read the rest of the article…

“This Is Most Worrying”: In One Year, Central Bank Liquidity Will Collapse From $2 Trillion To Zero

 Is it complacency, or simply trader paralysis?

A question we first asked three months ago is getting a second wind this morning, when in a report by Deutsche Bank’s Alan Ruskin, the macro strategist points out that “the new 2017 Nobel laureate for Economics is not the only one at a loss to explain low stock market volatility, and thinks investors are in ‘freeze mode’ in the midst of global uncertainties.”

According to Ruskin, however, it’s all about to change.

But why? And what is “the most likely causes of a shift to ‘flight mode’ and a rise in volatility? Here’s one possibility: by the end of next year, the combined expansion of all the major Central Bank balance sheets will have collapsed from a 12 month growth rate of $2 trillion per annum to zero.”

But before we get to the inevitable next step, here’s Deutsche Bank on how we got to the current state of paralytic complacency, or whatever one wants to call it.

To be sure, the wire headlines were catchy: “Nobel prize winner Thaler admits to not understanding the low volatility in the stock market.” The behavioural economist went on to note that investors appeared to be in “freeze” rather than “flight mode”. There are, according to Ruskin, at least three broad explanations for the current low volatility world, and why investor “freeze” appears to be favoured over “flight”, including:

  1. On the behavioural economics side there is the suggestion that many equity investors have entered at good levels and are capable of withstanding fairly sizable negative shocks; and, investors can’t trade or at least time, hypothetical apocalyptic events like a N.Korea accident;

…click on the above link to read the rest of the article…

Olduvai IV: Courage
Click on image to read excerpts

Olduvai II: Exodus
Click on image to purchase

Click on image to purchase @ FriesenPress