Home » Posts tagged 'arthur berman'

Tag Archives: arthur berman

Olduvai
Click on image to purchase

Olduvai III: Catacylsm
Click on image to purchase

Post categories

Post Archives by Category

Arthur Berman: “The Devil is in the Diesel”

Arthur Berman: “The Devil is in the Diesel”

U.S. Oil Dominance Is Coming To An End

U.S. Oil Dominance Is Coming To An End

  • U.S.’ energy dominance agenda is dead as the country’s shale industry is looking at a steep production decline.
  • The U.S. tight oil or shale rig count has fallen 69% this year from 539 in mid-March to 165 last week.
  • U.S. oil import dependence is set to grow in the next couple of years.

U.S. energy dominance is over. Output is probably going to drop by 50% over the next year and nothing can be done about it. It has nothing to do with the lack of shale profitability or other silly memes cited by people who don’t understand energy.

It’s because of low rig count.

The U.S. tight oil or shale rig count has fallen 69% this year from 539 in mid-March to 165 last week. Tight oil production will decline 50% by this time next year. As a result, U.S. oil production will fall from to less than 8 mmb/d by mid-2021.

What if rig count increases between now and then? It won’t make any difference because of the lag between contracting a drilling rig and first production.

The party is over for shale and U.S. energy dominance.

Energy Dominance is Over

Tight oil is the foundation of U.S. energy dominance. The U.S. has always been a major oil producer but it moved into the top tier of oil super powers as tight oil boosted output from about 5 to more than 12 mmb/d between 2008 and 2019 (Figure 1).

Conventional production has been declining since 1970. It fell from almost 10 mmb/d in 1970 to 5 mmb/d in 2008.

Figure 1. Tight oil is the foundation for U.S. Energy Dominance.

Conventional production has been in decline since 1970. Tight oil boosted U.S. production to more than 12 mmb/d in 2019.

Source: EIA and Labyrinth Consulting Services, Inc.

…click on the above link to read the rest of the article…

Why Oil Prices Could Still Go Lower

Why Oil Prices Could Still Go Lower

Oil

Crude markets had a panic attack in August and September that sent prices soaring. Sanity is now returning. Prices have fallen but are likely to move even lower over the next few months.

The panic attack was caused largely by Trump’s August 7 announcement that sanctions would be re-imposed on Iran. Anxiety about the effect on oil supply and prices was reasonable but the reaction was hysterical.

From August 15 to October 1, Brent December futures spreads increased $3.01 (175 percent) from $1.72 to $4.73. Brent prices increased $15.53 (22 percent) from $70.76 to $86.29 (Figure 1).

(Click to enlarge)

Figure 1. Brent Dec spreads collapsed from $4.73 to $1.52 since Oct 1 & are now less than when price rally began after announcement to re-impose Iran sanctions in mid-August. Front-month Brent down from $86.29 to $76.17 but still higher than $70.76 Aug 15 price. Source: Barchart and Labyrinth Consulting Services, Inc.

Then spreads and prices collapsed. By October 24, spreads had fallen from $4.73 to $1.52, less than when the price rally began. Front-month Brent price decreased from $86.29 to $76.17. Prices and spreads recovered slightly on October 24 closing at $76.89 and $1.76, respectively.

It seems unlikely that the correction is over. The timing depends on how long it takes for markets to fully recover from what Vitol’s Ian Taylor calls the supply fear factor. After 6 weeks of fear, markets must adjust to the reality that the “oil market is adequately supplied for now.”

Clearly markets are concerned about more than just Iran. Falling or uncertain output from the problem children Venezuela, Libya and Nigeria, and take-away constraints from the Permian basin are critical.

Iran, however, is different because it is a completely artificial supply crisis. It was a choice made by Donald Trump and his advisors. Markets are used to the uncertainty of its problem children but not to the apparent certainty of an executive decision. The reaction was consistent with the cause—certain and linear.

…click on the above link to read the rest of the article…

Are Natural Gas Prices Set To Spike?

Are Natural Gas Prices Set To Spike?

gas well

Natural gas storage is at record low levels but prices are falling going into winter heating season. Markets seem to be betting that wellhead supply will be sufficient to cover demand this winter. That may be but at what gas prices? This is a game of natural gas risky business.

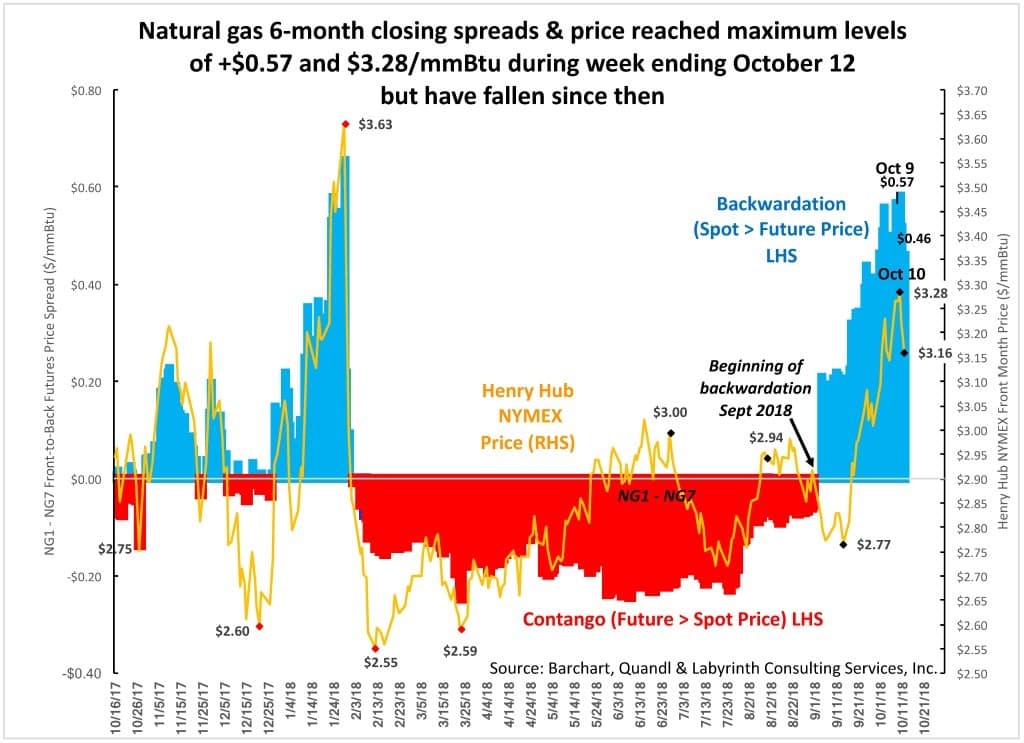
Natural gas 6-month calendar spreads moved in backwardation in early September and climbed to +$0.57 on October 9. Henry Hub spot prices reached $3.28/mmBtu but both spreads and price have fallen since then (Figure 1).

(Click to enlarge)

Figure 1. Natural gas 6-month closing spreads & price reached maximum levels of +$0.57 and $3.28/mmBtu during week ending October 12 but have fallen since. Source: Barchart, Quandl and Labyrinth Consulting Services, Inc.

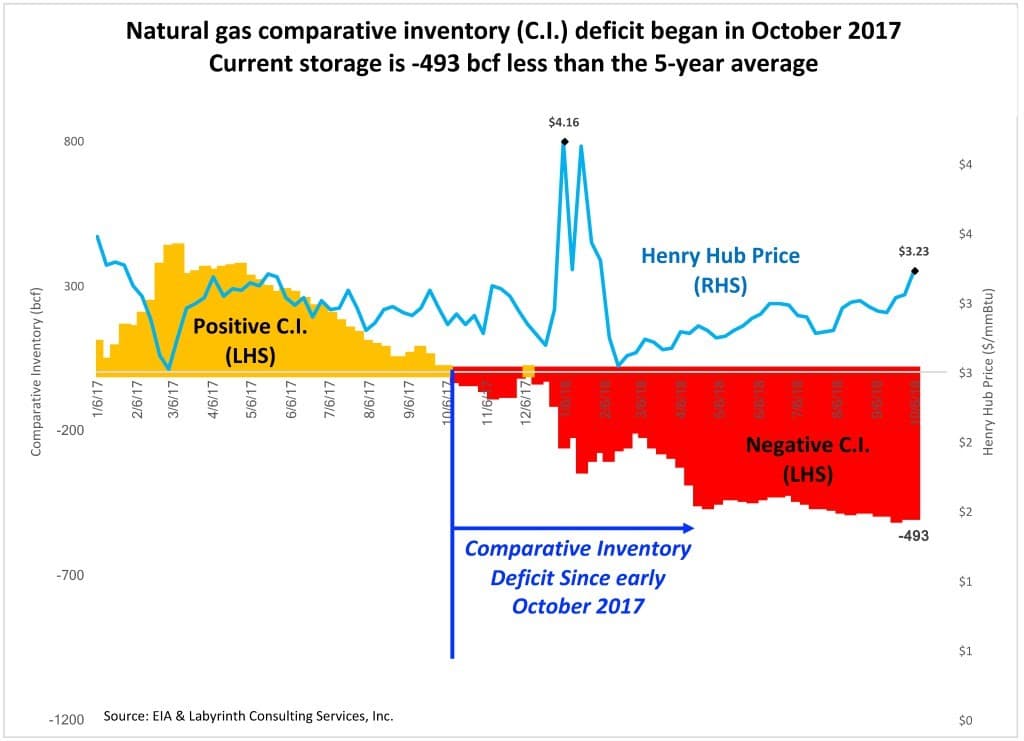
The upward movement of prices and spreads were a long time coming considering the massive storage deficit that began in October 2017 (Figure 2). Current storage is -493 bcf less than the 5-year average and we are only a few weeks away from the beginning of the 2017-2018 winter heating season. Storage is an almost unbelievable -693 bcf less than during the same week in 2017 and yet, markets are seemingly unfazed!

(Click to enlarge)

Figure 2. Natural gas comparative inventory (C.I.) deficit began in October 2017. Current storage is -493 bcf less than the 5-year average. Source: EIA and Labyrinth Consulting Services, Inc.

What, me worry?

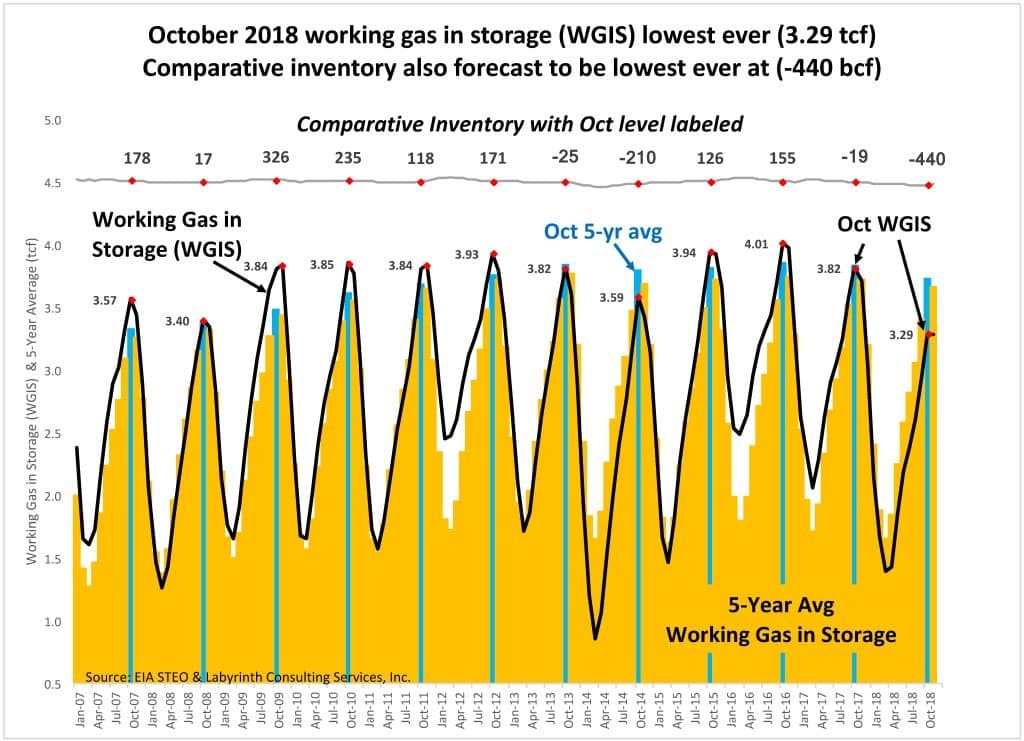
This has led to the lowest end-of-storage (EOS) level in history. October working-gas-in-storage (WGIS) is only 3.29 tcf and a projected monthly average C.I. of -400 bcf is also the lowest in history for October (Figure 3).

(Click to enlarge)

Figure 3. October 2018 working gas in storage (WGIS) lowest ever (3.29 tcf). Comparative inventory also forecast to be lowest ever at (-440 bcf). Source: EIA STEO and Labyrinth Consulting Services, Inc.

…click on the above link to read the rest of the article…

Skeptic Geologist Warns: Permian’s Best Years Are Behind Us

Skeptic Geologist Warns: Permian’s Best Years Are Behind Us

Permian

Geologist Arthur Berman, who has been skeptical about the shale boom, warned on Thursday that the Permian’s best years are gone and that the most productive U.S. shale play has just seven years of proven oil reserves left.

“The best years are behind us,” Bloomberg quoted Berman as saying at the Texas Energy Council’s annual gathering in Dallas.

The Eagle Ford is not looking good, either, according to Berman, who is now working as an industry consultant, and whose pessimistic outlook is based on analyses of data about reserves and production from more than a dozen prominent U.S. shale companies.

“The growth is done,” he said at the gathering.

Those who think that the U.S. shale production could add significant crude oil supply to the global market are in for a disappointment, according to Berman.

“The reserves are respectable but they ain’t great and ain’t going to save the world,” Bloomberg quoted Berman as saying.

Yet, Berman has not sold the EOG Resources stock that he has inherited from his father “because they’re a pretty good company.”

The short-term drilling productivity outlook by the EIA estimates that the Permian’s oil production hit 3.110 million bpd in April, and will rise by 73,000 bpd to 3.183 million bpd in May.

Earlier this week, the EIA raised its forecast for total U.S. production this year and next. In the latest Short-Term Energy Outlook (STEO), the EIA said that it expects U.S. crude oil production to average 10.7 million bpd in 2018, up from 9.4 million bpd in 2017, and to average 11.9 million bpd in 2019, which is 400,000 bpd higher than forecast in the April STEO. In the current outlook, the EIA forecasts U.S. crude oil production will end 2019 at more than 12 million bpd.

…click on the above link to read the rest of the article…

Why Investors Should Beware Of The Bakken

Why Investors Should Beware Of The Bakken

Bakken oil rig

It’s the beginning of the end for the Bakken Shale play.

The decline in Bakken oil production that started in January 2015 is probably not reversible. New well performance has deteriorated, gas-oil ratios have increased and water cuts are rising. Much of the reservoir energy from gas expansion is depleted and decline rates should accelerate. More drilling may increase daily output for awhile but won’t resolve the underlying problem of poorer well performance and declining per-well reserves.

December 2016 production fell 92,000 barrels per day (b/d)–a whopping 9 percent single-month drop (Figure 1). Over the past two years, output has fallen 285,000 b/d (23 percent). This was despite an increase in the number of producing wells that reached an all-time high of 13,520 in November. That number fell by 183 wells in December.

(Click to enlarge)

Figure 1. Bakken Production Declined 92,000 bopd (9 percent) in December. Source: North Dakota Department of Mineral Resources and Labyrinth Consulting Services, Inc.

Well Performance Is Declining

Well performance was evaluated for eight operators using standard rate vs. time decline-curve analysis methods. These operators account for 65 percent of the production and also 65 percent of producing wells in the Bakken play (Table 1).

(Click to enlarge)

Table 1. Operators, Cumulative Oil Production, Total Producing Wells and 2012-2015 Wells Used for Decline-Curve Analysis (DCA) in this study. Source: Drilling Info and Labyrinth Consulting Services, Inc.

Estimated ultimate recovery (EUR) decreased over time for most operators and 2015 EUR was lower for all operators than in any previous year (Figure 2). This suggests that well performance has deteriorated despite improvements in technology and efficiency.

(Click to enlarge)

Figure 2. Bakken EUR (Estimated Ultimate Recovery) Has Generally Decreased Over Time. Source: Drilling Info and Labyrinth Consulting Services, Inc.

Figure 3 shows Bakken EUR and the commercial core area in green. The map on the left shows all wells with 12-months of production history and the map on the right, all wells with first production in 2015 and 2016.


…click on the above link to read the rest of the article…

Why Oil Prices May Not Move Higher

Why Oil Prices May Not Move Higher

It is similar to the false March-June 2015 rally. In both cases, prices increased largely because of sentiment. As in the earlier rally, current storage volumes are too large and demand is too weak to sustain higher prices for long.

WTI prices have increased 47 percent over the past 20 days from $26.21 in mid-February to $38.50 last week (Figure 1).

Figure 1. NYMEX WTI futures prices & OVX oil-price volatility, 2015-2016. Source: EIA, CBOE, Bloomberg and Labyrinth Consulting Services, Inc. (click image to enlarge).

A year ago, WTI rose 41 percent in 35 days from $43 to almost $61 per barrel. Like today, analysts then believed that a bottom had been reached. Prices stayed around $60 for 37 days before falling to a new bottom of $38 per barrel in late August. Much lower bottoms would be found after that all the way down to almost $26 per barrel at the beginning of the present rally.

Related: Oil Fundamentals Could Cause Oil Prices To Fall, Fast.

Higher prices were unsustainable a year ago partly because crude oil inventories were more than 100 mmb (million barrels) above the 5-year average (Figure 2). Current inventory levels are 50 mmb higher than during the false rally of 2015 and are they still increasing.

Figure 2. U.S. crude oil stocks. Source: EIA and Labyrinth Consulting Services, Inc. (click image to enlarge).

International stocks reflect a similar picture. OECD inventories are at 3.1 billion barrels of liquids, 431 mmb more than the 2010-2014 average and 359 mmb above the 2015 level. Approximately one-third of OECD stocks are U.S. (1.35 billion barrels of liquids).

…click on the above link to read the rest of the article…

Oil Fundamentals Could Cause Oil Prices To Fall, Fast.

Oil Fundamentals Could Cause Oil Prices To Fall, Fast.

Prices should fall to around $30 once the empty nature of an OPEC-plus-Russia production freeze is understood. A return to the grim reality of over-supply and the weakness of the world economy could push prices well into the $20s.

A Production Freeze Will Not Reduce The Supply Surplus

An OPEC-plus-Russia production cut would be a great step toward re-establishing oil-market balance. I believe that will happen later in 2016 but is not on the table today.

In late February, Saudi oil minister Ali Al-Naimi stated categorically, “There is no sense in wasting our time in seeking production cuts. That will not happen.”

Instead, Russia and Saudi Arabia have apparently agreed to a production freeze. This is meaningless theater but it helped lift oil prices 37 percent from just more than $26 in mid-February to almost $36 per barrel last week. That is a lot of added revenue for Saudi Arabia and Russia but it will do nothing to balance the over-supplied world oil market.

The problem is that neither Saudi Arabia nor Russia has greatly increased production since the oil-price collapse began in 2014 (Figure 1). A freeze by those countries, therefore, will only ensure that the supply surplus will not get worse because of them. It is, moreover, doubtful that Saudi Arabia or Russia have the spare capacity to increase production much beyond present levels making the proposal of a freeze cynical rather than helpful.

(Click to enlarge)

Figure 1. Incremental liquids production since January 2014 by the United States plus Canada, Iraq, Saudi Arabia and Russia. Source: EIA & Labyrinth Consulting Services, Inc. (click image to enlarge)

…click on the above link to read the rest of the article…

OPEC Will Not Blink First

OPEC Will Not Blink First

An OPEC production cut is unlikely until U.S. production declines by about another million barrels per day (mmbpd). OPEC won’t cut because it would accomplish nothing beyond a short-term increase in price. Carefully placed comments by OPEC and Russian oil ministers about the possibility of production cuts achieve almost the same price increase as an actual cut.

Bad News About The Oil Over-Supply from IEA and EIA

The International Energy Agency (IEA) and U.S. Energy Information Administration (EIA) shook the markets yesterday with news that the world’s over-supply of oil has gotten worse rather than better in recent months. IEA data shows that the global liquids over-supply increased in the 4th quarter of 2015 to 2.24 million barrels per day (mmbpd) from 1.62 mmbpd in the 3rd quarter (Figure 1).

Figure 1. IEA world liquids market balance (supply minus demand). Source: IEA and Labyrinth Consulting Services, Inc.

(click image to enlarge)

Supply increased 70,000 bpd and demand decreased 550,000 bpd for a net increase in over-supply of 620,000 bpd. The sharp decline in demand is perhaps the most troubling aspect of IEA’s report. The agency forecasts tepid demand growth of only 1.17 mmbpd in 2016 compared with 1.61 mmbpd in 2015. The weak global economy is the culprit.

EIA’s monthly data showed the same trend. Over-supply in January increased to 2.01 mmbpd from 1.35 mmbpd in December, a 650,000 bpd net change (Figure 2). Supply fell by 370,000 bpd but consumption dropped by a stunning 1.02 mmbpd.

Figure 2. EIA world liquids market balance (supply minus consumption). Source: EIA and Labyrinth Consulting Services, Inc.

(Click image to enlarge)

The January 2016 Oil Price Head-Fake

Recent comments about a possible OPEC cut were largely responsible for the late January “head-fake” increase in oil prices (Figure 3). WTI futures increased 27 percent from $26.55 to $33.62 per barrel between January 20 and 29.

..click on the above link to read the rest of the article…
Oil Markets Are Balancing Faster Than IEA Would Have Us Believe

Oil Markets Are Balancing Faster Than IEA Would Have Us Believe

Fundamentals point toward market balance but pessimism is dragging oil prices down. IEA has apparently succumbed to this negativity but their data suggests that things are getting better, not worse.

In a business-as-usual world in which nothing unusual happens, the world will be close to market balance some time in 2016. If anything unusual happens, all bets are off and oil prices could rebound much faster than anyone imagines.

A Year of Extreme Price Cycles

NYMEX WTI futures prices have fallen 34 percent since October 2015, and are below $30.00 per barrel for the first time since 2003. Prices have gone through four cycles of 30-40 percent increases and decreases over the past year (Figure 1).

Figure 1. NYMEX WTI futures prices and price cycles in 2015. Source: EIA, Bloomberg & Labyrinth Consulting Services, Inc.

(Click image to enlarge)

The two price rallies from March-to-June and from August-to-October were based largely on hope and the price decline from June-to-August represented a return to the reality of supply and demand fundamentals.

The most recent price decline that began in October is a bit different. Here, confirmation bias has replaced critical thinking about the oil market. The ruling paradigm is that prices are likely to stay low for years or even for decades and evidence is easily found that favors and confirms this bias. I believe that this paradigm is incorrect.

Despite troubling signals of structural weakness in the global economy, data suggests that the oil market is stumbling toward balance. Although I have said that prices must go lower in order to flush out the zombie producers, IEA’s statement in the January Oil Market Report that the world could drown in over-supply is based more on sentiment and pessimism than on data.


…click on the above link to read the rest of the article…
As Rig Count Plunges, Has U.S. Oil Reached Its Capitulation Point?

As Rig Count Plunges, Has U.S. Oil Reached Its Capitulation Point?

The big drop in rig count for the week that ended last Friday points to capitulation by U.S. shale drillers.

The total land rig count fell by 37 rigs and the horizontal rig count fell by 30 rigs (Figure 1).

Figure 1. U.S. shale play horizontal rig count. Source: Baker Hughes & Labyrinth Consulting Services, Inc.

(Click image to enlarge)

That’s the biggest drop since March 2015 and it suggests that drillers are out of cash. Until now, companies have been rationing dwindling funds from secondary share and bond offerings as well as equity capital.

Related: Rig Count: Capitulation?

But those sources largely dried up after October when WTI futures prices began their fall from nearly $50 per barrel to their present value of $32.50 per barrel. Investors have finally stopped believing the claims by Daniel Yergin and Andy Hall that prices would rebound, and started paying attention to the reality that I have been pointing out since May 2015.

If companies must finally pay for new wells out of cash flow, we might expect drilling to plummet in 2016 because tight oil companies have been spending other people’s money to pay for half their drilling as late as the third quarter of this year (Figure 2).

Figure 2. Third quarter 2015 tight oil-weighted exploration and production company negative cash flow. Source: Google Finance & Labyrinth Consulting Services, Inc.

(Click image to enlarge)


…click on the above link to read the rest of the article…
Arthur Berman: Why The Price Of Oil Must Rise

Arthur Berman: Why The Price Of Oil Must Rise

Why a supply shock is inevitable

Geologist Arthur Berman explains why today’s low oil prices are not here to stay, something investors and consumers alike should be very aware of. The crazy-low prices we’re currently experiencing are due to an oversupply created by geopolitics and (historic) easy credit, not by sustainable economics.

And when the worm turns, we are more likely than not to experience a sudden supply shortfall, jolting prices viciously higher. This will be a situation not soon resolved, as the lag time for new production to come on-line will be much longer than the world wants:

The same things that always drive prices in the end it’s always about fundamentals. The markets are peculiar and they change every day. But the fundamentals of supply and demand at some point markets come back to those and have to adjust accordingly. Not on a daily basis, maybe not even on a monthly basis. But eventually they get it right. So this oil price collapse is really straight forward as far as I can tell, and it has to do with cheap stupid money because of artificially low interest rates that resulted in over-investment in oil — as well as lots of other commodities that are not in my area of specialty, but that’s what I see. And over-investment led to over-production and eventually over-production swamped the market with too much supply and the price has to go down until we work our way through the excess supply.

Now the wrinkle in all of this is that because the supply excess/surplus was generated by debt and a lot of correlative instruments, the problem is that the companies and the countries that are doing all this over-production need to keep generating cash flow so they can service the debt, which means they have to continue producing pretty much at the highest levels they possibly can which doesn’t really allow very much room for reducing the surplus.

…click on the above link to read the rest of the article…

Rig Count: Capitulation?

Rig Count: Capitulation?

After last week’s moderate drop in rig count, the amount of horizontal oil rigs seems to implode this week.

The U.S. land rig count was down 37 this week and the land horizontal rig count was down 30.

Is this capitulation? Hard to say but it’s the biggest drop since March 2015. And, the Fayetteville Shale play officially bit the dust this week with zero rigs for the first time since the play began in 2005.

The tight oil horizontal rig count was down by 20 and the key Bakken-Eagle Ford-Permian HRZ rig count was down by 14. The Bakken lost 3 rigs, the Eagle Ford, 4, and the Permian, 7.

Shale gas lost 8 HRZ rigs. The Haynesville lost 2, the Marcellus, 6, the Utica 1, the Fayetteville, 1. The Woodford and Barnett each gained 1 rig.

(Click to enlarge)

(Click to enlarge)

(Click to enlarge)

Why The U.S. Can’t Be Called A ‘Swing Producer’

Why The U.S. Can’t Be Called A ‘Swing Producer’

They are wrong. It is preposterous to say that the world’s largest oil importer is also its swing producer.

There are two types of oil producers in the world: those who have the will and the means to affect market prices, and those who react to them. In other words, the swing producer and everyone else.

A swing producer must meet the following criteria:

• A swing producer must be a net exporter of oil.

• A swing producer must have enough daily production, spare capacity and reserves to influence market prices by balancing supply and demand through increasing or decreasing output.

• A swing producer must be able to act authoritatively and quickly to increase or decrease output.

• In the real world, a swing producer is a euphemism for a cartel. No single producer has enough oil leverage to balance the market and influence prices by itself. That includes Saudi Arabia, Russia, and the United States, the top 3 producers in the world. Obviously, it also includes U.S. tight oil.

• A swing producer must have low production costs and have the financial reserves to withstand reduced cash flow when restricting or increasing supply is necessary to balance the market.

So, let’s go down the list for OPEC and U.S. tight oil.

Related: 10 Key Energy Trends To Watch For In 2016

OPEC’s net exports for 2014 were 23 million barrels per day (mmbpd) (Figure 1). U.S. net exports were -7 mmbpd. In other words, the U.S. is a net importer of crude oil. A net importer of oil cannot be a swing producer.

Figure 1. OPEC and U.S. 2014 net crude oil exports.
Source: OPEC & Labyrinth Consulting Services, Inc.

(Click image to enlarge)

…click on the above link to read the rest of the article…

Just About Every Part of the Permian Basin is Unprofitable at $30 Per Barrel

Just About Every Part of the Permian Basin is Unprofitable at $30 Per Barrel

Sorry about that. I know that many believe that U.S. shale and tight oil plays are commercial even at current low oil prices but data on the Permian basin and Bakken plays simply does not support that belief.

To make matters worse, Pioneer and EOG have made outrageous claims about Permian basin reserves in their 3rd quarter 2015 earnings reports that no sensible person should believe. Statements like these simply add to the mistaken idea that tight oil plays get a pass on the laws of physics and economics and that somehow the U.S. is going to beat Saudi Arabia as the low-cost “swing producer” of the world. I wish that were true but trust me–based on data, that’s not going to happen.

The Permian basin is one of the oldest producing areas in the United States. It has been thoroughly drilled and is in a hyper-mature phase of development. The Spraberry, Wolfcamp and Bone Springs plays that Pioneer and EOG are pursuing (Figure 1) are really secondary recovery projects in which horizontal drilling and hydraulic fracturing have replaced water and CO2 injection methods used in the past. Few new reserves should be expected. Most of the claims that these companies make are really about higher recovery efficiency of existing reserves.

Related: The Golden Age Of Coal In China Is Over

None of these plays are remotely commercial at present oil prices. In the most-likely per-well reserve case, these plays require break-even oil prices in the range of at least $50-$75 per barrel, and current wellhead prices in the basin are less than $30 per barrel.

…click on the above link to read the rest of the article…

Olduvai IV: Courage
Click on image to read excerpts

Olduvai II: Exodus
Click on image to purchase

Click on image to purchase @ FriesenPress