

The State of the American Debt Slaves, Q1 2018
After the party, the hangover.
Total consumer credit rose 5.1% in the first quarter, compared to a year earlier, or by $184 billion, to $3.824 trillion (not seasonally adjusted), according to the Federal Reserve. This includes credit-card debt, auto loans, and student loans, but not mortgage-related debt. That 5.1% year-over-year increase isn’t setting any records – in 2011, year-over-year increases ran over 11%. But it does show that Americans are dealing with the economy and their joys and woes the American way: by piling on debt faster than the overall economy is growing.
The chart below shows the progression of consumer debt since 2006. In line with seasonal patterns for first quarters, consumer credit (not seasonally adjusted) edged down from Q4, as the spending binge of the holiday shopping season turned into hangover, an annual American ritual:
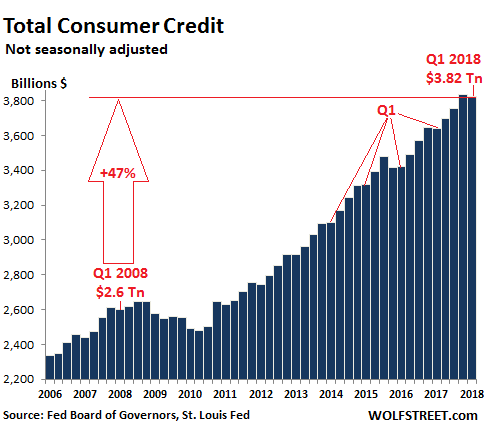
Note how the dip after the Financial Crisis – when consumers deleveraged mostly by defaulting on those debts – didn’t last long. Over the 10 years since Q1 2008, consumer debt has now surged 47%. Over the same period, the consumer price index has increased 16.9%:
Auto loans and leases for new and used vehicles rose by 3.8% from a year ago, or by $41 billion, to $1.118 trillion.
It was one of the smaller increases since the Great Recession: The peak year-over-year jumps occurred at the peak of the new vehicle sales boom in the US in Q3 2015 ($87 billion or 9%). However, the still standing records were set in Q1 and Q2 2001 near the end of the recession, with each quarter adding around $93 billion, or 16%, year-over-year.
Loan balances are impacted by prices of vehicles, number of vehicles financed, the average loan-to-value ratio, duration of prior loans (when they’re paid off), and other factors. So this chart is not necessarily a reflection of how many new and used vehicles were sold.
…click on the above link to read the rest of the article…

